Estimated zip code population in 2022: 18,189 Zip code population in 2010: 18,763 Zip code population in 2000: 19,282
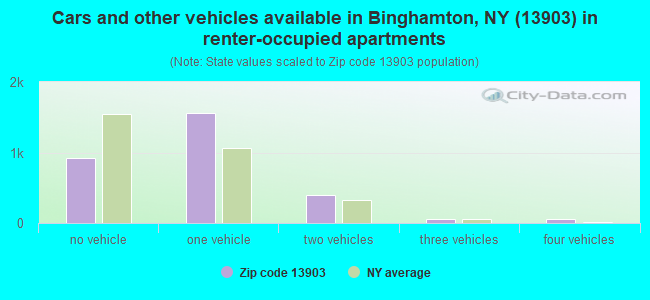
Houses and condos: 8,868 Renter-occupied apartments: 2,989
% of renters here:
36%
State:
46%
March 2022 cost of living index in zip code 13903: 100.2 (near average, U.S. average is 100)
Land area: 39.6 sq. mi. Water area: 0.5 sq. mi.
Population density: 459 people per square mile
(low).
OSM Map
General Map
Google Map
MSN Map
OSM Map
General Map
Google Map
MSN Map
OSM Map
General Map
Google Map
MSN Map
OSM Map
General Map
Google Map
MSN Map
Please wait while loading the map...
Real estate property taxes paid for housing units in 2022:
This zip code:
2.6% ($3,845)
New York:
1.5% ($6,180)
Median real estate property taxes paid for housing units with mortgages in 2022: $4,269 (2.6%) Median real estate property taxes paid for housing units with no mortgage in 2022: $3,249 (2.6%)
Averages for the 2020 tax year for zip code 13903, filed in 2021:
Average Adjusted Gross Income (AGI) in 2020: $63,409 (Individual Income Tax Returns)
Here:
$63,409
State:
$90,930
Salary/wage: $50,112 (reported on 80.2% of returns)
Here:
$50,112
State:
$72,104
(% of AGI for various income ranges: 1090.5% for AGIs below $25k, 3222.7% for AGIs $25k-50k, 5920.5% for AGIs $50k-75k, 8634.2% for AGIs $75k-100k, 16176.4% for AGIs $100k-200k, 76231.1% for AGIs over 200k)
Taxable interest for individuals: $1,080 (reported on 39.9% of returns)
This zip code:
$1,080
New York:
$3,075
(% of AGI for various income ranges: 9.6% for AGIs below $25k, 16.6% for AGIs $25k-50k, 32.4% for AGIs $50k-75k, 75.4% for AGIs $75k-100k, 224.1% for AGIs $100k-200k, 1358.9% for AGIs over 200k)
Ordinary dividends: $5,401 (reported on 20.1% of returns)
Here:
$5,401
State:
$11,095
(% of AGI for various income ranges: 27.3% for AGIs below $25k, 29.2% for AGIs $25k-50k, 72.0% for AGIs $50k-75k, 143.3% for AGIs $75k-100k, 438.9% for AGIs $100k-200k, 4785.6% for AGIs over 200k)
Net capital gain/loss in AGI: +$15,958 (reported on 16.2% of returns)
Here:
+$15,958
State:
+$44,925
(% of AGI for various income ranges: 13.4% for AGIs below $25k, 28.0% for AGIs $25k-50k, 65.1% for AGIs $50k-75k, 151.3% for AGIs $75k-100k, 723.0% for AGIs $100k-200k, 17673.3% for AGIs over 200k)
Profit/loss from business: +$14,324 (reported on 11.6% of returns)
Here:
+$14,324
State:
+$14,940
(% of AGI for various income ranges: 63.7% for AGIs below $25k, 79.8% for AGIs $25k-50k, 140.3% for AGIs $50k-75k, 224.8% for AGIs $75k-100k, 659.1% for AGIs $100k-200k, 5783.3% for AGIs over 200k)
Taxable individual retirement arrangement distribution: $17,171 (reported on 10.1% of returns)
13903:
$17,171
New York:
$19,609
(% of AGI for various income ranges: 54.8% for AGIs below $25k, 76.1% for AGIs $25k-50k, 176.9% for AGIs $50k-75k, 376.3% for AGIs $75k-100k, 1029.5% for AGIs $100k-200k, 3216.7% for AGIs over 200k)
Self-employed (Keogh) retirement plans: $17,783 (reported on 0.7% of returns)
13903:
$17,783
New York:
$32,497
(% of AGI for various income ranges: 41.1% for AGIs $50k-75k, 770.0% for AGIs over 200k)
Total itemized deductions: $29,338 (reported on 4.3% of returns)
Here:
$29,338
State:
$39,326
(% of AGI for various income ranges: 31.6% for AGIs below $25k, 30.9% for AGIs $25k-50k, 161.2% for AGIs $50k-75k, 282.9% for AGIs $75k-100k, 573.0% for AGIs $100k-200k, 3780.0% for AGIs over 200k)
Charity contributions: $10,146 (reported on 3.3% of returns)
Here:
$10,146
State:
$15,420
(% of AGI for various income ranges: 6.8% for AGIs below $25k, 24.8% for AGIs $50k-75k, 44.0% for AGIs $75k-100k, 141.1% for AGIs $100k-200k, 1606.7% for AGIs over 200k)
Taxes paid: $8,176 (reported on 4.4% of returns)
13903:
$8,176
State:
$9,183
(% of AGI for various income ranges: 5.5% for AGIs below $25k, 6.6% for AGIs $25k-50k, 44.5% for AGIs $50k-75k, 105.6% for AGIs $75k-100k, 190.0% for AGIs $100k-200k, 928.9% for AGIs over 200k)
Earned income credit: $2,248 (reported on 16.4% of returns)
Here:
$2,248
State:
$2,138
(% of AGI for various income ranges: 87.7% for AGIs below $25k, 62.6% for AGIs $25k-50k)
Percentage of individuals using paid preparers for their 2020 taxes: 95.5%
Here:
95%
State:
95%
(% for various income ranges: 95.2% for AGIs below $25k, 95.8% for AGIs $25k-50k, 95.9% for AGIs $50k-75k, 93.5% for AGIs $75k-100k, 96.1% for AGIs $100k-200k, 96.8% for AGIs over 200k)
Averages for the 2012 tax year for zip code 13903, filed in 2013:
Average Adjusted Gross Income (AGI) in 2012: $51,098 (Individual Income Tax Returns)
Here:
$51,098
State:
$77,088
Salary/wage: $43,080 (reported on 82.7% of returns)
Here:
$43,080
State:
$60,593
(% of AGI for various income ranges: 73.1% for AGIs below $25k, 76.3% for AGIs $25k-50k, 73.8% for AGIs $50k-75k, 73.3% for AGIs $75k-100k, 72.3% for AGIs $100k-200k, 54.3% for AGIs over 200k)
Taxable interest for individuals: $1,080 (reported on 42.2% of returns)
This zip code:
$1,080
New York:
$3,125
(% of AGI for various income ranges: 0.9% for AGIs below $25k, 0.6% for AGIs $25k-50k, 0.7% for AGIs $50k-75k, 0.9% for AGIs $75k-100k, 0.7% for AGIs $100k-200k, 1.5% for AGIs over 200k)
Ordinary dividends: $5,511 (reported on 22.1% of returns)
Here:
$5,511
State:
$10,299
(% of AGI for various income ranges: 1.5% for AGIs below $25k, 1.1% for AGIs $25k-50k, 1.2% for AGIs $50k-75k, 1.3% for AGIs $75k-100k, 2.1% for AGIs $100k-200k, 5.8% for AGIs over 200k)
Net capital gain/loss in AGI: +$7,660 (reported on 14.6% of returns)
Here:
+$7,660
State:
+$42,474
(% of AGI for various income ranges: 0.4% for AGIs $25k-50k, 0.3% for AGIs $50k-75k, 0.8% for AGIs $75k-100k, 1.1% for AGIs $100k-200k, 8.3% for AGIs over 200k)
Profit/loss from business: +$15,040 (reported on 11.9% of returns)
Here:
+$15,040
State:
+$16,168
(% of AGI for various income ranges: 5.8% for AGIs below $25k, 2.8% for AGIs $25k-50k, 2.2% for AGIs $50k-75k, 2.0% for AGIs $75k-100k, 3.6% for AGIs $100k-200k, 4.7% for AGIs over 200k)
Taxable individual retirement arrangement distribution: $12,482 (reported on 11.3% of returns)
13903:
$12,482
New York:
$17,621
(% of AGI for various income ranges: 3.2% for AGIs below $25k, 2.4% for AGIs $25k-50k, 2.6% for AGIs $50k-75k, 3.5% for AGIs $75k-100k, 2.9% for AGIs $100k-200k, 2.3% for AGIs over 200k)
Self-employment retirement plans: $20,529 (reported on 0.8% of returns)
13903:
$20,529
New York:
$27,330
Total itemized deductions: $21,537 (19% of AGI, reported on 26.5% of returns)
Here:
$21,537
State:
$34,985
Here:
19.2% of AGI
State:
21.3% of AGI
(% of AGI for various income ranges: 5.7% for AGIs below $25k, 7.1% for AGIs $25k-50k, 10.6% for AGIs $50k-75k, 11.0% for AGIs $75k-100k, 14.8% for AGIs $100k-200k, 13.7% for AGIs over 200k)
Charity contributions: $3,063 (reported on 20.8% of returns)
Here:
$3,063
State:
$5,572
(% of AGI for various income ranges: 0.3% for AGIs below $25k, 0.6% for AGIs $25k-50k, 1.1% for AGIs $50k-75k, 1.3% for AGIs $75k-100k, 1.8% for AGIs $100k-200k, 1.7% for AGIs over 200k)
Taxes paid: $11,759 (reported on 26.4% of returns)
13903:
$11,759
State:
$18,656
(% of AGI for various income ranges: 1.6% for AGIs below $25k, 2.9% for AGIs $25k-50k, 4.8% for AGIs $50k-75k, 5.6% for AGIs $75k-100k, 8.5% for AGIs $100k-200k, 9.5% for AGIs over 200k)
Earned income credit: $2,216 (reported on 18.9% of returns)
Here:
$2,216
State:
$2,230
(% of AGI for various income ranges: 6.3% for AGIs below $25k, 0.9% for AGIs $25k-50k)
Percentage of individuals using paid preparers for their 2012 taxes: 47.4%
Here:
47%
State:
66%
(% for various income ranges: 40.6% for AGIs below $25k, 45.6% for AGIs $25k-50k, 51.9% for AGIs $50k-75k, 54.9% for AGIs $75k-100k, 62.8% for AGIs $100k-200k, 81.8% for AGIs over 200k)
Averages for the 2004 tax year for zip code 13903, filed in 2005:
Average Adjusted Gross Income (AGI) in 2004: $43,283 (Individual Income Tax Returns)
Here:
$43,283
State:
$59,519
Salary/wage: $36,650 (reported on 83.7% of returns)
Here:
$36,650
State:
$50,673
(% of AGI for various income ranges: 84.6% for AGIs below $10k, 73.8% for AGIs $10k-25k, 80.4% for AGIs $25k-50k, 77.3% for AGIs $50k-75k, 78.5% for AGIs $75k-100k, 57.6% for AGIs over 100k)
Taxable interest for individuals: $1,368 (reported on 53.1% of returns)
This zip code:
$1,368
New York:
$2,377
(% of AGI for various income ranges: 4.2% for AGIs below $10k, 1.9% for AGIs $10k-25k, 1.2% for AGIs $25k-50k, 1.3% for AGIs $50k-75k, 1.8% for AGIs $75k-100k, 1.8% for AGIs over 100k)
Taxable dividends: $2,507 (reported on 28.4% of returns)
Here:
$2,507
State:
$5,394
(% of AGI for various income ranges: 2.7% for AGIs below $10k, 1.4% for AGIs $10k-25k, 0.9% for AGIs $25k-50k, 1.3% for AGIs $50k-75k, 1.2% for AGIs $75k-100k, 2.4% for AGIs over 100k)
Net capital gain/loss: +$6,669 (reported on 20.2% of returns)
Here:
+$6,669
State:
+$23,581
(% of AGI for various income ranges: -1.3% for AGIs below $10k, 0.8% for AGIs $10k-25k, 0.3% for AGIs $25k-50k, 1.1% for AGIs $50k-75k, 1.3% for AGIs $75k-100k, 7.4% for AGIs over 100k)
Profit/loss from business: +$12,828 (reported on 11.6% of returns)
Here:
+$12,828
State:
+$13,809
(% of AGI for various income ranges: -0.6% for AGIs below $10k, 3.9% for AGIs $10k-25k, 2.3% for AGIs $25k-50k, 2.8% for AGIs $50k-75k, 2.5% for AGIs $75k-100k, 4.9% for AGIs over 100k)
IRA payment deduction: $2,925 (reported on 2.8% of returns)
13903:
$2,925
New York:
$3,115
(% of AGI for various income ranges: 0.3% for AGIs $10k-25k, 0.3% for AGIs $25k-50k, 0.3% for AGIs $50k-75k, 0.1% for AGIs $75k-100k, 0.1% for AGIs over 100k)
Self-employed pension: $14,363 (reported on 1.2% of returns)
Here:
$14,363
New York:
$19,016
(% of AGI for various income ranges: 0.1% for AGIs $10k-25k, 0.2% for AGIs $50k-75k, 0.2% for AGIs $75k-100k, 0.9% for AGIs over 100k)
Total itemized deductions: $17,551 (18% of AGI, reported on 26.5% of returns)
Here:
$17,551
State:
$25,864
Here:
18.5% of AGI
State:
21.9% of AGI
(% of AGI for various income ranges: 3.5% for AGIs below $10k, 5.1% for AGIs $10k-25k, 8.0% for AGIs $25k-50k, 11.0% for AGIs $50k-75k, 13.8% for AGIs $75k-100k, 13.1% for AGIs over 100k)
Charity contributions deductions: $2,794 (3% of AGI, reported on 23.2% of returns)
Here:
$2,794
State:
$4,439
Here:
2.8% of AGI
State:
3.6% of AGI
(% of AGI for various income ranges: 0.2% for AGIs below $10k, 0.4% for AGIs $10k-25k, 0.9% for AGIs $25k-50k, 1.4% for AGIs $50k-75k, 2.0% for AGIs $75k-100k, 2.1% for AGIs over 100k)
Total tax: $7,030 (reported on 72.9% of returns)
13903:
$7,030
State:
$11,730
(% of AGI for various income ranges: 1.7% for AGIs below $10k, 4.0% for AGIs $10k-25k, 7.2% for AGIs $25k-50k, 9.3% for AGIs $50k-75k, 10.5% for AGIs $75k-100k, 19.2% for AGIs over 100k)
Earned income credit: $1,710 (reported on 16.4% of returns)
Here:
$1,710
State:
$1,757
Percentage of individuals using paid preparers for their 2004 taxes: 56.0%
Here:
56%
State:
67%
(% for various income ranges: 48.7% for AGIs below $10k, 56.1% for AGIs $10k-25k, 55.7% for AGIs $25k-50k, 61.5% for AGIs $50k-75k, 59.2% for AGIs $75k-100k, 66.6% for AGIs over 100k)
Likely homosexual households (counted as self-reported same-sex unmarried-partner households)
Lesbian couples: 0.2% of all households
Gay men: 0.0% of all households
Household received Food Stamps/SNAP in the past 12 months: 1,822 Household did not receive Food Stamps/SNAP in the past 12 months: 6,526
Women who had a birth in the past 12 months: 352 (207 now married, 147 unmarried) Women who did not have a birth in the past 12 months: 3,539 (1,004 now married, 2,549 unmarried)
Housing units in zip code 13903 with a mortgage: 2,957 (439 second mortgage, 9 home equity loan, 407 both second mortgage and home equity loan) Houses without a mortgage: 282
Median monthly owner costs for units with a mortgage: $1,341 Median monthly owner costs for units without a mortgage: $595
Residents with income below the poverty level in 2022:
This zip code:
19.1%
Whole state:
14.3%
Residents with income below 50% of the poverty level in 2022:
This zip code:
8.6%
Whole state:
6.8%
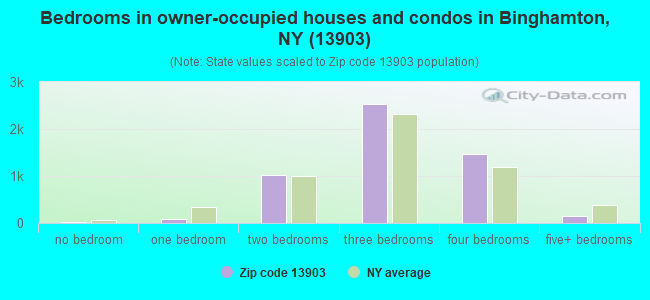
Median number of rooms in houses and condos:
Here:
6.5
State:
6.3
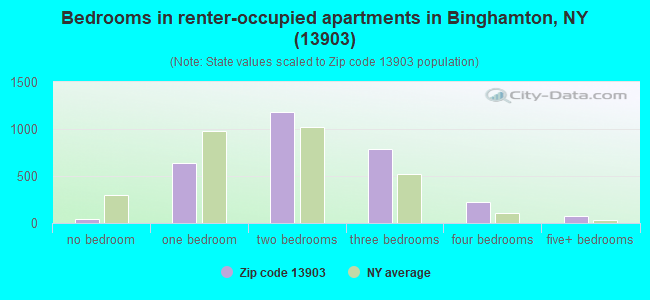
Median number of rooms in apartments:
Here:
4.9
State:
3.8
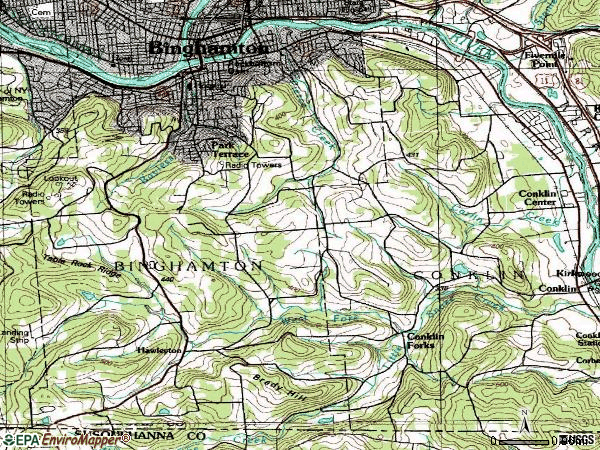
Notable locations in this zip code not listed on our city pages
Notable locations in zip code 13903: Binghamton Water Works (A), Indian Trail Camp (B), Vestal Hills Golf Club (C), Southern Tier Zoological Society (D), Fiatos Orchard (E), Lone Maple Farm (F), Pine Line Tree Farms (G), Susquehanna Valley Home (H), Binghamton Fire Department Station 1 (I), Saint John's Parish Hall (J), House of the Good Shepherd Home for Aged Women (K), Binghamton Hose Company Number 5 (L), Discovery Center of the Southern Tier (M), Binghamton Fire Department Training Facility (N). Display/hide their locations on the map
Churches in zip code 13903 include: Church of God and Saints (A), Conklin Forks United Methodist Church (B), Faith Bible Church (C), First Ukranian Pentecostal Church (D), Hawleyton United Methodist Church (E), Park Terrace Baptist Church (F), Saint Andrew's Roman Catholic Church (G), Conklin Baptist Church (H), High Street Methodist Episcopal Church (I). Display/hide their locations on the map
Cemeteries: Ingraham Hill Cemetery (1), Cline Family Cemetery (2), Brady Hill Cemetery (3), Hawleyton Cemetery (4), Levee Family Cemetery (5), Finch Family Cemetery (6), Methodist Church Cemetery (7). Display/hide their locations on the map
Lakes and reservoirs: Jackson Pond (A), Monahan Pond (B), Tripps Pond (C), Clines Pond (D), Agwaterra Pond (E), South Mountain Reservoir (F). Display/hide their locations on the map
Streams, rivers, and creeks: Gratsinger Run (A), Park Creek (B), Pierce Creek (C), Bayless Creek (D), West Fork Little Snake Creek (E), Horton Creek (F). Display/hide their locations on the map
Parks in zip code 13903 include: South Mountain Park (1), Ross Park (2), Johnson-McArthur Field (3), Southside Park (4). Display/hide their locations on the map
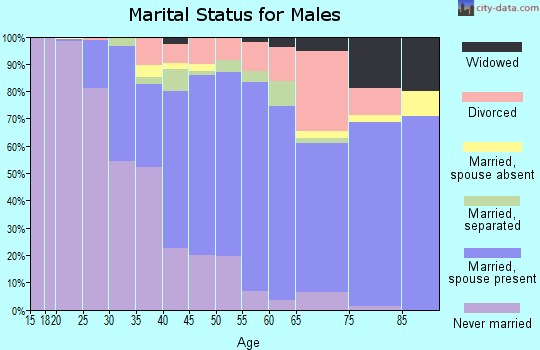
1,930 married couples with children.
1,319 single-parent households (308 men, 1,011 women).
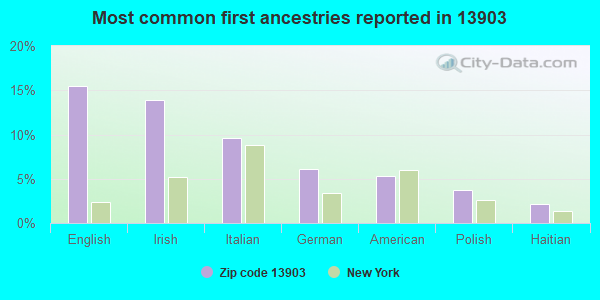
90.1% of residents of 13903 zip code speak English at home.
3.1% of residents speak Spanish at home (64% very well, 12% well, 17% not well, 6% not at all).
4.7% of residents speak other Indo-European language at home (78% very well, 17% well, 4% not well).
0.9% of residents speak Asian or Pacific Island language at home (91% very well, 3% well, 6% not well).
0.9% of residents speak other language at home (62% very well, 16% well, 22% not well).
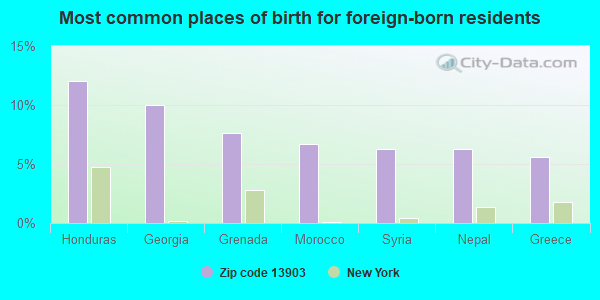
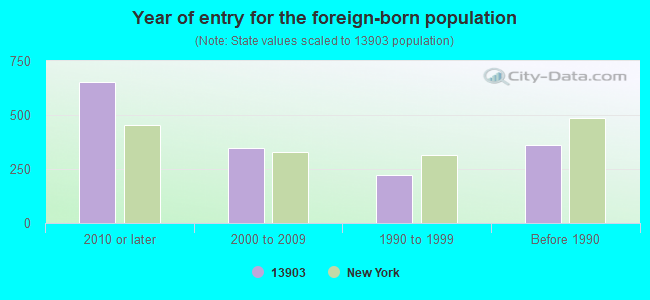
Foreign born population: 1,430 (7.9%) (48.6% of them are naturalized citizens)
Facilities with environmental interests located in this zip code:
CROWLEY FOODS (145 CONKLIN AVE. in BINGHAMTON, NY)
STATE MASTER (New York facility tracking) - AIR PROGRAM, National Pollutant Discharge Elimination System Permit, (Integrated Compliance Information System) - ICIS-02-1990-0197, FORMAL ENFORCEMENT ACTION ENFORCEMENT/COMPLIANCE ACTIVITY (Integrated Compliance Information System) COMPLIANCE ACTIVITY (Tracking inspections of insecticide, fungicide, and rodenticide, and toxic substances) National Pollutant Discharge Elimination System NON-MAJOR (Tracking pollutant discharge elimination systems) - permit TRI REPORTER (Tracking of toxic chemicals releasing facilities) - ICIS-, ENFORCEMENT/COMPLIANCE ACTIVITY Business SIC classification: FLUID MILK; NONCLASSIFIABLE ESTABLISHMENTS Organizations: CROWLEY FOODS INC (CONTACT/OWNER)
, CROWLEY FOODS LLC (LEGALLY RESPONSIBLE PARTY)
Alternative names: CROWLEY FOODS, LLC
ALLSPEC FINISHING CORP (30 CHARLOTTE ST in BINGHAMTON, NY)
AIR MINOR (AIRS/AFS) STATE MASTER (New York facility tracking) - AIR PROGRAM, Business SIC classification: COATING, ENGRAVING, AND ALLIED SERVICES Organizations: ALLSPEC FINISHING CORPORATION (LEGALLY RESPONSIBLE PARTY)
Alternative names: DUNN & MCCARTHY INCORPORATED
AMERADA HESS SERVICE STATION (1153 VESTAL AVE in BINGHAMTON, NY)
STATE MASTER (New York facility tracking) - AIR PROGRAM Conditionally Exempt Small Quantity Generators, less than 100 kg/month of hazardous waste (Resource Conservation and Recovery Act (tracking hazardous waste)) Business SIC classification: GASOLINE SERVICE STATIONS Organizations: SUNOCO INC (LEGALLY RESPONSIBLE PARTY)
Alternative names: AMERADA HESS STATION 32436
AMERADA HESS STATION 32437 (236 CONKLIN AVE in BINGHAMTON, NY)
STATE MASTER (New York facility tracking) - AIR PROGRAM Conditionally Exempt Small Quantity Generators, less than 100 kg/month of hazardous waste (Resource Conservation and Recovery Act (tracking hazardous waste)) Business SIC classification: GASOLINE SERVICE STATIONS Organizations: SUNOCO INC (LEGALLY RESPONSIBLE PARTY)
Alternative names: AMERADA HESS SERVICE STATION
BENJAMIN FRANKLIN ES ( in BINGHAMTON, NY)
(National Center for Education Statistics) - STATE ID-030200010005 Organizations: BINGHAMTON CITY SD (SCHOOL DISTRICT)
BENJAMIN FRANKLIN SCHOOL (262 CONKLIN AVE in BINGHAMTON, NY)
(Resource Conservation and Recovery Act (tracking hazardous waste))
#1 PREFERRED USED CARS (255-57 CONKLIN AVE in BINGHAMTON, NY)
Conditionally Exempt Small Quantity Generators, less than 100 kg/month of hazardous waste (Resource Conservation and Recovery Act (tracking hazardous waste)) - notification Organizations: GARY STEVENS (CONTACT/OWNER)
GLOBAL SIGN SYSTEMS (29 MOORE ST in BINGHAMTON, NY)
Small Quantity Generators, between 100 kg and 1000 kg of hazardous waste/month (Resource Conservation and Recovery Act (tracking hazardous waste)) - notification Organizations: BOB KLINK - JOHN LAWTON (CONTACT/OWNER)
HUEBNERS INC (3450 HANCE RD in BINGHAMTON, NY)
Conditionally Exempt Small Quantity Generators, less than 100 kg/month of hazardous waste (Resource Conservation and Recovery Act (tracking hazardous waste)) - notification Organizations: TERRY HUBNER (CONTACT/OWNER)
IKON OFFICE SOLUTIONS (21 S WASHINGTON ST in BINGHAMTON, NY)
Conditionally Exempt Small Quantity Generators, less than 100 kg/month of hazardous waste (Resource Conservation and Recovery Act (tracking hazardous waste)) - notification Organizations: JOHN STEWART (CONTACT/OWNER)
CRAFTSMEN AUTO BODY CLINIC (570 HANCE RD in BINGHAMTON, NY)
Conditionally Exempt Small Quantity Generators, less than 100 kg/month of hazardous waste (Resource Conservation and Recovery Act (tracking hazardous waste)) - notification Organizations: THOMAS F EGAN (CONTACT/OWNER)
Housing units lacking complete plumbing facilities: 1.4% Housing units lacking complete kitchen facilities: 1.9%
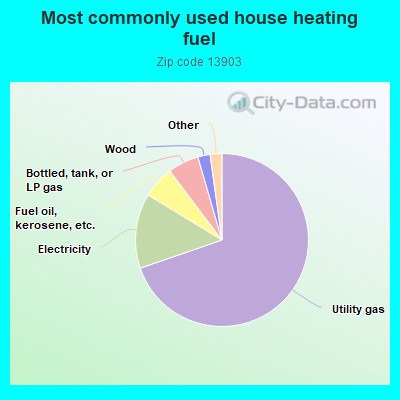
69.8%Utility gas
14.0%Electricity
6.0%Fuel oil, kerosene, etc.
5.8%Bottled, tank, or LP gas
2.3%Wood
0.9%No fuel used
0.9%Other fuel
Population in 1990: 20,353.
Place of birth for U.S.-born residents:
This state: 13,446
Northeast: 1,478
Midwest: 501
South: 995
West: 179
64% of the 13903 zip code residents lived in the same house 5 years ago. Out of people who lived in different houses, 73% lived in this county. Out of people who lived in different counties, 50% lived in New York.
90% of the 13903 zip code residents lived in the same house 1 year ago. Out of people who lived in different houses, 65% moved from this county. Out of people who lived in different houses, 20% moved from different county within same state. Out of people who lived in different houses, 13% moved from different state.
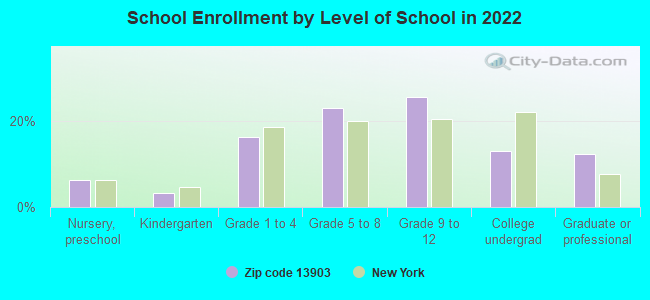
Private vs. public school enrollment:
Students in private schools in grades 1 to 8 (elementary and middle school): 272
Here:
16.9%
New York:
15.6%
Students in private schools in grades 9 to 12 (high school): 74
Here:
7.1%
New York:
15.0%
Students in private undergraduate colleges: 87
Here:
16.8%
New York:
39.2%
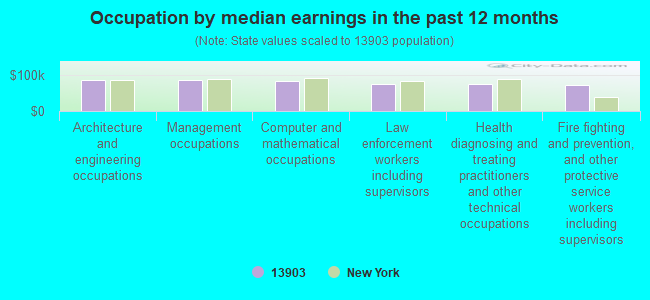
Occupation by median earnings in the past 12 months ($)
85,729Architecture and engineering occupations
84,348Management occupations
83,312Computer and mathematical occupations
74,869Law enforcement workers including supervisors
73,644Health diagnosing and treating practitioners and other technical occupations
71,104Fire fighting and prevention, and other protective service workers including supervisors
Companies with federal contracts located in this zip code:
JOHNSON OUTDOORS INC (625 CONKLIN RD in BINGHAMTON, NY; small business) : $55,719,071 in 84 contractsfrom 2000 to 2006
Contracts for Tents and Tarpaulins, Luggage, Medical and Surgical Instruments, Equipment, and Supplies, Textile Fabrics, and moreby Army, Defense Logistics Agency, Department of Veterans Affairs, Air Force, and others Signed by year:2000: $19,853,537; 2001: $10,055,528; 2002: $482,141; 2003: $3,970,238; 2004: $805,711; 2005: $11,953,211; 2006: $8,598,705.
Biggest contracts:
$6,084,239 with Army for Tents and Tarpaulins. Signed on 2000-10-13. Completion date: 2001-06-13.
$5,252,247 with Defense Logistics Agency for Tents and Tarpaulins. Signed on 2005-09-30. Completion date: 2006-01-12.
$5,135,916 with Army for Tents and Tarpaulins. Signed on 2000-01-13. Completion date: 2001-01-06.
$4,504,734 with Army for Luggage. Signed on 2001-02-16. Completion date: 2001-12-21.
PARACO CORP (10 JACKSON ST in BINGHAMTON, NY; small business) : $25,492 in 5 contractsfrom 2003 to 2006
Contracts for Iron and Steel Primary and Semifinished Products, Flags and Pennants by Army, Department of Defense, Air Force, Navy, and others Signed by year:2000: $0; 2001: $0; 2002: $0; 2003: $6,038; 2004: $0; 2005: $14,554; 2006: $4,900.
Biggest contracts:
$8,000 with Army for Iron and Steel Primary and Semifinished Products. Signed on 2005-05-24. Completion date: 2005-06-06.
$6,038 with Department of Defense for Flags and Pennants. Signed on 2003-06-10. Completion date: 2003-06-11.
$4,900 with Air Force for Flags and Pennants. Signed on 2006-06-13. Completion date: 2006-06-20.
$3,984, same as above.Signed on 2005-09-22. Completion date: 2005-09-30.
Top industries in this zip code by the number of employees in 2005:
Health Care and Social Assistance: General Medical and Surgical Hospitals (over 1000 employees: 1 establishment)
Health Care and Social Assistance: Offices of Physicians (except Mental Health Specialists) (50-99: 2, 20-49: 1, 10-19: 6, 5-9: 3, 1-4: 2)
2002 - 2018 National Fire Incident Reporting System (NFIRS) incidents
Based on the data from the years 2002 - 2018 the average number of fires per year is 32. The highest number of fires - 63 took place in 2004, and the least - 1 in 2007. The data has a decreasing trend.
When looking into fire subcategories, the most reports belonged to: Structure Fires (45.2%), and Outside Fires (30.9%).
Fire incident types reported to NFIRS in Zip Code 13903
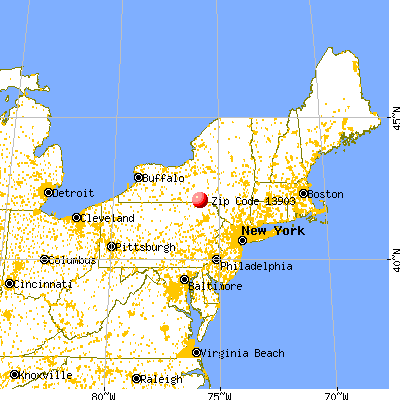


 Nearest zip codes: 13748, 13902, 18812, 13795, 13904, 18822.


 Based on the data from the years 2002 - 2018 the average number of fires per year is 32. The highest number of fires - 63 took place in 2004, and the least - 1 in 2007. The data has a decreasing trend.
 When looking into fire subcategories, the most reports belonged to: Structure Fires (45.2%), and Outside Fires (30.9%).