Estimated zip code population in 2022: 12,914 Zip code population in 2010: 14,870 Zip code population in 2000: 14,690
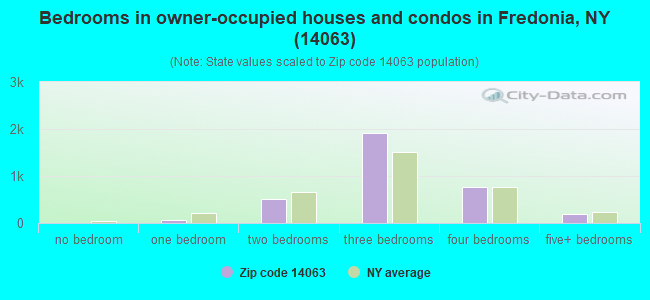
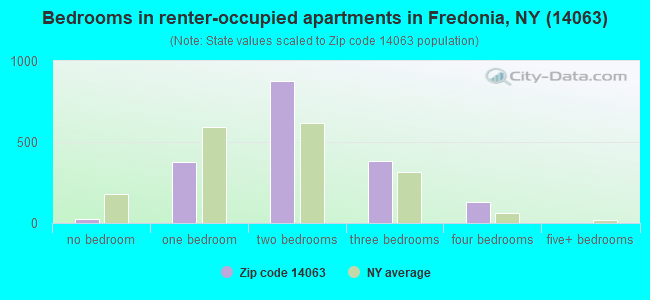
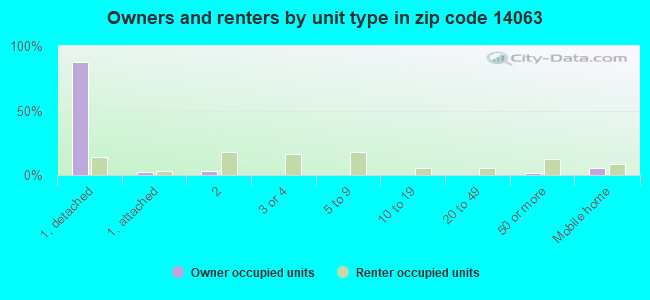
Houses and condos: 5,582 Renter-occupied apartments: 1,813
% of renters here:
35%
State:
46%
March 2022 cost of living index in zip code 14063: 84.4 (less than average, U.S. average is 100)
Land area: 50.4 sq. mi. Water area: 0.3 sq. mi.
Population density: 256 people per square mile
(very low).
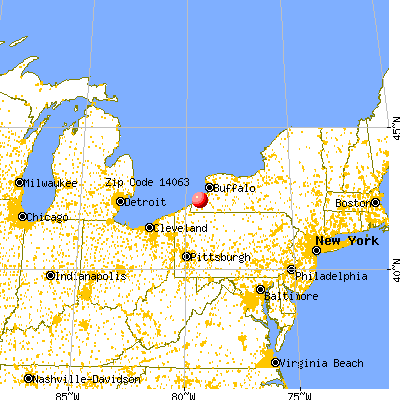
OSM Map
General Map
Google Map
MSN Map
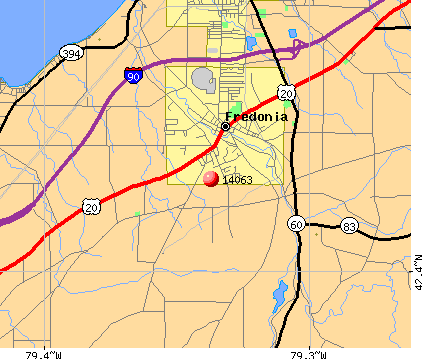
OSM Map
General Map
Google Map
MSN Map
OSM Map
General Map
Google Map
MSN Map
OSM Map
General Map
Google Map
MSN Map
Please wait while loading the map...
Real estate property taxes paid for housing units in 2022:
This zip code:
2.4% ($4,256)
New York:
1.5% ($6,180)
Median real estate property taxes paid for housing units with mortgages in 2022: $4,663 (2.6%) Median real estate property taxes paid for housing units with no mortgage in 2022: $3,654 (2.2%)
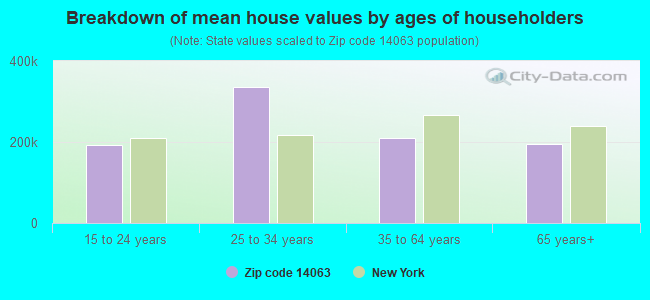
Estimated median house/condo value in 2022: $173,983
14063:
$173,983
New York:
$400,400
According to our research of New York and other state lists, there were 6 registered sex offenders living in 14063 zip code as of April 27, 2024. The ratio of all residents to sex offenders in zip code 14063 is 2,458 to 1. The ratio of registered sex offenders to all residents in this zip code is much lower than the state average.
Median resident age:
This zip code:
39.4 years
New York median age:
40.0 years
Average household size:
This zip code:
2.1 people
New York:
2.5 people
Averages for the 2020 tax year for zip code 14063, filed in 2021:
Average Adjusted Gross Income (AGI) in 2020: $62,294 (Individual Income Tax Returns)
Here:
$62,294
State:
$90,930
Salary/wage: $50,217 (reported on 77.4% of returns)
Here:
$50,217
State:
$72,104
(% of AGI for various income ranges: 1123.2% for AGIs below $25k, 3351.1% for AGIs $25k-50k, 5747.7% for AGIs $50k-75k, 8543.1% for AGIs $75k-100k, 15321.5% for AGIs $100k-200k, 46122.0% for AGIs over 200k)
Taxable interest for individuals: $1,143 (reported on 41.9% of returns)
This zip code:
$1,143
New York:
$3,075
(% of AGI for various income ranges: 18.6% for AGIs below $25k, 25.6% for AGIs $25k-50k, 43.2% for AGIs $50k-75k, 103.7% for AGIs $75k-100k, 144.7% for AGIs $100k-200k, 1510.0% for AGIs over 200k)
Ordinary dividends: $3,324 (reported on 26.6% of returns)
Here:
$3,324
State:
$11,095
(% of AGI for various income ranges: 31.7% for AGIs below $25k, 45.9% for AGIs $25k-50k, 107.5% for AGIs $50k-75k, 181.7% for AGIs $75k-100k, 347.0% for AGIs $100k-200k, 1868.0% for AGIs over 200k)
Net capital gain/loss in AGI: +$8,819 (reported on 20.7% of returns)
Here:
+$8,819
State:
+$44,925
(% of AGI for various income ranges: 20.3% for AGIs below $25k, 48.6% for AGIs $25k-50k, 90.7% for AGIs $50k-75k, 182.0% for AGIs $75k-100k, 677.4% for AGIs $100k-200k, 8962.0% for AGIs over 200k)
Profit/loss from business: +$13,348 (reported on 12.2% of returns)
Here:
+$13,348
State:
+$14,940
(% of AGI for various income ranges: 67.7% for AGIs below $25k, 65.1% for AGIs $25k-50k, 144.6% for AGIs $50k-75k, 180.6% for AGIs $75k-100k, 410.6% for AGIs $100k-200k, 7524.0% for AGIs over 200k)
Taxable individual retirement arrangement distribution: $16,889 (reported on 13.8% of returns)
14063:
$16,889
New York:
$19,609
(% of AGI for various income ranges: 70.5% for AGIs below $25k, 131.8% for AGIs $25k-50k, 310.5% for AGIs $50k-75k, 558.0% for AGIs $75k-100k, 949.8% for AGIs $100k-200k, 3772.0% for AGIs over 200k)
Self-employed (Keogh) retirement plans: $15,833 (reported on 0.6% of returns)
14063:
$15,833
New York:
$32,497
(% of AGI for various income ranges: 101.1% for AGIs $100k-200k)
Total itemized deductions: $30,721 (reported on 4.6% of returns)
Here:
$30,721
State:
$39,326
(% of AGI for various income ranges: 92.0% for AGIs $25k-50k, 183.3% for AGIs $50k-75k, 354.6% for AGIs $75k-100k, 460.2% for AGIs $100k-200k, 4026.0% for AGIs over 200k)
Charity contributions: $7,144 (reported on 3.4% of returns)
Here:
$7,144
State:
$15,420
(% of AGI for various income ranges: 46.3% for AGIs $50k-75k, 49.7% for AGIs $75k-100k, 108.3% for AGIs $100k-200k, 678.0% for AGIs over 200k)
Taxes paid: $8,033 (reported on 4.6% of returns)
14063:
$8,033
State:
$9,183
(% of AGI for various income ranges: 17.9% for AGIs $25k-50k, 51.2% for AGIs $50k-75k, 100.6% for AGIs $75k-100k, 156.8% for AGIs $100k-200k, 740.0% for AGIs over 200k)
Earned income credit: $2,087 (reported on 12.8% of returns)
Here:
$2,087
State:
$2,138
(% of AGI for various income ranges: 73.2% for AGIs below $25k, 59.2% for AGIs $25k-50k)
Percentage of individuals using paid preparers for their 2020 taxes: 96.2%
Here:
96%
State:
95%
(% for various income ranges: 95.1% for AGIs below $25k, 96.9% for AGIs $25k-50k, 96.2% for AGIs $50k-75k, 96.4% for AGIs $75k-100k, 96.4% for AGIs $100k-200k, 100.0% for AGIs over 200k)
Averages for the 2012 tax year for zip code 14063, filed in 2013:
Average Adjusted Gross Income (AGI) in 2012: $52,883 (Individual Income Tax Returns)
Here:
$52,883
State:
$77,088
Salary/wage: $44,935 (reported on 81.6% of returns)
Here:
$44,935
State:
$60,593
(% of AGI for various income ranges: 73.1% for AGIs below $25k, 73.9% for AGIs $25k-50k, 70.2% for AGIs $50k-75k, 70.5% for AGIs $75k-100k, 72.2% for AGIs $100k-200k, 50.3% for AGIs over 200k)
Taxable interest for individuals: $913 (reported on 47.5% of returns)
This zip code:
$913
New York:
$3,125
(% of AGI for various income ranges: 1.4% for AGIs below $25k, 0.6% for AGIs $25k-50k, 0.9% for AGIs $50k-75k, 0.7% for AGIs $75k-100k, 0.7% for AGIs $100k-200k, 1.2% for AGIs over 200k)
Ordinary dividends: $3,205 (reported on 29.5% of returns)
Here:
$3,205
State:
$10,299
(% of AGI for various income ranges: 2.3% for AGIs below $25k, 1.3% for AGIs $25k-50k, 1.4% for AGIs $50k-75k, 1.6% for AGIs $75k-100k, 1.4% for AGIs $100k-200k, 3.7% for AGIs over 200k)
Net capital gain/loss in AGI: +$5,316 (reported on 18.8% of returns)
Here:
+$5,316
State:
+$42,474
(% of AGI for various income ranges: 0.4% for AGIs $25k-50k, 1.0% for AGIs $50k-75k, 0.7% for AGIs $75k-100k, 1.7% for AGIs $100k-200k, 8.7% for AGIs over 200k)
Profit/loss from business: +$11,903 (reported on 13.8% of returns)
Here:
+$11,903
State:
+$16,168
(% of AGI for various income ranges: 3.6% for AGIs below $25k, 3.3% for AGIs $25k-50k, 1.5% for AGIs $50k-75k, 1.5% for AGIs $75k-100k, 2.8% for AGIs $100k-200k, 7.8% for AGIs over 200k)
Taxable individual retirement arrangement distribution: $12,108 (reported on 12.4% of returns)
14063:
$12,108
New York:
$17,621
(% of AGI for various income ranges: 3.3% for AGIs below $25k, 2.4% for AGIs $25k-50k, 3.7% for AGIs $50k-75k, 3.1% for AGIs $75k-100k, 2.3% for AGIs $100k-200k, 2.8% for AGIs over 200k)
Self-employment retirement plans: $27,967 (reported on 0.6% of returns)
14063:
$27,967
New York:
$27,330
Total itemized deductions: $19,686 (20% of AGI, reported on 31.2% of returns)
Here:
$19,686
State:
$34,985
Here:
19.9% of AGI
State:
21.3% of AGI
(% of AGI for various income ranges: 7.0% for AGIs below $25k, 8.2% for AGIs $25k-50k, 10.4% for AGIs $50k-75k, 11.1% for AGIs $75k-100k, 14.4% for AGIs $100k-200k, 14.5% for AGIs over 200k)
Charity contributions: $2,618 (reported on 26.2% of returns)
Here:
$2,618
State:
$5,572
(% of AGI for various income ranges: 0.7% for AGIs below $25k, 0.9% for AGIs $25k-50k, 1.2% for AGIs $50k-75k, 1.3% for AGIs $75k-100k, 1.7% for AGIs $100k-200k, 1.3% for AGIs over 200k)
Taxes paid: $9,983 (reported on 31.2% of returns)
14063:
$9,983
State:
$18,656
(% of AGI for various income ranges: 2.4% for AGIs below $25k, 4.0% for AGIs $25k-50k, 4.5% for AGIs $50k-75k, 5.4% for AGIs $75k-100k, 7.9% for AGIs $100k-200k, 8.2% for AGIs over 200k)
Earned income credit: $2,013 (reported on 14.0% of returns)
Here:
$2,013
State:
$2,230
(% of AGI for various income ranges: 5.0% for AGIs below $25k, 0.8% for AGIs $25k-50k)
Percentage of individuals using paid preparers for their 2012 taxes: 59.3%
Here:
59%
State:
66%
(% for various income ranges: 50.0% for AGIs below $25k, 58.4% for AGIs $25k-50k, 64.5% for AGIs $50k-75k, 67.9% for AGIs $75k-100k, 72.3% for AGIs $100k-200k, 88.9% for AGIs over 200k)
Averages for the 2004 tax year for zip code 14063, filed in 2005:
Average Adjusted Gross Income (AGI) in 2004: $40,182 (Individual Income Tax Returns)
Here:
$40,182
State:
$59,519
Salary/wage: $37,205 (reported on 82.2% of returns)
Here:
$37,205
State:
$50,673
(% of AGI for various income ranges: 117.6% for AGIs below $10k, 69.1% for AGIs $10k-25k, 78.6% for AGIs $25k-50k, 78.5% for AGIs $50k-75k, 76.2% for AGIs $75k-100k, 71.4% for AGIs over 100k)
Taxable interest for individuals: $1,074 (reported on 60.0% of returns)
This zip code:
$1,074
New York:
$2,377
(% of AGI for various income ranges: 7.1% for AGIs below $10k, 3.1% for AGIs $10k-25k, 1.5% for AGIs $25k-50k, 1.0% for AGIs $50k-75k, 1.4% for AGIs $75k-100k, 1.3% for AGIs over 100k)
Taxable dividends: $2,104 (reported on 33.0% of returns)
Here:
$2,104
State:
$5,394
(% of AGI for various income ranges: 5.1% for AGIs below $10k, 2.2% for AGIs $10k-25k, 1.2% for AGIs $25k-50k, 1.0% for AGIs $50k-75k, 1.6% for AGIs $75k-100k, 2.5% for AGIs over 100k)
Net capital gain/loss: +$2,157 (reported on 24.6% of returns)
Here:
+$2,157
State:
+$23,581
(% of AGI for various income ranges: -2.0% for AGIs below $10k, 0.2% for AGIs $10k-25k, 0.3% for AGIs $25k-50k, 1.0% for AGIs $50k-75k, 1.7% for AGIs $75k-100k, 2.8% for AGIs over 100k)
Profit/loss from business: +$8,571 (reported on 13.4% of returns)
Here:
+$8,571
State:
+$13,809
(% of AGI for various income ranges: 0.4% for AGIs below $10k, 3.8% for AGIs $10k-25k, 3.2% for AGIs $25k-50k, 2.3% for AGIs $50k-75k, 1.9% for AGIs $75k-100k, 3.6% for AGIs over 100k)
IRA payment deduction: $2,911 (reported on 2.8% of returns)
14063:
$2,911
New York:
$3,115
(% of AGI for various income ranges: 0.3% for AGIs $10k-25k, 0.5% for AGIs $25k-50k, 0.1% for AGIs $50k-75k, 0.1% for AGIs $75k-100k, 0.1% for AGIs over 100k)
Self-employed pension: $12,152 (reported on 0.6% of returns)
Here:
$12,152
New York:
$19,016
Total itemized deductions: $16,504 (22% of AGI, reported on 30.3% of returns)
Here:
$16,504
State:
$25,864
Here:
21.7% of AGI
State:
21.9% of AGI
(% of AGI for various income ranges: 8.4% for AGIs below $10k, 7.4% for AGIs $10k-25k, 9.1% for AGIs $25k-50k, 12.6% for AGIs $50k-75k, 13.9% for AGIs $75k-100k, 16.2% for AGIs over 100k)
Charity contributions deductions: $2,465 (3% of AGI, reported on 28.1% of returns)
Here:
$2,465
State:
$4,439
Here:
3.2% of AGI
State:
3.6% of AGI
(% of AGI for various income ranges: 0.4% for AGIs below $10k, 0.7% for AGIs $10k-25k, 1.1% for AGIs $25k-50k, 1.7% for AGIs $50k-75k, 2.0% for AGIs $75k-100k, 2.5% for AGIs over 100k)
Total tax: $5,341 (reported on 74.8% of returns)
14063:
$5,341
State:
$11,730
(% of AGI for various income ranges: 2.5% for AGIs below $10k, 4.1% for AGIs $10k-25k, 7.2% for AGIs $25k-50k, 8.8% for AGIs $50k-75k, 10.4% for AGIs $75k-100k, 15.4% for AGIs over 100k)
Earned income credit: $1,487 (reported on 11.8% of returns)
Here:
$1,487
State:
$1,757
Percentage of individuals using paid preparers for their 2004 taxes: 61.7%
Here:
62%
State:
67%
(% for various income ranges: 48.4% for AGIs below $10k, 59.9% for AGIs $10k-25k, 65.9% for AGIs $25k-50k, 68.3% for AGIs $50k-75k, 66.4% for AGIs $75k-100k, 77.1% for AGIs over 100k)
Likely homosexual households (counted as self-reported same-sex unmarried-partner households)
Lesbian couples: 0.5% of all households
Gay men: 0.0% of all households
Household received Food Stamps/SNAP in the past 12 months: 564 Household did not receive Food Stamps/SNAP in the past 12 months: 4,654
Women who had a birth in the past 12 months: 56 (55 now married, 0 unmarried) Women who did not have a birth in the past 12 months: 2,971 (843 now married, 2,140 unmarried)
Housing units in zip code 14063 with a mortgage: 2,033 (245 second mortgage, 208 both second mortgage and home equity loan) Houses without a mortgage: 131
Median monthly owner costs for units with a mortgage: $1,417 Median monthly owner costs for units without a mortgage: $618
Residents with income below the poverty level in 2022:
This zip code:
21.0%
Whole state:
14.3%
Residents with income below 50% of the poverty level in 2022:
This zip code:
8.6%
Whole state:
6.8%
Median number of rooms in houses and condos:
Here:
7.1
State:
6.3
Median number of rooms in apartments:
Here:
4.1
State:
3.8
Notable locations in this zip code not listed on our city pages
Notable locations in zip code 14063: University Stadium (A), Hillview Golf Course (B), Nortons Switch (C), Chicken Tavern Corners (D), Woodbury Fruit Farms (E), Darwin R Barker Library (F), Fredonia City Hall (G), Fredonia Opera House (H), Saint Anthony's Hall (I), Fenner House (J), Alumni House And Conference Center (K), Thompson Hall (L), Fenton Hall (M), Houghton Hall (N), Daniel A Reed Library (O), Maytum Hall (P), Michael C Rockefeller Arts Center (Q), King Concert Hall (R), Juliet J Rosch Recital Hall (S), Mason Hall (T). Display/hide their locations on the map
Churches in zip code 14063 include: Family Church of Chautauqua County (A), First Presbyterian Church (B), Fredonia Assembly of God (C), Unitarian Universalist Church (D), Harvest Chapel Free United Methodist Church (E), Lake Shore Community Chapel (F), Laona United Methodist Church (G), Saint Joseph's Roman Catholic Mission (H), Saint Anthony's Roman Catholic Church (I). Display/hide their locations on the map
Cemeteries: Saint Anthony Cemetery (1), Saint Josephs Cemetery (2), Webster Road Cemetery (3), Laona Cemetery (4), West Main Street Cemetery (5), Forest Hill Cemetery (6). Display/hide their locations on the map
1,109 married couples with children.
441 single-parent households (52 men, 389 women).
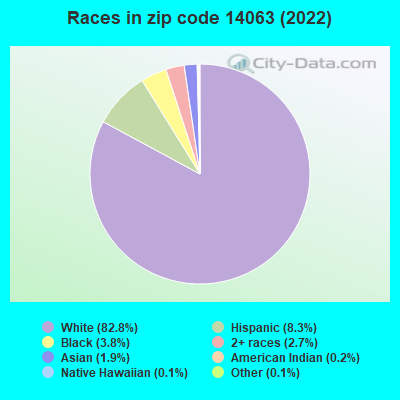
92.3% of residents of 14063 zip code speak English at home.
4.4% of residents speak Spanish at home (66% very well, 20% well, 12% not well, 1% not at all).
1.7% of residents speak other Indo-European language at home (87% very well, 13% well).
0.9% of residents speak Asian or Pacific Island language at home (70% very well, 20% well, 10% not well).
0.8% of residents speak other language at home (8% very well, 92% well).
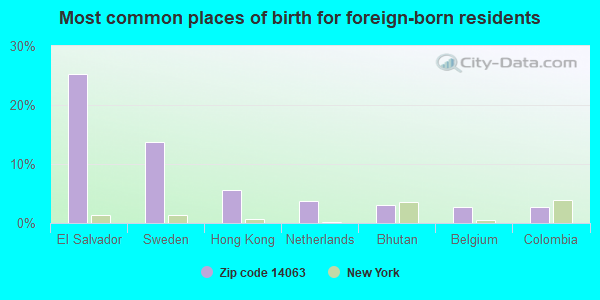
Foreign born population: 595 (4.6%) (33.5% of them are naturalized citizens)
This zip code:
4.6%
Whole state:
22.7%
25%El Salvador
14%Sweden
6%Hong Kong
4%Netherlands
3%Bhutan
3%Belgium
3%Colombia
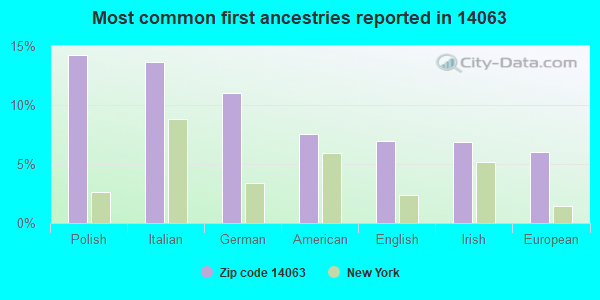
14%Polish
14%Italian
11%German
8%American
7%English
7%Irish
6%European
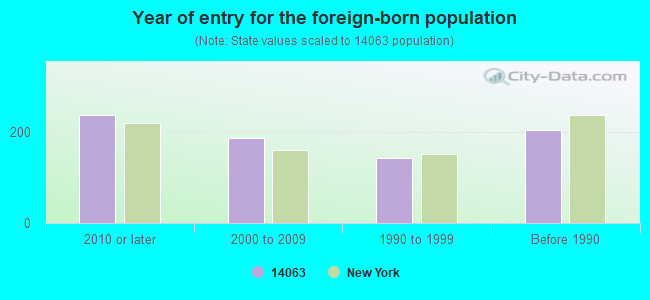
Year of entry for the foreign-born population
2372010 or later
1872000 to 2009
1431990 to 1999
205Before 1990
Facilities with environmental interests located in this zip code:
HAYWARD BODY SHOP (15 SUMMER ST in FREDONIA, NY)
STATE MASTER (New York facility tracking) - AIR PROGRAM Conditionally Exempt Small Quantity Generators, less than 100 kg/month of hazardous waste (Resource Conservation and Recovery Act (tracking hazardous waste)) - notification Organizations: JAMES M HAYWARD (CONTACT/OWNER)
BERRY ROAD WATER DISTRICT (9 DAY ST in FREDONIA, NY)
(Integrated Compliance Information System) - ICIS-02-2000-8117, FORMAL ENFORCEMENT ACTION Business SIC classification: WATER SUPPLY Alternative names: LILY DALE SD WWTF, VAN BUREN BAY WATER DISTRICT
HILLS TRUCKING INC (RTE 60 in FREDONIA, NY)
TRANSPORTER (Resource Conservation and Recovery Act (tracking hazardous waste)) - notification Organizations: NORMAN SILLS (CONTACT/OWNER)
INDUSTRIAL VACUUM SERVICES INC (377 CHESTNUT ST in FREDONIA, NY)
TRANSPORTER (Resource Conservation and Recovery Act (tracking hazardous waste)) - notification Organizations: PANTANO DENNIS PANTANO MORACE (CONTACT/OWNER)
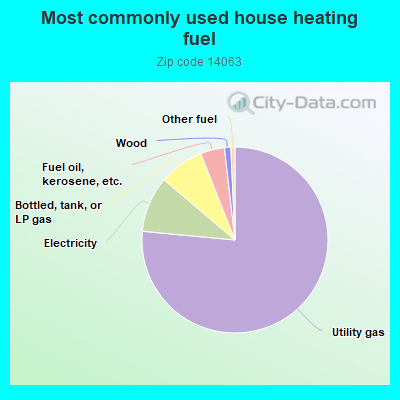
Housing units lacking complete plumbing facilities: 1.2% Housing units lacking complete kitchen facilities: 3.2%
76.5%Utility gas
9.7%Electricity
7.8%Bottled, tank, or LP gas
4.2%Fuel oil, kerosene, etc.
1.1%Wood
0.7%Other fuel
Population in 1990: 10,738. Population change in the 1990s: +3,952 (+36.8%).
Place of birth for U.S.-born residents:
This state: 9,986
Northeast: 834
Midwest: 547
South: 516
West: 243
49% of the 14063 zip code residents lived in the same house 5 years ago. Out of people who lived in different houses, 46% lived in this county. Out of people who lived in different counties, 50% lived in New York.
92% of the 14063 zip code residents lived in the same house 1 year ago. Out of people who lived in different houses, 76% moved from this county. Out of people who lived in different houses, 16% moved from different county within same state. Out of people who lived in different houses, 4% moved from different state.
Private vs. public school enrollment:
Students in private schools in grades 1 to 8 (elementary and middle school): 108
Here:
13.5%
New York:
15.6%
Students in private schools in grades 9 to 12 (high school): 14
Here:
4.2%
New York:
15.0%
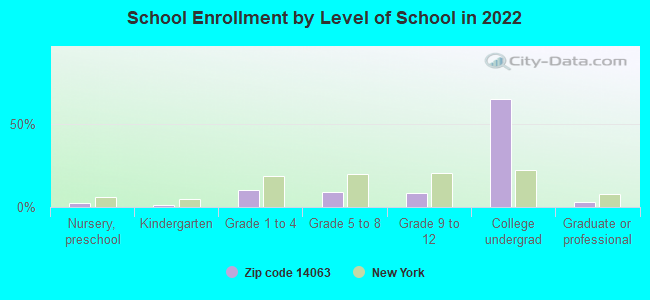
Students in private undergraduate colleges: 134
Here:
5.2%
New York:
39.2%
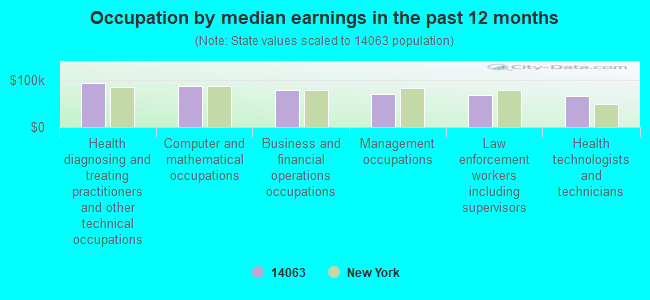
Occupation by median earnings in the past 12 months ($)
92,883Health diagnosing and treating practitioners and other technical occupations
86,432Computer and mathematical occupations
77,479Business and financial operations occupations
69,284Management occupations
68,167Law enforcement workers including supervisors
64,386Health technologists and technicians
Top industries in this zip code by the number of employees in 2005:
Other Services (except Public Administration): Civic and Social Organizations (250-499 employees: 1 establishment, 50-99 employees: 1 establishment, 10-19 employees: 1 establishment, 5-9 employees: 1 establishment, 1-4 employees: 2 establishments)
Administrative and Support and Waste Management and Remediation Services: Temporary Help Services (250-499: 1, 5-9: 1)
2002 - 2018 National Fire Incident Reporting System (NFIRS) incidents
Based on the data from the years 2002 - 2018 the average number of fire incidents per year is 36. The highest number of fire incidents - 78 took place in 2002, and the least - 6 in 2003. The data has a declining trend.
When looking into fire subcategories, the most incidents belonged to: Structure Fires (47.3%), and Outside Fires (30.3%).
Fire incident types reported to NFIRS in Zip Code 14063


 Nearest zip codes: 14752, 14718, 14048, 14784, 14716, 14135.


 Based on the data from the years 2002 - 2018 the average number of fire incidents per year is 36. The highest number of fire incidents - 78 took place in 2002, and the least - 6 in 2003. The data has a declining trend.
 When looking into fire subcategories, the most incidents belonged to: Structure Fires (47.3%), and Outside Fires (30.3%).