Estimated zip code population in 2022: 49,503 Zip code population in 2010: 50,666 Zip code population in 2000: 51,376
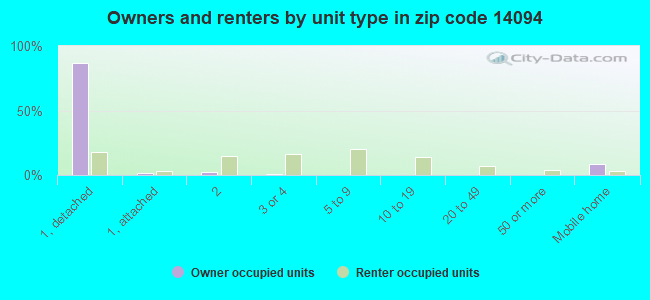
Houses and condos: 23,421 Renter-occupied apartments: 6,216
% of renters here:
28%
State:
46%
March 2022 cost of living index in zip code 14094: 100.2 (near average, U.S. average is 100)
Land area: 121.9 sq. mi. Water area: 0.2 sq. mi.
Population density: 406 people per square mile
(low).
OSM Map
General Map
Google Map
MSN Map
OSM Map
General Map
Google Map
MSN Map
OSM Map
General Map
Google Map
MSN Map
OSM Map
General Map
Google Map
MSN Map
Please wait while loading the map...
Real estate property taxes paid for housing units in 2022:
This zip code:
2.5% ($4,370)
New York:
1.5% ($6,180)
Median real estate property taxes paid for housing units with mortgages in 2022: $4,682 (2.5%) Median real estate property taxes paid for housing units with no mortgage in 2022: $3,885 (2.5%)
Averages for the 2020 tax year for zip code 14094, filed in 2021:
Average Adjusted Gross Income (AGI) in 2020: $58,911 (Individual Income Tax Returns)
Here:
$58,911
State:
$90,930
Salary/wage: $50,457 (reported on 81.7% of returns)
Here:
$50,457
State:
$72,104
(% of AGI for various income ranges: 1056.6% for AGIs below $25k, 3336.9% for AGIs $25k-50k, 6039.3% for AGIs $50k-75k, 8548.8% for AGIs $75k-100k, 16222.7% for AGIs $100k-200k, 56900.5% for AGIs over 200k)
Taxable interest for individuals: $837 (reported on 34.6% of returns)
This zip code:
$837
New York:
$3,075
(% of AGI for various income ranges: 9.1% for AGIs below $25k, 13.0% for AGIs $25k-50k, 29.2% for AGIs $50k-75k, 57.3% for AGIs $75k-100k, 77.0% for AGIs $100k-200k, 1226.7% for AGIs over 200k)
Ordinary dividends: $3,166 (reported on 18.8% of returns)
Here:
$3,166
State:
$11,095
(% of AGI for various income ranges: 18.2% for AGIs below $25k, 24.2% for AGIs $25k-50k, 65.1% for AGIs $50k-75k, 102.2% for AGIs $75k-100k, 192.4% for AGIs $100k-200k, 2331.0% for AGIs over 200k)
Net capital gain/loss in AGI: +$7,378 (reported on 14.8% of returns)
Here:
+$7,378
State:
+$44,925
(% of AGI for various income ranges: 5.5% for AGIs below $25k, 20.8% for AGIs $25k-50k, 71.0% for AGIs $50k-75k, 127.3% for AGIs $75k-100k, 380.5% for AGIs $100k-200k, 6593.3% for AGIs over 200k)
Profit/loss from business: +$12,639 (reported on 9.7% of returns)
Here:
+$12,639
State:
+$14,940
(% of AGI for various income ranges: 47.6% for AGIs below $25k, 63.4% for AGIs $25k-50k, 130.1% for AGIs $50k-75k, 163.5% for AGIs $75k-100k, 315.5% for AGIs $100k-200k, 5456.7% for AGIs over 200k)
Taxable individual retirement arrangement distribution: $14,879 (reported on 10.2% of returns)
14094:
$14,879
New York:
$19,609
(% of AGI for various income ranges: 56.6% for AGIs below $25k, 89.8% for AGIs $25k-50k, 218.0% for AGIs $50k-75k, 323.8% for AGIs $75k-100k, 530.1% for AGIs $100k-200k, 3110.0% for AGIs over 200k)
Self-employed (Keogh) retirement plans: $23,983 (reported on 0.2% of returns)
14094:
$23,983
New York:
$32,497
(% of AGI for various income ranges: 3.0% for AGIs $25k-50k, 13.8% for AGIs $100k-200k, 461.9% for AGIs over 200k)
Total itemized deductions: $28,380 (reported on 3.9% of returns)
Here:
$28,380
State:
$39,326
(% of AGI for various income ranges: 25.1% for AGIs below $25k, 59.2% for AGIs $25k-50k, 143.8% for AGIs $50k-75k, 259.2% for AGIs $75k-100k, 364.6% for AGIs $100k-200k, 3223.3% for AGIs over 200k)
Charity contributions: $8,779 (reported on 2.9% of returns)
Here:
$8,779
State:
$15,420
(% of AGI for various income ranges: 1.2% for AGIs below $25k, 5.7% for AGIs $25k-50k, 18.0% for AGIs $50k-75k, 47.7% for AGIs $75k-100k, 93.0% for AGIs $100k-200k, 1301.4% for AGIs over 200k)
Taxes paid: $8,063 (reported on 3.9% of returns)
14094:
$8,063
State:
$9,183
(% of AGI for various income ranges: 3.9% for AGIs below $25k, 14.9% for AGIs $25k-50k, 55.9% for AGIs $50k-75k, 88.3% for AGIs $75k-100k, 120.0% for AGIs $100k-200k, 546.7% for AGIs over 200k)
Earned income credit: $2,026 (reported on 13.2% of returns)
Here:
$2,026
State:
$2,138
(% of AGI for various income ranges: 65.9% for AGIs below $25k, 53.2% for AGIs $25k-50k, 1.0% for AGIs $50k-75k)
Percentage of individuals using paid preparers for their 2020 taxes: 96.5%
Here:
96%
State:
95%
(% for various income ranges: 95.5% for AGIs below $25k, 96.6% for AGIs $25k-50k, 96.9% for AGIs $50k-75k, 96.6% for AGIs $75k-100k, 97.4% for AGIs $100k-200k, 98.4% for AGIs over 200k)
Averages for the 2012 tax year for zip code 14094, filed in 2013:
Average Adjusted Gross Income (AGI) in 2012: $49,823 (Individual Income Tax Returns)
Here:
$49,823
State:
$77,088
Salary/wage: $41,202 (reported on 86.5% of returns)
Here:
$41,202
State:
$60,593
(% of AGI for various income ranges: 71.9% for AGIs below $25k, 75.2% for AGIs $25k-50k, 75.3% for AGIs $50k-75k, 75.5% for AGIs $75k-100k, 77.5% for AGIs $100k-200k, 41.2% for AGIs over 200k)
Taxable interest for individuals: $652 (reported on 47.4% of returns)
This zip code:
$652
New York:
$3,125
(% of AGI for various income ranges: 0.9% for AGIs below $25k, 0.6% for AGIs $25k-50k, 0.5% for AGIs $50k-75k, 0.5% for AGIs $75k-100k, 0.6% for AGIs $100k-200k, 0.9% for AGIs over 200k)
Ordinary dividends: $2,496 (reported on 21.7% of returns)
Here:
$2,496
State:
$10,299
(% of AGI for various income ranges: 1.1% for AGIs below $25k, 0.8% for AGIs $25k-50k, 0.9% for AGIs $50k-75k, 0.8% for AGIs $75k-100k, 0.8% for AGIs $100k-200k, 2.8% for AGIs over 200k)
Net capital gain/loss in AGI: +$5,221 (reported on 13.6% of returns)
Here:
+$5,221
State:
+$42,474
(% of AGI for various income ranges: 0.2% for AGIs $25k-50k, 0.3% for AGIs $50k-75k, 0.5% for AGIs $75k-100k, 1.0% for AGIs $100k-200k, 8.4% for AGIs over 200k)
Profit/loss from business: +$12,721 (reported on 9.2% of returns)
Here:
+$12,721
State:
+$16,168
(% of AGI for various income ranges: 2.8% for AGIs below $25k, 1.5% for AGIs $25k-50k, 1.3% for AGIs $50k-75k, 1.7% for AGIs $75k-100k, 2.5% for AGIs $100k-200k, 5.4% for AGIs over 200k)
Taxable individual retirement arrangement distribution: $11,632 (reported on 10.4% of returns)
14094:
$11,632
New York:
$17,621
(% of AGI for various income ranges: 2.6% for AGIs below $25k, 2.2% for AGIs $25k-50k, 2.4% for AGIs $50k-75k, 2.2% for AGIs $75k-100k, 2.2% for AGIs $100k-200k, 3.4% for AGIs over 200k)
Self-employment retirement plans: $15,267 (reported on 0.4% of returns)
14094:
$15,267
New York:
$27,330
(% of AGI for various income ranges: 0.1% for AGIs $50k-75k, 0.1% for AGIs $100k-200k, 0.5% for AGIs over 200k)
Total itemized deductions: $19,464 (20% of AGI, reported on 28.3% of returns)
Here:
$19,464
State:
$34,985
Here:
19.6% of AGI
State:
21.3% of AGI
(% of AGI for various income ranges: 5.1% for AGIs below $25k, 7.3% for AGIs $25k-50k, 10.6% for AGIs $50k-75k, 12.3% for AGIs $75k-100k, 14.7% for AGIs $100k-200k, 12.7% for AGIs over 200k)
Charity contributions: $2,564 (reported on 23.6% of returns)
Here:
$2,564
State:
$5,572
(% of AGI for various income ranges: 0.4% for AGIs below $25k, 0.7% for AGIs $25k-50k, 1.1% for AGIs $50k-75k, 1.4% for AGIs $75k-100k, 1.7% for AGIs $100k-200k, 1.5% for AGIs over 200k)
Taxes paid: $9,999 (reported on 28.2% of returns)
14094:
$9,999
State:
$18,656
(% of AGI for various income ranges: 1.6% for AGIs below $25k, 2.8% for AGIs $25k-50k, 4.8% for AGIs $50k-75k, 6.2% for AGIs $75k-100k, 8.3% for AGIs $100k-200k, 8.1% for AGIs over 200k)
Earned income credit: $1,984 (reported on 15.4% of returns)
Here:
$1,984
State:
$2,230
(% of AGI for various income ranges: 4.7% for AGIs below $25k, 0.9% for AGIs $25k-50k)
Percentage of individuals using paid preparers for their 2012 taxes: 62.4%
Here:
62%
State:
66%
(% for various income ranges: 57.4% for AGIs below $25k, 62.5% for AGIs $25k-50k, 66.0% for AGIs $50k-75k, 66.8% for AGIs $75k-100k, 69.6% for AGIs $100k-200k, 83.9% for AGIs over 200k)
Averages for the 2004 tax year for zip code 14094, filed in 2005:
Average Adjusted Gross Income (AGI) in 2004: $41,218 (Individual Income Tax Returns)
Here:
$41,218
State:
$59,519
Salary/wage: $36,459 (reported on 87.4% of returns)
Here:
$36,459
State:
$50,673
(% of AGI for various income ranges: 95.3% for AGIs below $10k, 70.8% for AGIs $10k-25k, 76.0% for AGIs $25k-50k, 82.3% for AGIs $50k-75k, 84.5% for AGIs $75k-100k, 70.5% for AGIs over 100k)
Taxable interest for individuals: $884 (reported on 59.2% of returns)
This zip code:
$884
New York:
$2,377
(% of AGI for various income ranges: 4.2% for AGIs below $10k, 2.0% for AGIs $10k-25k, 1.2% for AGIs $25k-50k, 0.9% for AGIs $50k-75k, 0.8% for AGIs $75k-100k, 1.4% for AGIs over 100k)
Taxable dividends: $1,396 (reported on 28.8% of returns)
Here:
$1,396
State:
$5,394
(% of AGI for various income ranges: 2.5% for AGIs below $10k, 1.4% for AGIs $10k-25k, 0.9% for AGIs $25k-50k, 0.7% for AGIs $50k-75k, 0.7% for AGIs $75k-100k, 1.2% for AGIs over 100k)
Net capital gain/loss: +$2,560 (reported on 18.7% of returns)
Here:
+$2,560
State:
+$23,581
(% of AGI for various income ranges: -0.6% for AGIs below $10k, 0.3% for AGIs $10k-25k, 0.4% for AGIs $25k-50k, 0.6% for AGIs $50k-75k, 0.8% for AGIs $75k-100k, 3.0% for AGIs over 100k)
Profit/loss from business: +$10,072 (reported on 10.0% of returns)
Here:
+$10,072
State:
+$13,809
(% of AGI for various income ranges: 2.0% for AGIs below $10k, 2.1% for AGIs $10k-25k, 1.4% for AGIs $25k-50k, 1.1% for AGIs $50k-75k, 1.2% for AGIs $75k-100k, 5.5% for AGIs over 100k)
IRA payment deduction: $2,563 (reported on 2.5% of returns)
14094:
$2,563
New York:
$3,115
(% of AGI for various income ranges: 0.2% for AGIs below $10k, 0.2% for AGIs $10k-25k, 0.3% for AGIs $25k-50k, 0.2% for AGIs $50k-75k, 0.1% for AGIs $75k-100k, 0.1% for AGIs over 100k)
Self-employed pension: $16,353 (reported on 0.4% of returns)
Here:
$16,353
New York:
$19,016
(% of AGI for various income ranges: 0.0% for AGIs $25k-50k, 0.0% for AGIs $50k-75k, 0.1% for AGIs $75k-100k, 0.6% for AGIs over 100k)
Total itemized deductions: $16,341 (21% of AGI, reported on 32.6% of returns)
Here:
$16,341
State:
$25,864
Here:
21.1% of AGI
State:
21.9% of AGI
(% of AGI for various income ranges: 7.0% for AGIs below $10k, 6.6% for AGIs $10k-25k, 9.9% for AGIs $25k-50k, 13.6% for AGIs $50k-75k, 16.2% for AGIs $75k-100k, 15.5% for AGIs over 100k)
Charity contributions deductions: $2,295 (3% of AGI, reported on 30.4% of returns)
Here:
$2,295
State:
$4,439
Here:
2.9% of AGI
State:
3.6% of AGI
(% of AGI for various income ranges: 0.5% for AGIs below $10k, 0.7% for AGIs $10k-25k, 1.2% for AGIs $25k-50k, 1.7% for AGIs $50k-75k, 2.1% for AGIs $75k-100k, 2.3% for AGIs over 100k)
Total tax: $5,326 (reported on 76.5% of returns)
14094:
$5,326
State:
$11,730
(% of AGI for various income ranges: 2.1% for AGIs below $10k, 3.9% for AGIs $10k-25k, 6.8% for AGIs $25k-50k, 8.4% for AGIs $50k-75k, 10.1% for AGIs $75k-100k, 16.5% for AGIs over 100k)
Earned income credit: $1,600 (reported on 13.2% of returns)
Here:
$1,600
State:
$1,757
Percentage of individuals using paid preparers for their 2004 taxes: 66.6%
Here:
67%
State:
67%
(% for various income ranges: 58.3% for AGIs below $10k, 67.1% for AGIs $10k-25k, 67.9% for AGIs $25k-50k, 69.6% for AGIs $50k-75k, 70.7% for AGIs $75k-100k, 73.4% for AGIs over 100k)
Likely homosexual households (counted as self-reported same-sex unmarried-partner households)
Lesbian couples: 0.1% of all households
Gay men: 0.1% of all households
Household received Food Stamps/SNAP in the past 12 months: 3,171 Household did not receive Food Stamps/SNAP in the past 12 months: 18,688
Women who had a birth in the past 12 months: 490 (289 now married, 204 unmarried) Women who did not have a birth in the past 12 months: 10,091 (4,178 now married, 5,888 unmarried)
Housing units in zip code 14094 with a mortgage: 8,722 (1,361 second mortgage, 21 home equity loan, 1,290 both second mortgage and home equity loan) Houses without a mortgage: 540
Median monthly owner costs for units with a mortgage: $1,496 Median monthly owner costs for units without a mortgage: $669
Residents with income below the poverty level in 2022:
This zip code:
11.2%
Whole state:
14.3%
Residents with income below 50% of the poverty level in 2022:
This zip code:
4.6%
Whole state:
6.8%
Median number of rooms in houses and condos:
Here:
6.6
State:
6.3
Median number of rooms in apartments:
Here:
4.4
State:
3.8
Notable locations in this zip code not listed on our city pages
Notable locations in zip code 14094: Transit Drive-In (A), Niagara County Fairgrounds (B), Lockport Plaza (C), Willowbrook Golf Course (D), Oak Run Golf Club (E), Niagara County Golf Course (F), Lockport Town and Country Club (G), Niagara County Camping Resort (H), Boka Farms (I), Byes Strawberry Ranch (J), Cambria Wine Cellars (K), Fruit Ridge Farm (L), Mrowka Farm (M), Pipiles Farm (N), Pyskaty Farms (O), Sunnyside Farms (P), Zona Farm (Q), Lockport City Wastewater Treatment Plant (R), Camp Windy Meadows (S), Blackman Homestead Farm (T). Display/hide their locations on the map
Churches in zip code 14094 include: Saint Bridgets Church (A), Chapel of the Good Shepherd (B), Christ Church (C), Saint Patricks Church (D), Saint Peters Church (E), Mount Oliver Church (F), Assembly of God Church (G), Cambria United Church of Christ (H), Christian Faith Chapel (I). Display/hide their locations on the map
Cemeteries: Saint Patricks Cemetery (1), Saint Peters Cemetery (2), Queen of Heaven Cemetery (3), Shaeffer Cemetery (4), Smiths Cemetery (5), Glenwood Cemetery (6), Stahler Cemetery (7). Display/hide their locations on the map
Parks in zip code 14094 include: Sandhurst Park (1), Outwater Memorial Park (2), Dolan Park (3), DeSales Athletic Field (4), Altro Park (5), Veterans Park (6). Display/hide their locations on the map
5,202 married couples with children.
3,625 single-parent households (1,195 men, 2,430 women).
95.8% of residents of 14094 zip code speak English at home.
1.1% of residents speak Spanish at home (29% very well, 32% well, 35% not well, 4% not at all).
1.9% of residents speak other Indo-European language at home (64% very well, 19% well, 17% not well).
0.7% of residents speak Asian or Pacific Island language at home (85% very well, 7% well, 8% not well).
0.5% of residents speak other language at home (34% very well, 17% well, 49% not well).
Foreign born population: 1,503 (3.0%) (56.7% of them are naturalized citizens)
Major facilities with environmental interests located in this zip code:
J H PRODUCTS INC (520 MILL ST. in LOCKPORT, NY)
AIR MINOR (AIRS/AFS) STATE MASTER (New York facility tracking) - AIR PROGRAM, COMPLIANCE ACTIVITY (Tracking inspections of insecticide, fungicide, and rodenticide, and toxic substances) TRANSPORTER (Resource Conservation and Recovery Act (tracking hazardous waste)) TRI REPORTER (Tracking of toxic chemicals releasing facilities) Business SIC classification: INDUSTRIAL INORGANIC CHEMICALS; INDUSTRIAL ORGANIC CHEMICALS; NONCLASSIFIABLE ESTABLISHMENTS Organizations: TWIN LAKE CHEMICAL INC (LEGALLY RESPONSIBLE PARTY)
Alternative names: TWIN LAKE CHEMICAL INC
ALLEGHENY LUDLUM SPECIAL MATERIALS (695 OHIO STREET in LOCKPORT, NY)
AIR SYNTHETIC MINOR (AIRS/AFS) SUPERFUND (Superfund database) STATE MASTER (New York facility tracking) - AIR PROGRAM, HAZARDOUS WASTE PROGRAM (Integrated Compliance Information System) - ICIS-02-1996-0058, FORMAL ENFORCEMENT ACTION, ICIS-02-2000-0003, CRITERIA AND HAZARDOUS AIR POLLUTANT INVENTORY (Inventory of air pollution sources) HAZARDOUS WASTE BIENNIAL REPORTER (Resource Conservation and Recovery Act (tracking hazardous waste)) Large Quantity Generators, more that 1000 kg of hazardous waste/month (Resource Conservation and Recovery Act (tracking hazardous waste)) - notification TRI REPORTER (Tracking of toxic chemicals releasing facilities) Business SIC classification: STEEL WORKS, BLAST FURNACES (INCLUDING COKE OVENS), AND ROLLING MILLS Business NAICS classification: IRON AND STEEL MILLS.; STEEL FOUNDRIES (EXCEPT INVESTMENT). Organizations: OWNERNAME (CONTACT/OWNER)
, ALLEGHENY LUDLUM CORP (LEGALLY RESPONSIBLE PARTY)
Alternative names: ALLEGHENY LUDLUM CORPORATION SPECIAL MATERIALS DIVISION, ALLEGHENY LUDLUM - LOCKPORT PLANT, ALLVAC - ATTN: KYLE DUNN, ALLVAC LOCKPORT PLANT, GUTERL SIMMONS-STEEL, GUTERL SPECIALTY STEEL CORP., SPECIAL MATERIALS DIV ALLEGHENY LUDLUM
GI RO CLEANERS (6111 SOUTH TRANSIT ROAD in LOCKPORT, NY)
AIR MINOR (AIRS/AFS) STATE MASTER (New York facility tracking) - AIR PROGRAM, HAZARDOUS WASTE PROGRAM Small Quantity Generators, between 100 kg and 1000 kg of hazardous waste/month (Resource Conservation and Recovery Act (tracking hazardous waste)) - notification Business SIC classification: DRYCLEANING PLANTS, EXCEPT RUG CLEANING Business NAICS classification: DRYCLEANING AND LAUNDRY SERVICES (EXCEPT COIN-OPERATED). Organizations: DAVID GIANSANTE (CONTACT/OWNER)
, GI RO DRY CLEANERS INC (LEGALLY RESPONSIBLE PARTY)
IMAGE COLLISION LTD (245 PARK AVENUE in LOCKPORT, NY)
AIR MINOR (AIRS/AFS) STATE MASTER (New York facility tracking) - AIR PROGRAM Conditionally Exempt Small Quantity Generators, less than 100 kg/month of hazardous waste (Resource Conservation and Recovery Act (tracking hazardous waste)) - notification Organizations: EDWARD A ROBERTS (CONTACT/OWNER)
INDUSTRIAL ASSEMBLY & MFG INC (205 GREEN ST in LOCKPORT, NY)
STATE MASTER (New York facility tracking) - AIR PROGRAM, (Resource Conservation and Recovery Act (tracking hazardous waste))
ANNA MERRITT ES (389 GREEN ST in LOCKPORT, NY)
(National Center for Education Statistics) - STATE ID-400400010001 Organizations: LOCKPORT CITY SD (SCHOOL DISTRICT)
GEORGE SOUTHARD ES ( in LOCKPORT, NY)
(National Center for Education Statistics) - STATE ID-400400010005 Organizations: LOCKPORT CITY SD (SCHOOL DISTRICT)
HOUSELS SERVICE STATION INC (290 WEST AVE in LOCKPORT, NY)
Large Quantity Generators, more that 1000 kg of hazardous waste/month (Resource Conservation and Recovery Act (tracking hazardous waste)) USED OIL PROGRAM (Resource Conservation and Recovery Act (tracking hazardous waste)) Organizations: DAVID C HOUSEL (CONTACT/OPERATOR)
CLEAN HARBORS ENVIRON SERVICES (100 DAVISON RD - SWITZER BLDG in LOCKPORT, NY)
Large Quantity Generators, more that 1000 kg of hazardous waste/month (Resource Conservation and Recovery Act (tracking hazardous waste)) Organizations: NIAGARA COUNTY (CONTACT/OWNER)
GREAT LAKES CONTAINERIZATION (85 GRAND ST in LOCKPORT, NY)
CRITERIA AND HAZARDOUS AIR POLLUTANT INVENTORY (Inventory of air pollution sources) (Resource Conservation and Recovery Act (tracking hazardous waste)) Alternative names: GREAT LAKES CONTAINER CORP. LOCKPO, GREAT LAKES CONTAINER CORPORATION LOCKPORT
GREATER LOCKPORT DEVEL CORP (49 RICHMOND AVE in LOCKPORT, NY)
Large Quantity Generators, more that 1000 kg of hazardous waste/month (Resource Conservation and Recovery Act (tracking hazardous waste)) - notification
HARBISON BROS INC (120 S NIAGARA ST in LOCKPORT, NY)
ACACIA PARK CEMETERY (4215 N TONAWANDA CREEK RD in PENDLETON, NY)
(Resource Conservation and Recovery Act (tracking hazardous waste))
Housing units lacking complete plumbing facilities: 1.4% Housing units lacking complete kitchen facilities: 2.1%
71.2%Utility gas
16.0%Electricity
5.3%Bottled, tank, or LP gas
5.1%Fuel oil, kerosene, etc.
0.9%Wood
0.9%Other fuel
0.5%No fuel used
Population in 1990: 48,398. Population change in the 1990s: +2,978 (+6.2%).
Place of birth for U.S.-born residents:
This state: 42,015
Northeast: 1,600
Midwest: 1,149
South: 1,860
West: 881
63% of the 14094 zip code residents lived in the same house 5 years ago. Out of people who lived in different houses, 73% lived in this county. Out of people who lived in different counties, 50% lived in New York.
92% of the 14094 zip code residents lived in the same house 1 year ago. Out of people who lived in different houses, 57% moved from this county. Out of people who lived in different houses, 26% moved from different county within same state. Out of people who lived in different houses, 16% moved from different state. Out of people who lived in different houses, 1% moved from abroad.
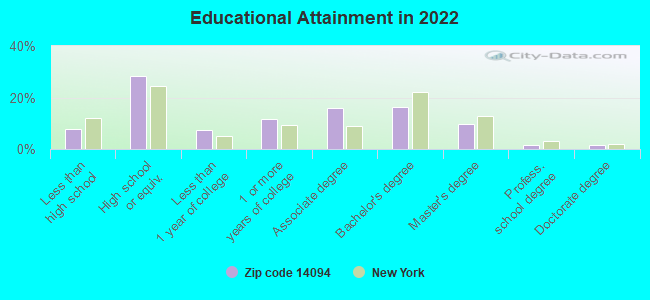
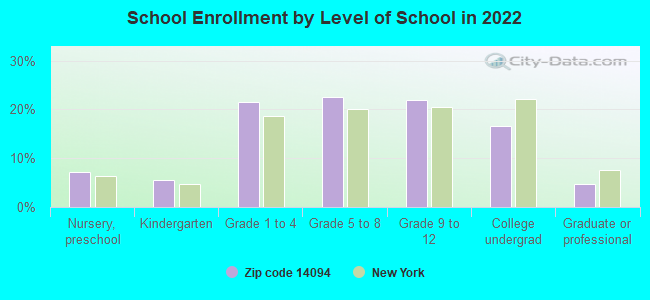
Private vs. public school enrollment:
Students in private schools in grades 1 to 8 (elementary and middle school): 615
Here:
13.8%
New York:
15.6%
Students in private schools in grades 9 to 12 (high school): 204
Here:
9.2%
New York:
15.0%
Students in private undergraduate colleges: 367
Here:
22.2%
New York:
39.2%
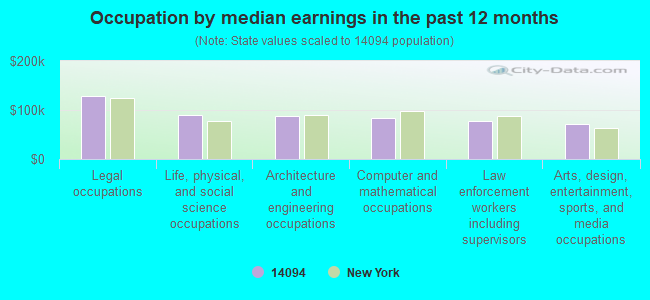
Occupation by median earnings in the past 12 months ($)
127,834Legal occupations
89,586Life, physical, and social science occupations
88,673Architecture and engineering occupations
83,602Computer and mathematical occupations
76,867Law enforcement workers including supervisors
71,723Arts, design, entertainment, sports, and media occupations
Companies with biggest federal contracts located in this zip code (LOCKPORT, NY):
FREDWAL INC (160 WASHBURN ST; small business) 250 employees, $0 revenue. : $1,031,396 in 8 contractsfrom 2004 to 2006
Contracts for Radar Equipment, Except Airborne, Radio Navigation Equipment, Airborne, Maintenance, Repair and Rebuilding of Equipment -- Communication, Detection, and Coherent Radiation Equipment by Navy, Army Signed by year:2000: $0; 2001: $0; 2002: $0; 2003: $0; 2004: $452,000; 2005: $585,808; 2006: -$6,412.
Biggest contracts:
$553,608 with Navy for Radar Equipment, Except Airborne. Signed on 2005-07-08. Completion date: 2005-10-31.
$250,481 with Army for Radio Navigation Equipment, Airborne. Signed on 2004-03-31. Completion date: 2004-08-31.
$189,000, same as above.Signed on 2004-11-04. Completion date: 2004-08-31.
$28,000, same as above.Signed on 2005-04-29. Completion date: 2004-08-31.
MESCH ENGINEERING & ARCHITECTU (450 BEWLEY BLDG; small business) : $291,832 in 21 contractsfrom 1999 to 2002
Contracts for Utilities, Other Buildings, Administrative and Service Buildings, Airfield, Communication and Missile Facilities, and moreby Air Force Signed by year:2000: $13,252; 2001: $289,302; 2002: -$113,773; 2003: $0; 2004: $0; 2005: $0; 2006: $0.
Biggest contracts:
$183,298 with Air Force for Utilities. Signed on 2001-08-10. Completion date: 2002-06-12.
$32,914 with Air Force for Other Buildings. Signed on 2001-07-10. Completion date: 2001-11-27.
$28,823 with Air Force for Administrative and Service Buildings. Signed on 2001-08-10. Completion date: 2002-03-13.
$19,234 with Air Force for Airfield, Communication and Missile Facilities. Signed on 1999-12-13. Completion date: 2000-04-24.
FRANBILT, INC (6746 AKRON RD) : $246,450 in 5 contractsfrom 2001 to 2005
Contracts for Water Turbines and Water Wheels; and Components, Bridges, Fixed and Floating, Construction of Structures and Facilities -- Recreation Facilities (Non-Building) by U.S. Army Corps of Engineers - civil program financing only, Army Signed by year:2000: $0; 2001: $126,050; 2002: $0; 2003: $53,500; 2004: $0; 2005: $66,900; 2006: $0.
Biggest contracts:
$96,400 with U.S. Army Corps of Engineers - civil program financing only for Water Turbines and Water Wheels; and Components. Signed on 2001-12-10. Completion date: 2002-07-31.
$53,500 with Army for Bridges, Fixed and Floating. Signed on 2003-10-16. Completion date: 2004-02-28.
$33,450 with U.S. Army Corps of Engineers - civil program financing only for Construction of Structures and Facilities -- Recreation Facilities (Non-Building). Taking place in AR. Signed on 2005-06-10. Completion date: 2005-09-07.
$33,450 with Army for Construction of Structures and Facilities -- Recreation Facilities (Non-Building). Taking place in AR. Signed on 2005-06-10. Completion date: 2005-09-07.
UPPER MOUNTAIN ROAD INC (No data from D and B) 3 employees, $0 revenue: $232,000 in 5 contractsfrom 2000 to 2001
Contracts for Miscellaneous Items by Indian Affairs (Assistant Secretary) Signed by year:2000: $145,000; 2001: $87,000; 2002: $0; 2003: $0; 2004: $0; 2005: $0; 2006: $0.
Biggest contracts:
$68,000 with Indian Affairs (Assistant Secretary) for Miscellaneous Items. Signed on 2000-09-15. Completion date: 1999-12-15.
$46,000, same as above.Signed on 2001-09-15. Completion date: 2002-09-15.
$41,000, same as above.Signed on 2001-09-15. Completion date: 2002-09-15.
$41,000, same as above.Signed on 2000-09-15. Completion date: 2000-10-15.
BUFFALO MACHINE TOOLS OF NIAGA (4935 LOCKPORT RD; small business) : $224,595 in 6 contractsfrom 2000 to 2005
Contracts for Bending and Forming Machines, Miscellaneous Machine Tools, Punching and Shearing Machines, Machine Tools, Portable, and moreby Defense Logistics Agency, Navy, Air Force Signed by year:2000: $39,165; 2001: $0; 2002: $108,700; 2003: $0; 2004: $0; 2005: $76,730; 2006: $0.
Biggest contracts:
$72,050 with Defense Logistics Agency for Bending and Forming Machines. Signed on 2002-06-05. Completion date: 2002-10-23.
$56,030 with Navy for Miscellaneous Machine Tools. Taking place in FL. Signed on 2005-09-09. Completion date: 2005-12-09.
$39,165 with Defense Logistics Agency for Punching and Shearing Machines. Signed on 2000-04-06. Completion date: 2000-06-05.
$36,650 with Navy for Machine Tools, Portable. Signed on 2002-06-04. Completion date: 2002-07-31.
NIAGARA COOLER INC (6605 SLAYTON-SETTLEMENT R; small business)
$89,325 with Defense Logistics Agency for Engine Cooling System Components, Nonaircraft. Signed on 2004-10-18. Completion date: 2004-12-17.
JOHN R FREUNDSCHUH INC (6511 S TRANSIT RD; small business) : $82,791 in 6 contractsfrom 2003 to 2006
Contracts for Road Clearing, Cleaning and Marking Equipment, Truck and Tractor Attachments by Air Force, Army, U.S. Army Corps of Engineers - civil program financing only Signed by year:2000: $0; 2001: $0; 2002: $0; 2003: $35,238; 2004: $47,766; 2005: $0; 2006: -$213.
Biggest contracts:
$35,238 with Air Force for Road Clearing, Cleaning and Marking Equipment. Signed on 2003-12-09. Completion date: 2004-01-21.
$16,531 with Army for Truck and Tractor Attachments. Signed on 2004-11-04. Completion date: 2004-12-01.
$16,531 with U.S. Army Corps of Engineers - civil program financing only for Truck and Tractor Attachments. Signed on 2004-11-04. Completion date: 2004-12-01.
$7,352 with Army for Truck and Tractor Attachments. Signed on 2004-09-27. Completion date: 2004-12-30.
FLETCHER ENTERPRISES INC (4193 JOHNSON ROAD; small business)
$40,085 with Air Force for Compressors and Vacuum Pumps. Signed on 2003-08-27. Completion date: 2003-10-06.
SMITH DRAFTING PRODUCTS INC (5679 SOUTH TRANSIT ROAD; small business)
$38,760 with Department of Defense for Office Furniture. Taking place in MD. Signed on 2001-07-11. Completion date: 2001-08-20.
MC INTOSH & MC INTOSH PC (429 PINE ST; small business)
$38,572 with Air Force for Land Surveys, Cadastral Services (non-construction). Signed on 2000-09-05. Completion date: 2000-12-31.
Top industries in this zip code by the number of employees in 2005:
2002 - 2018 National Fire Incident Reporting System (NFIRS) incidents
Based on the data from the years 2002 - 2018 the average number of fire incidents per year is 134. The highest number of reported fires - 189 took place in 2003, and the least - 51 in 2002. The data has a rising trend.
When looking into fire subcategories, the most incidents belonged to: Structure Fires (45.1%), and Outside Fires (35.3%).
Fire incident types reported to NFIRS in Zip Code 14094

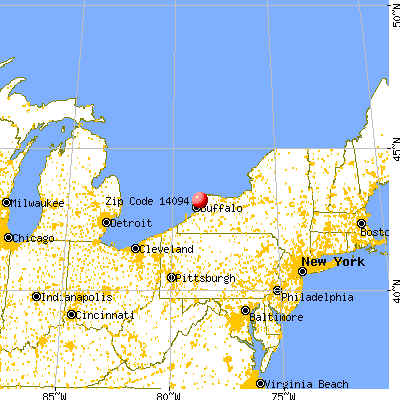


 Nearest zip codes: 14108, 14051, 14032, 14228, 14068, 14067.


 Based on the data from the years 2002 - 2018 the average number of fire incidents per year is 134. The highest number of reported fires - 189 took place in 2003, and the least - 51 in 2002. The data has a rising trend.
 When looking into fire subcategories, the most incidents belonged to: Structure Fires (45.1%), and Outside Fires (35.3%).