Estimated zip code population in 2022: 23,906 Zip code population in 2010: 25,141 Zip code population in 2000: 28,094
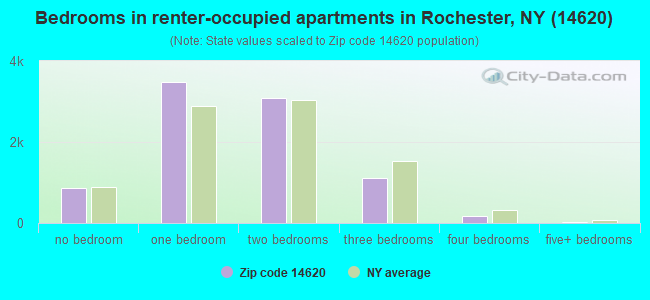
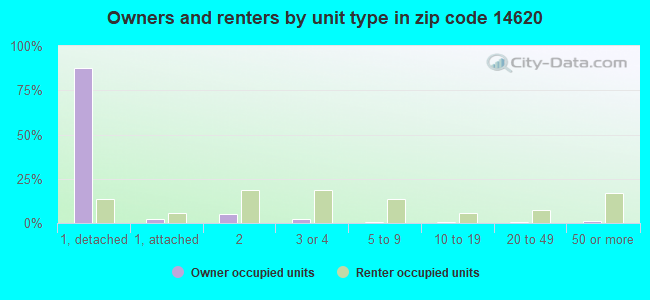
Houses and condos: 13,146 Renter-occupied apartments: 8,733
% of renters here:
70%
State:
46%
March 2022 cost of living index in zip code 14620: 103.4 (near average, U.S. average is 100)
Land area: 4.5 sq. mi. Water area: 0.1 sq. mi.
Population density: 5,338 people per square mile
(average).
OSM Map
General Map
Google Map
MSN Map
OSM Map
General Map
Google Map
MSN Map
OSM Map
General Map
Google Map
MSN Map
OSM Map
General Map
Google Map
MSN Map
Please wait while loading the map...
Real estate property taxes paid for housing units in 2022:
This zip code:
2.4% ($4,720)
New York:
1.5% ($6,180)
Median real estate property taxes paid for housing units with mortgages in 2022: $4,817 (2.4%) Median real estate property taxes paid for housing units with no mortgage in 2022: $4,651 (2.4%)
Averages for the 2020 tax year for zip code 14620, filed in 2021:
Average Adjusted Gross Income (AGI) in 2020: $54,611 (Individual Income Tax Returns)
Here:
$54,611
State:
$90,930
Salary/wage: $48,319 (reported on 84.5% of returns)
Here:
$48,319
State:
$72,104
(% of AGI for various income ranges: 1175.7% for AGIs below $25k, 3713.7% for AGIs $25k-50k, 6540.4% for AGIs $50k-75k, 10214.3% for AGIs $75k-100k, 18382.1% for AGIs $100k-200k, 77127.5% for AGIs over 200k)
Taxable interest for individuals: $1,012 (reported on 32.7% of returns)
This zip code:
$1,012
New York:
$3,075
(% of AGI for various income ranges: 12.5% for AGIs below $25k, 15.1% for AGIs $25k-50k, 36.0% for AGIs $50k-75k, 79.1% for AGIs $75k-100k, 154.1% for AGIs $100k-200k, 1362.5% for AGIs over 200k)
Ordinary dividends: $5,017 (reported on 22.4% of returns)
Here:
$5,017
State:
$11,095
(% of AGI for various income ranges: 30.6% for AGIs below $25k, 46.1% for AGIs $25k-50k, 94.9% for AGIs $50k-75k, 279.8% for AGIs $75k-100k, 695.4% for AGIs $100k-200k, 4436.2% for AGIs over 200k)
Net capital gain/loss in AGI: +$9,394 (reported on 20.3% of returns)
Here:
+$9,394
State:
+$44,925
(% of AGI for various income ranges: 12.3% for AGIs below $25k, 36.2% for AGIs $25k-50k, 69.6% for AGIs $50k-75k, 320.0% for AGIs $75k-100k, 682.0% for AGIs $100k-200k, 16351.2% for AGIs over 200k)
Profit/loss from business: +$10,965 (reported on 12.7% of returns)
Here:
+$10,965
State:
+$14,940
(% of AGI for various income ranges: 96.2% for AGIs below $25k, 96.3% for AGIs $25k-50k, 137.3% for AGIs $50k-75k, 149.6% for AGIs $75k-100k, 706.6% for AGIs $100k-200k, 4296.2% for AGIs over 200k)
Taxable individual retirement arrangement distribution: $18,892 (reported on 8.1% of returns)
14620:
$18,892
New York:
$19,609
(% of AGI for various income ranges: 49.8% for AGIs below $25k, 78.4% for AGIs $25k-50k, 150.8% for AGIs $50k-75k, 514.7% for AGIs $75k-100k, 968.2% for AGIs $100k-200k, 3726.3% for AGIs over 200k)
Self-employed (Keogh) retirement plans: $16,271 (reported on 0.6% of returns)
14620:
$16,271
New York:
$32,497
(% of AGI for various income ranges: 78.6% for AGIs $100k-200k, 873.8% for AGIs over 200k)
Total itemized deductions: $26,979 (reported on 4.7% of returns)
Here:
$26,979
State:
$39,326
(% of AGI for various income ranges: 28.7% for AGIs below $25k, 68.0% for AGIs $25k-50k, 139.8% for AGIs $50k-75k, 442.6% for AGIs $75k-100k, 701.4% for AGIs $100k-200k, 3827.5% for AGIs over 200k)
Charity contributions: $10,671 (reported on 3.7% of returns)
Here:
$10,671
State:
$15,420
(% of AGI for various income ranges: 3.2% for AGIs below $25k, 9.0% for AGIs $25k-50k, 27.7% for AGIs $50k-75k, 114.3% for AGIs $75k-100k, 238.8% for AGIs $100k-200k, 2115.0% for AGIs over 200k)
Taxes paid: $7,778 (reported on 4.6% of returns)
14620:
$7,778
State:
$9,183
(% of AGI for various income ranges: 5.7% for AGIs below $25k, 15.1% for AGIs $25k-50k, 43.5% for AGIs $50k-75k, 154.5% for AGIs $75k-100k, 223.7% for AGIs $100k-200k, 860.0% for AGIs over 200k)
Earned income credit: $1,714 (reported on 13.7% of returns)
Here:
$1,714
State:
$2,138
(% of AGI for various income ranges: 63.0% for AGIs below $25k, 35.2% for AGIs $25k-50k)
Percentage of individuals using paid preparers for their 2020 taxes: 94.8%
Here:
95%
State:
95%
(% for various income ranges: 93.8% for AGIs below $25k, 95.0% for AGIs $25k-50k, 96.3% for AGIs $50k-75k, 94.2% for AGIs $75k-100k, 95.3% for AGIs $100k-200k, 96.2% for AGIs over 200k)
Averages for the 2012 tax year for zip code 14620, filed in 2013:
Average Adjusted Gross Income (AGI) in 2012: $43,789 (Individual Income Tax Returns)
Here:
$43,789
State:
$77,088
Salary/wage: $39,248 (reported on 85.8% of returns)
Here:
$39,248
State:
$60,593
(% of AGI for various income ranges: 80.8% for AGIs below $25k, 87.4% for AGIs $25k-50k, 81.8% for AGIs $50k-75k, 73.2% for AGIs $75k-100k, 74.0% for AGIs $100k-200k, 51.8% for AGIs over 200k)
Taxable interest for individuals: $704 (reported on 36.6% of returns)
This zip code:
$704
New York:
$3,125
(% of AGI for various income ranges: 0.7% for AGIs below $25k, 0.4% for AGIs $25k-50k, 0.6% for AGIs $50k-75k, 0.8% for AGIs $75k-100k, 0.6% for AGIs $100k-200k, 0.6% for AGIs over 200k)
Ordinary dividends: $4,374 (reported on 20.6% of returns)
Here:
$4,374
State:
$10,299
(% of AGI for various income ranges: 1.7% for AGIs below $25k, 1.1% for AGIs $25k-50k, 1.3% for AGIs $50k-75k, 2.8% for AGIs $75k-100k, 2.3% for AGIs $100k-200k, 4.5% for AGIs over 200k)
Net capital gain/loss in AGI: +$7,415 (reported on 15.7% of returns)
Here:
+$7,415
State:
+$42,474
(% of AGI for various income ranges: 0.4% for AGIs $25k-50k, 0.5% for AGIs $50k-75k, 1.1% for AGIs $75k-100k, 1.4% for AGIs $100k-200k, 18.0% for AGIs over 200k)
Profit/loss from business: +$13,212 (reported on 11.4% of returns)
Here:
+$13,212
State:
+$16,168
(% of AGI for various income ranges: 5.5% for AGIs below $25k, 1.9% for AGIs $25k-50k, 1.9% for AGIs $50k-75k, 2.2% for AGIs $75k-100k, 3.1% for AGIs $100k-200k, 8.9% for AGIs over 200k)
Taxable individual retirement arrangement distribution: $12,595 (reported on 8.9% of returns)
14620:
$12,595
New York:
$17,621
(% of AGI for various income ranges: 2.3% for AGIs below $25k, 1.6% for AGIs $25k-50k, 2.8% for AGIs $50k-75k, 3.6% for AGIs $75k-100k, 3.4% for AGIs $100k-200k, 1.8% for AGIs over 200k)
Self-employment retirement plans: $14,190 (reported on 0.9% of returns)
14620:
$14,190
New York:
$27,330
(% of AGI for various income ranges: 0.2% for AGIs $25k-50k, 0.5% for AGIs $100k-200k, 1.3% for AGIs over 200k)
Total itemized deductions: $18,246 (21% of AGI, reported on 25.0% of returns)
Here:
$18,246
State:
$34,985
Here:
20.9% of AGI
State:
21.3% of AGI
(% of AGI for various income ranges: 6.1% for AGIs below $25k, 6.8% for AGIs $25k-50k, 10.3% for AGIs $50k-75k, 12.7% for AGIs $75k-100k, 14.0% for AGIs $100k-200k, 14.4% for AGIs over 200k)
Charity contributions: $3,208 (reported on 20.3% of returns)
Here:
$3,208
State:
$5,572
(% of AGI for various income ranges: 0.4% for AGIs below $25k, 0.7% for AGIs $25k-50k, 1.3% for AGIs $50k-75k, 1.7% for AGIs $75k-100k, 2.4% for AGIs $100k-200k, 2.8% for AGIs over 200k)
Taxes paid: $8,958 (reported on 24.8% of returns)
14620:
$8,958
State:
$18,656
(% of AGI for various income ranges: 1.7% for AGIs below $25k, 2.4% for AGIs $25k-50k, 4.6% for AGIs $50k-75k, 5.8% for AGIs $75k-100k, 7.8% for AGIs $100k-200k, 9.6% for AGIs over 200k)
Earned income credit: $1,739 (reported on 17.2% of returns)
Here:
$1,739
State:
$2,230
(% of AGI for various income ranges: 4.4% for AGIs below $25k, 0.6% for AGIs $25k-50k)
Percentage of individuals using paid preparers for their 2012 taxes: 41.2%
Here:
41%
State:
66%
(% for various income ranges: 37.8% for AGIs below $25k, 35.3% for AGIs $25k-50k, 46.7% for AGIs $50k-75k, 50.0% for AGIs $75k-100k, 60.0% for AGIs $100k-200k, 80.0% for AGIs over 200k)
Averages for the 2004 tax year for zip code 14620, filed in 2005:
Average Adjusted Gross Income (AGI) in 2004: $35,168 (Individual Income Tax Returns)
Here:
$35,168
State:
$59,519
Salary/wage: $33,636 (reported on 85.0% of returns)
Here:
$33,636
State:
$50,673
(% of AGI for various income ranges: 113.8% for AGIs below $10k, 83.1% for AGIs $10k-25k, 87.5% for AGIs $25k-50k, 81.9% for AGIs $50k-75k, 83.3% for AGIs $75k-100k, 67.9% for AGIs over 100k)
Taxable interest for individuals: $930 (reported on 48.3% of returns)
This zip code:
$930
New York:
$2,377
(% of AGI for various income ranges: 5.2% for AGIs below $10k, 1.5% for AGIs $10k-25k, 1.0% for AGIs $25k-50k, 1.2% for AGIs $50k-75k, 1.1% for AGIs $75k-100k, 1.3% for AGIs over 100k)
Taxable dividends: $2,390 (reported on 25.0% of returns)
Here:
$2,390
State:
$5,394
(% of AGI for various income ranges: 5.7% for AGIs below $10k, 1.5% for AGIs $10k-25k, 1.2% for AGIs $25k-50k, 1.6% for AGIs $50k-75k, 1.7% for AGIs $75k-100k, 2.2% for AGIs over 100k)
Net capital gain/loss: +$3,472 (reported on 18.3% of returns)
Here:
+$3,472
State:
+$23,581
(% of AGI for various income ranges: -2.3% for AGIs below $10k, -0.3% for AGIs $10k-25k, 0.4% for AGIs $25k-50k, 1.2% for AGIs $50k-75k, 1.8% for AGIs $75k-100k, 5.8% for AGIs over 100k)
Profit/loss from business: +$10,713 (reported on 11.1% of returns)
Here:
+$10,713
State:
+$13,809
(% of AGI for various income ranges: 10.1% for AGIs below $10k, 3.3% for AGIs $10k-25k, 1.6% for AGIs $25k-50k, 1.9% for AGIs $50k-75k, 1.8% for AGIs $75k-100k, 7.2% for AGIs over 100k)
IRA payment deduction: $2,547 (reported on 2.5% of returns)
14620:
$2,547
New York:
$3,115
(% of AGI for various income ranges: 0.3% for AGIs below $10k, 0.2% for AGIs $10k-25k, 0.3% for AGIs $25k-50k, 0.2% for AGIs $50k-75k, 0.2% for AGIs $75k-100k, 0.1% for AGIs over 100k)
Self-employed pension: $12,350 (reported on 1.0% of returns)
Here:
$12,350
New York:
$19,016
(% of AGI for various income ranges: 0.1% for AGIs $10k-25k, 0.1% for AGIs $25k-50k, 0.2% for AGIs $50k-75k, 1.2% for AGIs over 100k)
Total itemized deductions: $14,028 (21% of AGI, reported on 27.6% of returns)
Here:
$14,028
State:
$25,864
Here:
20.8% of AGI
State:
21.9% of AGI
(% of AGI for various income ranges: 16.5% for AGIs below $10k, 5.6% for AGIs $10k-25k, 8.2% for AGIs $25k-50k, 11.7% for AGIs $50k-75k, 14.6% for AGIs $75k-100k, 15.0% for AGIs over 100k)
Charity contributions deductions: $2,599 (3% of AGI, reported on 22.8% of returns)
Here:
$2,599
State:
$4,439
Here:
3.5% of AGI
State:
3.6% of AGI
(% of AGI for various income ranges: 0.5% for AGIs below $10k, 0.6% for AGIs $10k-25k, 1.1% for AGIs $25k-50k, 1.8% for AGIs $50k-75k, 2.4% for AGIs $75k-100k, 2.7% for AGIs over 100k)
Total tax: $5,135 (reported on 75.5% of returns)
14620:
$5,135
State:
$11,730
(% of AGI for various income ranges: 3.3% for AGIs below $10k, 4.8% for AGIs $10k-25k, 8.5% for AGIs $25k-50k, 11.0% for AGIs $50k-75k, 11.8% for AGIs $75k-100k, 18.4% for AGIs over 100k)
Earned income credit: $1,447 (reported on 15.4% of returns)
Here:
$1,447
State:
$1,757
Percentage of individuals using paid preparers for their 2004 taxes: 51.4%
Here:
51%
State:
67%
(% for various income ranges: 49.5% for AGIs below $10k, 51.2% for AGIs $10k-25k, 49.4% for AGIs $25k-50k, 53.2% for AGIs $50k-75k, 56.2% for AGIs $75k-100k, 63.0% for AGIs over 100k)
Likely homosexual households (counted as self-reported same-sex unmarried-partner households)
Lesbian couples: 0.4% of all households
Gay men: 0.6% of all households
Household received Food Stamps/SNAP in the past 12 months: 1,940 Household did not receive Food Stamps/SNAP in the past 12 months: 10,496
Women who had a birth in the past 12 months: 179 (154 now married, 23 unmarried) Women who did not have a birth in the past 12 months: 6,979 (1,620 now married, 5,402 unmarried)
Housing units in zip code 14620 with a mortgage: 2,074 (295 second mortgage, 12 home equity loan, 287 both second mortgage and home equity loan) Houses without a mortgage: 96
Median monthly owner costs for units with a mortgage: $1,524 Median monthly owner costs for units without a mortgage: $712
Residents with income below the poverty level in 2022:
This zip code:
21.3%
Whole state:
14.3%
Residents with income below 50% of the poverty level in 2022:
This zip code:
9.5%
Whole state:
6.8%
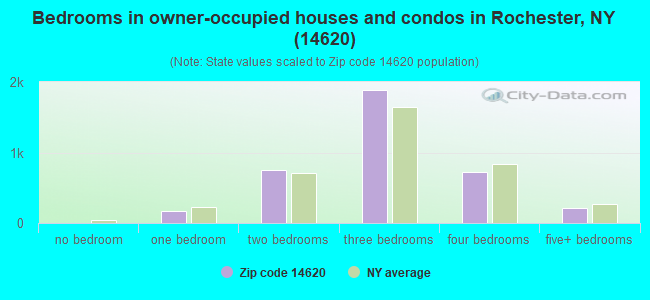
Median number of rooms in houses and condos:
Here:
6.2
State:
6.3
Median number of rooms in apartments:
Here:
3.9
State:
3.8
Notable locations in this zip code not listed on our city pages
Notable locations in zip code 14620: Monroe County Parks Arboretum (A), Ellwanger Garden (B), Warner Castle (C), Rochester Science Park (D), Monroe Community Hospital (E), Mount Hope Professional Building (F), Goler House (G), Arthur Kornberg Medical Research Building (H), Helen Wood Hall (I), Slater Hall (J), Munro Hall (K), Kendrick Hall (L), Gale Hall (M), Fairchild Hall (N), Chambers Hall (O), Arbor Hill Care Center (P), Rochester Public Library Highland Branch (Q), Rochester Fire Department Engine 8 (R). Display/hide their locations on the map
Churches in zip code 14620 include: Calvary Saint Andrew's Presbyterian Church (A), Church of Christ (B), Emmanuel Church of Jesus (C), Faith Temple Church (D), First Community Interfaith Institute (E), New Life Presbyterian Church (F), South Presbyterian Church (G), Greek Orthodox Church of the Holy Spirit (H), Lutheran Church of Peace (I). Display/hide their locations on the map
1,199 married couples with children.
806 single-parent households (176 men, 630 women).
82.8% of residents of 14620 zip code speak English at home.
4.5% of residents speak Spanish at home (74% very well, 19% well, 8% not well).
5.3% of residents speak other Indo-European language at home (70% very well, 20% well, 8% not well, 2% not at all).
5.6% of residents speak Asian or Pacific Island language at home (60% very well, 18% well, 17% not well, 5% not at all).
1.7% of residents speak other language at home (79% very well, 18% well, 3% not well).
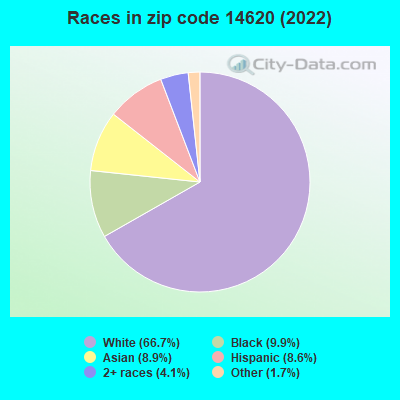
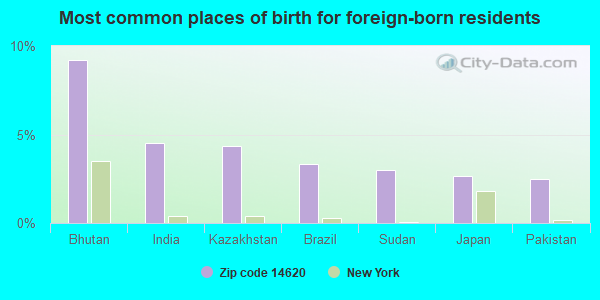
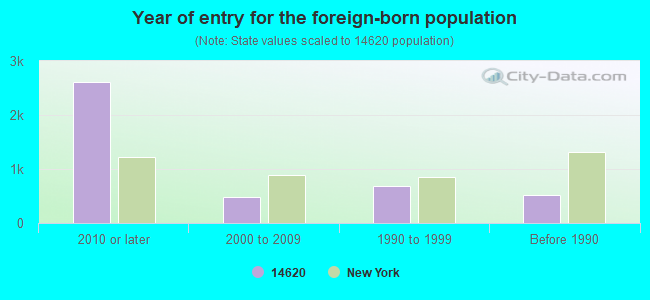
Foreign born population: 3,461 (14.5%) (39.3% of them are naturalized citizens)
Facilities with environmental interests located in this zip code:
IOLA POWERHOUSE & COGEN FACILITY (444 EAST HENRIETTA RD|FLEET MA in ROCHESTER, NY)
AIR SYNTHETIC MINOR (AIRS/AFS) STATE MASTER (New York facility tracking) - SOLID WASTE PROGRAM, HAZARDOUS WASTE PROGRAM, REFUSE DISPOSAL, SOLID WASTE PROGRAM STATE MASTER (New York facility tracking) - AIR PROGRAM, AIR MAJOR, (Integrated Compliance Information System) - ICIS-02-1986-0279, FORMAL ENFORCEMENT ACTION CRITERIA AND HAZARDOUS AIR POLLUTANT INVENTORY (Inventory of air pollution sources) Small Quantity Generators, between 100 kg and 1000 kg of hazardous waste/month (Resource Conservation and Recovery Act (tracking hazardous waste)) Business SIC classification: HEATING EQUIPMENT, EXCEPT ELECTRIC AND WARM AIR FURNACES; ELECTRIC AND OTHER SERVICES COMBINED; STEAM AND AIR-CONDITIONING SUPPLY; HEALTH AND ALLIED SERVICES Business NAICS classification: STEAM AND AIR-CONDITIONING SUPPLY. Organizations: MONROE NEWPOWER CORPORATION, MONROE COUNTY (LEGALLY RESPONSIBLE PARTY)
Alternative names: IOLA COMPLEX, IOLA STEAM GENERATING STATION ROCHES, MONROE COUNTY FLEET MGMT
HIGHLAND HOSPITAL OF ROCHESTER (1000 SOUTH AVE in ROCHESTER, NY)
AIR SYNTHETIC MINOR (AIRS/AFS) STATE MASTER (New York facility tracking) - REFUSE DISPOSAL, AIR PROGRAM, HAZARDOUS WASTE PROGRAM Small Quantity Generators, between 100 kg and 1000 kg of hazardous waste/month (Resource Conservation and Recovery Act (tracking hazardous waste)) - ICIS-, ENFORCEMENT/COMPLIANCE ACTIVITY Business SIC and NAICS classification: GENERAL MEDICAL AND SURGICAL HOSPITALS
ABVI (422 S CLINTON AVE in ROCHESTER, NY)
COMPLIANCE ACTIVITY (Tracking inspections of insecticide, fungicide, and rodenticide, and toxic substances) (Resource Conservation and Recovery Act (tracking hazardous waste)) Alternative names: A B V I
COOK OIL (335 E HENRIETTA RD in ROCHESTER, NY)
(Resource Conservation and Recovery Act (tracking hazardous waste)) Organizations: O COOK OIL (CONTACT/OPERATOR)
CITY OF ROCHESTER (85 ADAMS STREET in ROCHESTER, NY)
HAZARDOUS WASTE BIENNIAL REPORTER (Resource Conservation and Recovery Act (tracking hazardous waste)) Large Quantity Generators, more that 1000 kg of hazardous waste/month (Resource Conservation and Recovery Act (tracking hazardous waste)) - notification Alternative names: ROCHESTER CITY OF ADAMS ST REC CTR
GREATER ROCHESTER CABLEVISION (71 MT HOPE AVE in ROCHESTER, NY)
(Resource Conservation and Recovery Act (tracking hazardous waste))
HILLEL SCHOOL (191 FAIRFIELD DRIVE in ROCHESTER, NY)
ENFORCEMENT/COMPLIANCE ACTIVITY (Integrated Compliance Information System) COMPLIANCE ACTIVITY (Tracking inspections of insecticide, fungicide, and rodenticide, and toxic substances)
INTERNATIONAL WASTE REMOVAL INC (350 E HENRIETTA RD NW SECTION in ROCHESTER, NY)
(Resource Conservation and Recovery Act (tracking hazardous waste))
CLINTON COLLISION SERVICE (17 ALEXANDER ST in ROCHESTER, NY)
(Resource Conservation and Recovery Act (tracking hazardous waste))
ALSTOM SIGNALING INC (150 SAWGRASS DR in ROCHESTER, NY)
Small Quantity Generators, between 100 kg and 1000 kg of hazardous waste/month (Resource Conservation and Recovery Act (tracking hazardous waste)) - notification
AMERADA HESS STATION 32353 (1431 MOUNT HOPE AVE in ROCHESTER, NY)
Conditionally Exempt Small Quantity Generators, less than 100 kg/month of hazardous waste (Resource Conservation and Recovery Act (tracking hazardous waste)) - notification Organizations: AMERADA HESS CORP (CONTACT/OWNER)
HILLSIDE CHILDREN'S CENTER (1183 MONROE DR in ROCHESTER, NY)
COMPLIANCE ACTIVITY (Tracking inspections of insecticide, fungicide, and rodenticide, and toxic substances)
Housing units lacking complete plumbing facilities: 0.2% Housing units lacking complete kitchen facilities: 1.3%
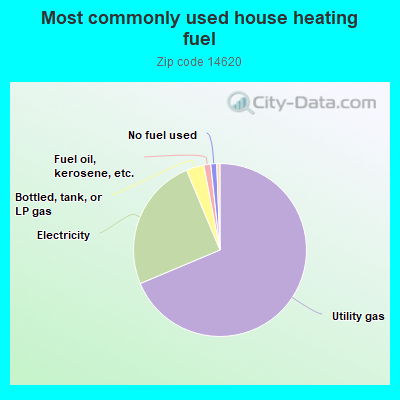
68.6%Utility gas
25.0%Electricity
3.3%Bottled, tank, or LP gas
1.3%Fuel oil, kerosene, etc.
1.1%No fuel used
0.6%Other fuel
Population in 1990: 29,819.
Place of birth for U.S.-born residents:
This state: 13,732
Northeast: 2,226
Midwest: 1,086
South: 1,859
West: 1,009
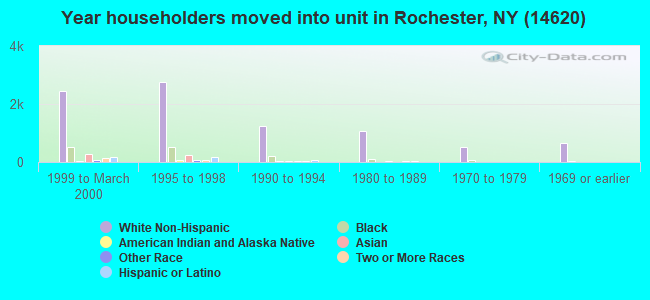
39% of the 14620 zip code residents lived in the same house 5 years ago. Out of people who lived in different houses, 59% lived in this county. Out of people who lived in different counties, 50% lived in New York.
80% of the 14620 zip code residents lived in the same house 1 year ago. Out of people who lived in different houses, 59% moved from this county. Out of people who lived in different houses, 13% moved from different county within same state. Out of people who lived in different houses, 17% moved from different state. Out of people who lived in different houses, 12% moved from abroad.
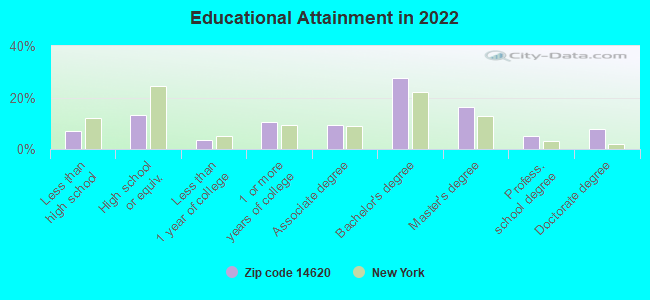
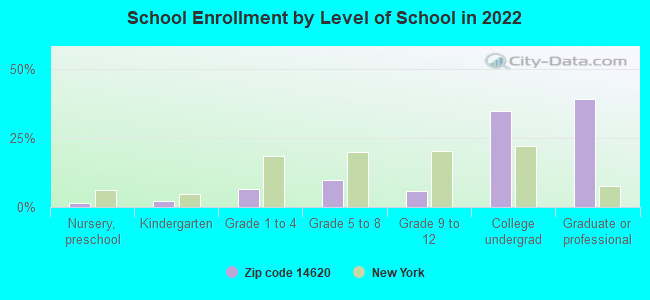
Private vs. public school enrollment:
Students in private schools in grades 1 to 8 (elementary and middle school): 86
Here:
9.0%
New York:
15.6%
Students in private schools in grades 9 to 12 (high school): 68
Here:
20.7%
New York:
15.0%
Students in private undergraduate colleges: 1,198
Here:
58.3%
New York:
39.2%
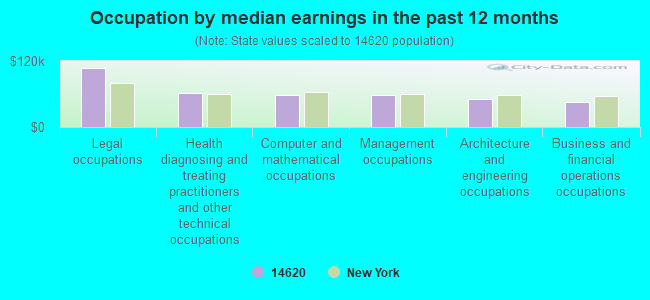
Occupation by median earnings in the past 12 months ($)
106,555Legal occupations
61,776Health diagnosing and treating practitioners and other technical occupations
58,508Computer and mathematical occupations
57,275Management occupations
50,739Architecture and engineering occupations
45,280Business and financial operations occupations
Companies with federal contracts located in this zip code:
PATHOLOGICS, LLC (625 ELMWOOD AVENUE, SUITE in ROCHESTER, NY; small business)
$83,820 with Air Force for Other Research and Development -- Applied Research and Exploratory Development (R&D). Signed on 2005-04-27. Completion date: 2006-01-01.
Top industries in this zip code by the number of employees in 2005:
Health Care and Social Assistance: General Medical and Surgical Hospitals (over 1000 employees: 2 establishments)
Health Care and Social Assistance: Child and Youth Services (over 1000: 1, 50-99: 1)
Health Care and Social Assistance: Nursing Care Facilities (500-999: 1, 250-499: 1, 100-249: 2, 1-4: 1)
Health Care and Social Assistance: Psychiatric and Substance Abuse Hospitals (500-999: 1)
Health Care and Social Assistance: Other Individual and Family Services (250-499: 1, 50-99: 2, 10-19: 2, 5-9: 3, 1-4: 2)
Health Care and Social Assistance: Vocational Rehabilitation Services (250-499: 1, 50-99: 1, 20-49: 2, 10-19: 1, 5-9: 2, 1-4: 1)
Health Care and Social Assistance: Offices of Physicians (except Mental Health Specialists) (100-249: 1, 50-99: 1, 20-49: 1, 10-19: 6, 5-9: 7, 1-4: 12)
2004 - 2018 National Fire Incident Reporting System (NFIRS) incidents
Based on the data from the years 2004 - 2018 the average number of fire incidents per year is 79. The highest number of fires - 111 took place in 2011, and the least - 4 in 2004. The data has a rising trend.
When looking into fire subcategories, the most incidents belonged to: Structure Fires (50.0%), and Outside Fires (39.0%).
Fire incident types reported to NFIRS in Zip Code 14620

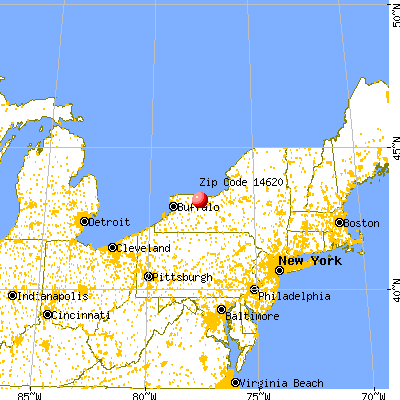


 Nearest zip codes: 14627, 14604, 14607, 14614, 14608, 14605.
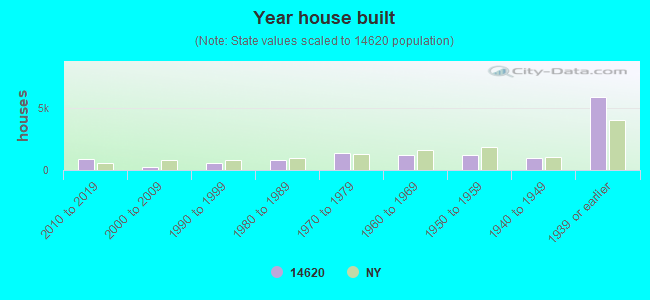


 Based on the data from the years 2004 - 2018 the average number of fire incidents per year is 79. The highest number of fires - 111 took place in 2011, and the least - 4 in 2004. The data has a rising trend.
 When looking into fire subcategories, the most incidents belonged to: Structure Fires (50.0%), and Outside Fires (39.0%).