Estimated zip code population in 2022: 4,039 Zip code population in 2010: 4,252 Zip code population in 2000: 4,275
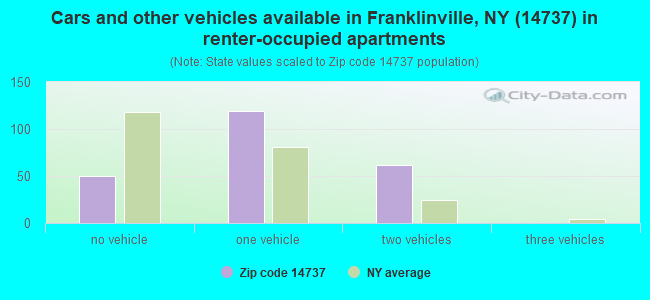
Houses and condos: 2,569 Renter-occupied apartments: 230
% of renters here:
13%
State:
46%
March 2022 cost of living index in zip code 14737: 93.4 (less than average, U.S. average is 100)
Land area: 110.2 sq. mi. Water area: 0.4 sq. mi.
Population density: 37 people per square mile
(very low).
OSM Map
General Map
Google Map
MSN Map
OSM Map
General Map
Google Map
MSN Map
OSM Map
General Map
Google Map
MSN Map
OSM Map
General Map
Google Map
MSN Map
Please wait while loading the map...
Real estate property taxes paid for housing units in 2022:
This zip code:
2.9% ($2,793)
New York:
1.5% ($6,180)
Median real estate property taxes paid for housing units with mortgages in 2022: $2,836 (3.0%) Median real estate property taxes paid for housing units with no mortgage in 2022: $2,755 (2.8%)
Averages for the 2020 tax year for zip code 14737, filed in 2021:
Average Adjusted Gross Income (AGI) in 2020: $50,736 (Individual Income Tax Returns)
Here:
$50,736
State:
$90,930
Salary/wage: $42,550 (reported on 81.1% of returns)
Here:
$42,550
State:
$72,104
(% of AGI for various income ranges: 1126.8% for AGIs below $25k, 3157.7% for AGIs $25k-50k, 5339.6% for AGIs $50k-75k, 8132.1% for AGIs $75k-100k, 14837.5% for AGIs $100k-200k)
Taxable interest for individuals: $546 (reported on 32.0% of returns)
This zip code:
$546
New York:
$3,075
(% of AGI for various income ranges: 9.2% for AGIs below $25k, 8.2% for AGIs $25k-50k, 29.6% for AGIs $50k-75k, 41.4% for AGIs $75k-100k, 83.3% for AGIs $100k-200k)
Ordinary dividends: $2,310 (reported on 12.4% of returns)
Here:
$2,310
State:
$11,095
(% of AGI for various income ranges: 13.5% for AGIs below $25k, 26.9% for AGIs $25k-50k, 24.8% for AGIs $50k-75k, 37.1% for AGIs $75k-100k, 180.8% for AGIs $100k-200k)
Net capital gain/loss in AGI: +$4,069 (reported on 9.5% of returns)
Here:
+$4,069
State:
+$44,925
(% of AGI for various income ranges: 2.0% for AGIs below $25k, 3.6% for AGIs $25k-50k, 112.2% for AGIs $50k-75k, 309.2% for AGIs $100k-200k)
Profit/loss from business: +$8,733 (reported on 12.4% of returns)
Here:
+$8,733
State:
+$14,940
(% of AGI for various income ranges: 110.8% for AGIs below $25k, 145.9% for AGIs $25k-50k, 247.8% for AGIs $50k-75k, 210.0% for AGIs $100k-200k)
Taxable individual retirement arrangement distribution: $13,282 (reported on 10.1% of returns)
14737:
$13,282
New York:
$19,609
(% of AGI for various income ranges: 48.5% for AGIs below $25k, 91.0% for AGIs $25k-50k, 207.0% for AGIs $50k-75k, 340.0% for AGIs $75k-100k, 630.8% for AGIs $100k-200k)
Total itemized deductions: $32,733 (reported on 1.8% of returns)
Here:
$32,733
State:
$39,326
(% of AGI for various income ranges: 427.0% for AGIs $50k-75k)
Taxes paid: $8,467 (reported on 1.8% of returns)
14737:
$8,467
State:
$9,183
(% of AGI for various income ranges: 181.4% for AGIs $75k-100k)
Earned income credit: $2,350 (reported on 17.8% of returns)
Here:
$2,350
State:
$2,138
(% of AGI for various income ranges: 101.8% for AGIs below $25k, 76.4% for AGIs $25k-50k)
Percentage of individuals using paid preparers for their 2020 taxes: 97.0%
Here:
97%
State:
95%
(% for various income ranges: 96.4% for AGIs below $25k, 97.9% for AGIs $25k-50k, 96.6% for AGIs $50k-75k, 100.0% for AGIs $75k-100k, 94.7% for AGIs $100k-200k)
Averages for the 2012 tax year for zip code 14737, filed in 2013:
Average Adjusted Gross Income (AGI) in 2012: $39,176 (Individual Income Tax Returns)
Here:
$39,176
State:
$77,088
Salary/wage: $34,564 (reported on 83.3% of returns)
Here:
$34,564
State:
$60,593
(% of AGI for various income ranges: 71.6% for AGIs below $25k, 74.6% for AGIs $25k-50k, 75.6% for AGIs $50k-75k, 75.4% for AGIs $75k-100k, 69.5% for AGIs $100k-200k)
Taxable interest for individuals: $593 (reported on 34.5% of returns)
This zip code:
$593
New York:
$3,125
(% of AGI for various income ranges: 0.7% for AGIs below $25k, 0.6% for AGIs $25k-50k, 0.7% for AGIs $50k-75k, 0.3% for AGIs $75k-100k, 0.4% for AGIs $100k-200k)
Ordinary dividends: $1,758 (reported on 13.8% of returns)
Here:
$1,758
State:
$10,299
(% of AGI for various income ranges: 1.2% for AGIs below $25k, 0.5% for AGIs $25k-50k, 1.1% for AGIs $50k-75k, 0.1% for AGIs $75k-100k, 0.2% for AGIs $100k-200k)
Net capital gain/loss in AGI: +$3,906 (reported on 9.2% of returns)
Here:
+$3,906
State:
+$42,474
(% of AGI for various income ranges: 0.3% for AGIs $25k-50k, 0.7% for AGIs $50k-75k, 0.5% for AGIs $75k-100k, 3.0% for AGIs $100k-200k)
Profit/loss from business: +$7,343 (reported on 13.2% of returns)
Here:
+$7,343
State:
+$16,168
(% of AGI for various income ranges: 7.4% for AGIs below $25k, 2.7% for AGIs $25k-50k, 3.2% for AGIs $50k-75k)
Taxable individual retirement arrangement distribution: $9,183 (reported on 10.3% of returns)
14737:
$9,183
New York:
$17,621
(% of AGI for various income ranges: 3.0% for AGIs below $25k, 2.4% for AGIs $25k-50k, 3.2% for AGIs $50k-75k, 3.7% for AGIs $75k-100k)
Total itemized deductions: $16,590 (21% of AGI, reported on 16.7% of returns)
Here:
$16,590
State:
$34,985
Here:
21.2% of AGI
State:
21.3% of AGI
(% of AGI for various income ranges: 3.4% for AGIs below $25k, 5.4% for AGIs $25k-50k, 6.9% for AGIs $50k-75k, 7.3% for AGIs $75k-100k, 11.7% for AGIs $100k-200k)
Charity contributions: $2,332 (reported on 10.9% of returns)
Here:
$2,332
State:
$5,572
(% of AGI for various income ranges: 0.3% for AGIs $25k-50k, 0.8% for AGIs $50k-75k, 0.6% for AGIs $75k-100k, 1.4% for AGIs $100k-200k)
Taxes paid: $7,603 (reported on 16.7% of returns)
14737:
$7,603
State:
$18,656
(% of AGI for various income ranges: 0.8% for AGIs below $25k, 2.1% for AGIs $25k-50k, 2.8% for AGIs $50k-75k, 3.5% for AGIs $75k-100k, 6.6% for AGIs $100k-200k)
Earned income credit: $2,055 (reported on 23.0% of returns)
Here:
$2,055
State:
$2,230
(% of AGI for various income ranges: 6.5% for AGIs below $25k, 1.2% for AGIs $25k-50k)
Percentage of individuals using paid preparers for their 2012 taxes: 55.2%
Here:
55%
State:
66%
(% for various income ranges: 51.9% for AGIs below $25k, 54.2% for AGIs $25k-50k, 64.0% for AGIs $50k-75k, 57.1% for AGIs $75k-100k, 60.0% for AGIs $100k-200k)
Averages for the 2004 tax year for zip code 14737, filed in 2005:
Average Adjusted Gross Income (AGI) in 2004: $32,101 (Individual Income Tax Returns)
Here:
$32,101
State:
$59,519
Salary/wage: $30,184 (reported on 84.7% of returns)
Here:
$30,184
State:
$50,673
(% of AGI for various income ranges: 91.0% for AGIs below $10k, 76.3% for AGIs $10k-25k, 79.5% for AGIs $25k-50k, 83.0% for AGIs $50k-75k, 79.4% for AGIs $75k-100k, 75.1% for AGIs over 100k)
Taxable interest for individuals: $739 (reported on 40.5% of returns)
This zip code:
$739
New York:
$2,377
(% of AGI for various income ranges: 3.3% for AGIs below $10k, 1.2% for AGIs $10k-25k, 1.1% for AGIs $25k-50k, 0.7% for AGIs $50k-75k, 0.3% for AGIs $75k-100k, 0.6% for AGIs over 100k)
Taxable dividends: $1,287 (reported on 18.6% of returns)
Here:
$1,287
State:
$5,394
(% of AGI for various income ranges: 2.5% for AGIs below $10k, 1.2% for AGIs $10k-25k, 0.7% for AGIs $25k-50k, 0.5% for AGIs $50k-75k, 0.2% for AGIs $75k-100k, 0.9% for AGIs over 100k)
Net capital gain/loss: +$2,948 (reported on 14.0% of returns)
Here:
+$2,948
State:
+$23,581
(% of AGI for various income ranges: -1.3% for AGIs below $10k, 2.0% for AGIs $10k-25k, 0.2% for AGIs $25k-50k, 0.4% for AGIs $50k-75k, 3.0% for AGIs $75k-100k, 3.6% for AGIs over 100k)
Profit/loss from business: +$4,668 (reported on 13.0% of returns)
Here:
+$4,668
State:
+$13,809
(% of AGI for various income ranges: 6.1% for AGIs below $10k, 3.8% for AGIs $10k-25k, 1.3% for AGIs $25k-50k, 1.7% for AGIs $50k-75k, 0.6% for AGIs $75k-100k, 1.7% for AGIs over 100k)
IRA payment deduction: $2,528 (reported on 2.0% of returns)
14737:
$2,528
New York:
$3,115
Total itemized deductions: $14,540 (22% of AGI, reported on 17.3% of returns)
Here:
$14,540
State:
$25,864
Here:
21.6% of AGI
State:
21.9% of AGI
(% of AGI for various income ranges: 3.7% for AGIs $10k-25k, 5.2% for AGIs $25k-50k, 8.5% for AGIs $50k-75k, 14.1% for AGIs $75k-100k, 13.1% for AGIs over 100k)
Charity contributions deductions: $1,992 (3% of AGI, reported on 14.1% of returns)
Here:
$1,992
State:
$4,439
Here:
2.8% of AGI
State:
3.6% of AGI
(% of AGI for various income ranges: 0.4% for AGIs $10k-25k, 0.7% for AGIs $25k-50k, 0.6% for AGIs $50k-75k, 1.5% for AGIs $75k-100k, 1.8% for AGIs over 100k)
Total tax: $3,706 (reported on 69.5% of returns)
14737:
$3,706
State:
$11,730
(% of AGI for various income ranges: 3.0% for AGIs below $10k, 3.6% for AGIs $10k-25k, 6.3% for AGIs $25k-50k, 8.3% for AGIs $50k-75k, 10.4% for AGIs $75k-100k, 15.3% for AGIs over 100k)
Earned income credit: $1,725 (reported on 21.4% of returns)
Here:
$1,725
State:
$1,757
Percentage of individuals using paid preparers for their 2004 taxes: 61.3%
Here:
61%
State:
67%
(% for various income ranges: 56.2% for AGIs below $10k, 60.5% for AGIs $10k-25k, 64.6% for AGIs $25k-50k, 62.9% for AGIs $50k-75k, 62.9% for AGIs $75k-100k, 69.0% for AGIs over 100k)
Household received Food Stamps/SNAP in the past 12 months: 195 Household did not receive Food Stamps/SNAP in the past 12 months: 1,542
Women who had a birth in the past 12 months: 49 (35 now married, 14 unmarried) Women who did not have a birth in the past 12 months: 639 (392 now married, 239 unmarried)
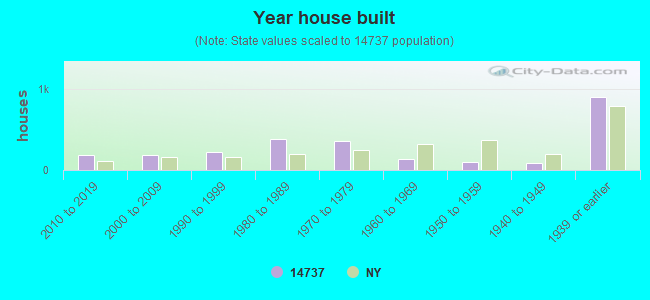
Housing units in zip code 14737 with a mortgage: 566 (22 second mortgage, 22 both second mortgage and home equity loan) Houses without a mortgage: 21
Median monthly owner costs for units with a mortgage: $1,075 Median monthly owner costs for units without a mortgage: $531
Residents with income below the poverty level in 2022:
This zip code:
16.1%
Whole state:
14.3%
Residents with income below 50% of the poverty level in 2022:
This zip code:
12.4%
Whole state:
6.8%
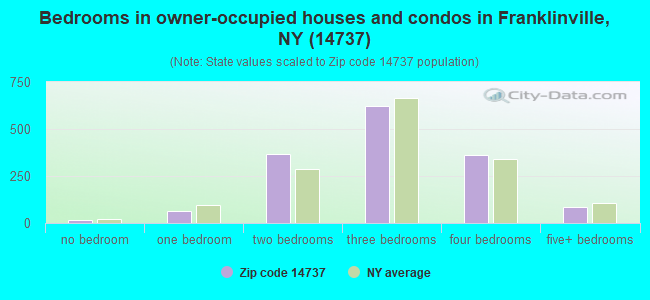
Median number of rooms in houses and condos:
Here:
6.2
State:
6.3
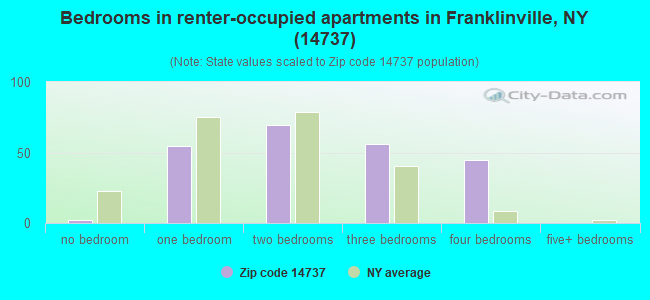
Median number of rooms in apartments:
Here:
5.6
State:
3.8
Notable locations in this zip code not listed on our city pages
Notable locations in zip code 14737: Triple R Campground (A), Strzelec Farm (B), Ischua Valley Country Club (C), Blount Library (D), Lyndon Volunteer Fire Company (E), Franklinville Fire Department (F). Display/hide their locations on the map
Churches in zip code 14737 include: Christian and Missionary Alliance Church (A), Farmersville Center Community Church (B), First Baptist Church (C), Franklinville Free Methodist Church (D), Presbyterian Church (E), Saint Philomena Roman Catholic Church (F), Rawson Church (G). Display/hide their locations on the map
Cemeteries: Root Cemetery (1), Farmersville Center Cemetery (2), Cadiz Cemetery (3), Rawson Cemetery (4), Mount Prospect Cemetery (5), Ten Broeck Cemetery (6). Display/hide their locations on the map
Streams, rivers, and creeks: Bear Creek (A), Boyce Run (B), Storrs Creek (C), Gates Creek (D), Saunders Creek (E), Johnson Creek (F). Display/hide their locations on the map
In group quarters: 34 (-1 institutionalized population)
Size of family households: 572 2-persons, 213 3-persons, 117 4-persons, 131 5-persons, 25 6-persons, 47 7-or-more-persons
Size of nonfamily households: 535 1-person, 110 2-persons
698 married couples with children.
133 single-parent households (87 men, 46 women).
98.4% of residents of 14737 zip code speak English at home.
0.2% of residents speak Spanish at home (100% very well).
1.6% of residents speak other Indo-European language at home (27% very well, 73% well).
0.1% of residents speak Asian or Pacific Island language at home (100% not well).
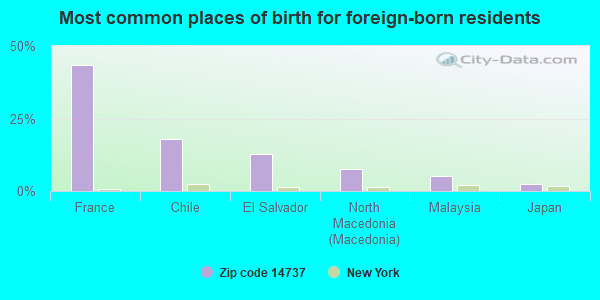
Foreign born population: 40 (1.0%) (88.1% of them are naturalized citizens)
This zip code:
1.0%
Whole state:
22.7%
44%France
18%Chile
13%El Salvador
8%North Macedonia (Macedonia)
5%Malaysia
3%Japan
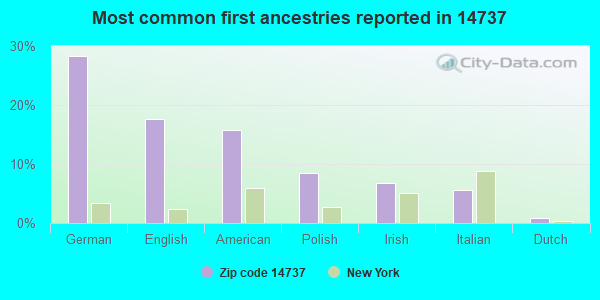
28%German
18%English
16%American
8%Polish
7%Irish
6%Italian
1%Dutch
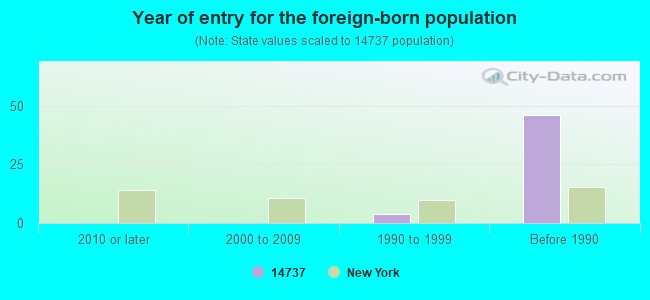
Year of entry for the foreign-born population
02010 or later
02000 to 2009
41990 to 1999
46Before 1990
Major facilities with environmental interests located in this zip code:
FRANKLINVILLE ES ( in FRANKLINVILLE, NY)
(National Center for Education Statistics) - STATE ID-041101040003 Organizations: FRANKLINVILLE CSD (SCHOOL DISTRICT)
FRANKLINVILLE JSHS ( in FRANKLINVILLE, NY)
(National Center for Education Statistics) - STATE ID-041101040002 Organizations: FRANKLINVILLE CSD (SCHOOL DISTRICT)
FRANKLINVILLE LL RADIO STATION (PIERCE HILL RD in FRANKLINVILLE, NY)
FRANKLINVILLE AGWAY (1 WEST AVE in FRANKLINVILLE, NY)
(Resource Conservation and Recovery Act (tracking hazardous waste))
FRANKLINVILLE SCHOOL DIST - HIGH SCHOOL (31 N MAIN ST in FRANKLINVILLE, NY)
(Resource Conservation and Recovery Act (tracking hazardous waste))
FRANKLINVILLE SCHOOL DISTRICT (32 N MAIN ST in FRANKLINVILLE, NY)
(Resource Conservation and Recovery Act (tracking hazardous waste))
FRANKLINVILLE SUBSTATION (SO MAIN ST in FRANKLINVILLE, NY)
(Resource Conservation and Recovery Act (tracking hazardous waste))
BUFFALO CRUSHED STONE CO INC (RTE 16 FRANKLINVILLE in FRANKLINVILLE, NY)
(Resource Conservation and Recovery Act (tracking hazardous waste))
CATTARAUGUS CO - FRANKLINVILLE BRG #9 (MORGAN HOLLOW RD OVER in FRANKLINVILLE, NY)
Small Quantity Generators, between 100 kg and 1000 kg of hazardous waste/month (Resource Conservation and Recovery Act (tracking hazardous waste)) Organizations: CATTARAUGUS COUNTY (CONTACT/OWNER)
CATTARAUGUS CO DPW FRANKLINVILLE BRG #20 (TOWNLINE RD OVER GATES CREEK in FRANKLINVILLE, NY)
Small Quantity Generators, between 100 kg and 1000 kg of hazardous waste/month (Resource Conservation and Recovery Act (tracking hazardous waste)) Organizations: CATTARAUGUS COUNTY (CONTACT/OPERATOR)
CATTARAUGUS COUNTY D P W (CR 19 OVER ISCHUA CREEK in FRANKLINVILLE, NY)
(Resource Conservation and Recovery Act (tracking hazardous waste))
CATTARAUGUS COUNTY D P W (RTE 16 N OF FRANKLINVILLE in FRANKLINVILLE, NY)
(Resource Conservation and Recovery Act (tracking hazardous waste))
CATTARAUGUS COUNTY DPW (PIERCE HILL RD OVER in FRANKLINVILLE, NY)
(Resource Conservation and Recovery Act (tracking hazardous waste))
Housing units lacking complete plumbing facilities: 7.4% Housing units lacking complete kitchen facilities: 7.4%
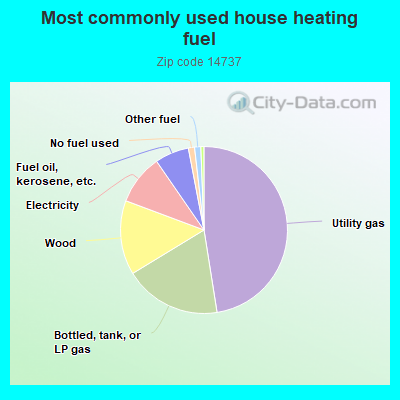
47.5%Utility gas
18.8%Bottled, tank, or LP gas
14.4%Wood
9.7%Electricity
6.6%Fuel oil, kerosene, etc.
1.2%No fuel used
1.2%Other fuel
0.6%Coal or coke
Population in 1990: 3,965. Population change in the 1990s: +310 (+7.8%).
Place of birth for U.S.-born residents:
This state: 3,232
Northeast: 173
Midwest: 305
South: 102
West: 179
63% of the 14737 zip code residents lived in the same house 5 years ago. Out of people who lived in different houses, 63% lived in this county. Out of people who lived in different counties, 50% lived in New York.
94% of the 14737 zip code residents lived in the same house 1 year ago. Out of people who lived in different houses, 73% moved from this county. Out of people who lived in different houses, 19% moved from different county within same state. Out of people who lived in different houses, 4% moved from different state.
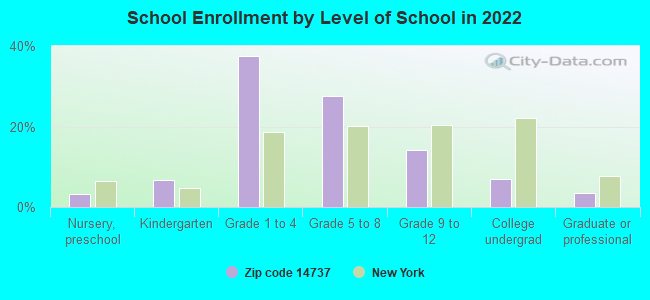
Private vs. public school enrollment:
Students in private schools in grades 1 to 8 (elementary and middle school): 45
Here:
9.5%
New York:
15.6%
Students in private schools in grades 9 to 12 (high school): 20
Here:
19.4%
New York:
15.0%
Students in private undergraduate colleges: 5
Here:
11.5%
New York:
39.2%
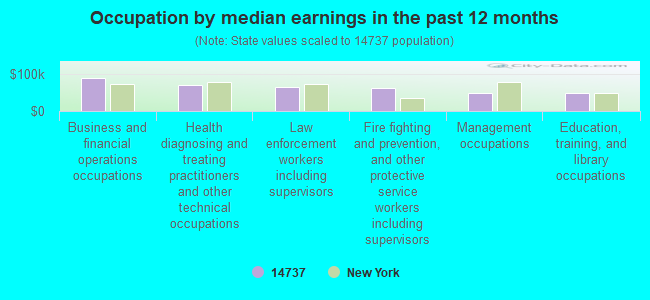
Occupation by median earnings in the past 12 months ($)
89,263Business and financial operations occupations
68,680Health diagnosing and treating practitioners and other technical occupations
63,988Law enforcement workers including supervisors
62,269Fire fighting and prevention, and other protective service workers including supervisors
48,686Management occupations
47,061Education, training, and library occupations
Top industries in this zip code by the number of employees in 2005:
Accommodation and Food Services: Limited-Service Restaurants (20-49 employees: 1 establishment)
Mining: Construction Sand and Gravel Mining (10-19: 1)
Utilities: Electric Power Distribution (10-19: 1)
Other Services (except Public Administration): Religious Organizations (5-9: 1, 1-4: 4)
Finance and Insurance: Commercial Banking (5-9: 2)
Accommodation and Food Services: Full-Service Restaurants (5-9: 1, 1-4: 3)
People in group quarters in 2010:
11 people in group homes intended for adults
People in group quarters in 2000:
8 people in homes for the mentally retarded
5 people in homes for the mentally ill
Fatal accident statistics in 2013:
Fatal accident count: 2
Vehicles involved in fatal accidents: 3
Fatal accidents caused by drunken drivers: 0
Fatalities: 2
Persons involved in fatal accidents: 5
Pedestrians involved in fatal accidents: 0
Fatal accident statistics in 2011:
Fatal accident count: 1
Vehicles involved in fatal accidents: 1
Fatal accidents caused by drunken drivers: 0
Fatalities: 1
Persons involved in fatal accidents: 1
Pedestrians involved in fatal accidents: 0
Most common first names in zip code 14737 among deceased individuals
Name
Count
Lived (average)
William
43
72.5 years
John
31
73.7 years
Charles
25
72.9 years
Richard
25
71.4 years
Helen
23
79.4 years
George
21
76.6 years
Harold
19
74.0 years
James
18
66.9 years
Robert
18
74.6 years
Mary
15
74.1 years
Most common last names in zip code 14737 among deceased individuals
Last name
Count
Lived (average)
Smith
10
78.6 years
Mcclory
10
80.1 years
Brown
10
83.3 years
Wilson
9
82.9 years
Decker
9
65.9 years
Holmes
9
83.1 years
Rogers
8
77.5 years
Reynolds
8
80.3 years
Pixley
8
71.7 years
Jones
8
79.7 years
Businesses in zip code 14737
Subway: 1
Discuss Franklinville, New York (NY) on our hugely popular New York forum.


 Nearest zip codes: 14743, 14101, 14042, 14777, 14060, 14727.