Estimated zip code population in 2022: 2,206 Zip code population in 2010: 2,458 Zip code population in 2000: 2,596
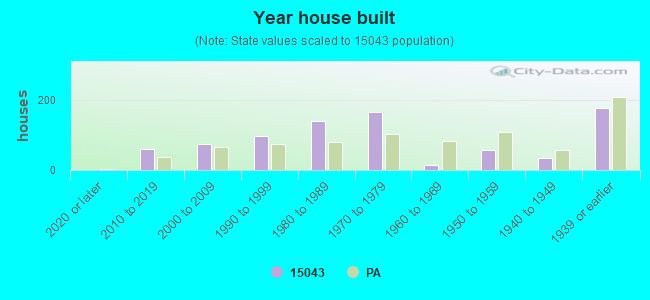
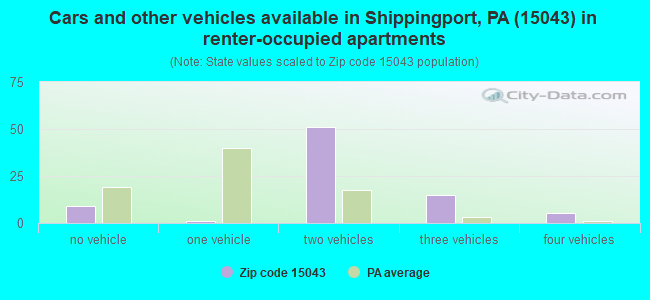
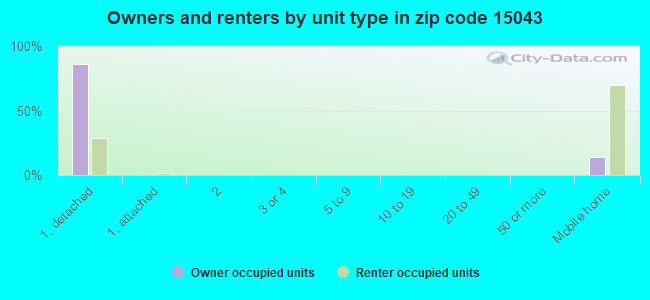
Houses and condos: 827 Renter-occupied apartments: 81
% of renters here:
10%
State:
31%
March 2022 cost of living index in zip code 15043: 88.4 (less than average, U.S. average is 100)
Land area: 32.7 sq. mi. Water area: 1.3 sq. mi.
Population density: 67 people per square mile
(very low).
OSM Map
General Map
Google Map
MSN Map
OSM Map
General Map
Google Map
MSN Map
OSM Map
General Map
Google Map
MSN Map
OSM Map
General Map
Google Map
MSN Map
Please wait while loading the map...
Real estate property taxes paid for housing units in 2022:
This zip code:
1.1% ($2,434)
Pennsylvania:
1.3% ($3,094)
Median real estate property taxes paid for housing units with mortgages in 2022: $2,262 (0.9%) Median real estate property taxes paid for housing units with no mortgage in 2022: $2,693 (1.4%)
Business Search- 14 Million verified businesses
Males: 1,164
(52.8%)
Females: 1,042
(47.2%)
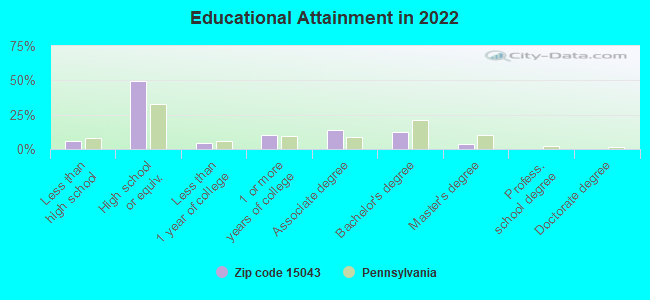
For population 25 years and over in 15043:
High school or higher: 92.4%
Bachelor's degree or higher: 15.7%
Graduate or professional degree: 3.6%
Unemployed: 8.5%
Mean travel time to work (commute): 28.9 minutes
For population 15 years and over in 15043:
Never married: 27.2%
Now married: 63.6%
Separated: 0.3%
Widowed: 3.6%
Divorced: 5.3%
Zip code 15043 compared to state average:
Unemployed percentage above state average.
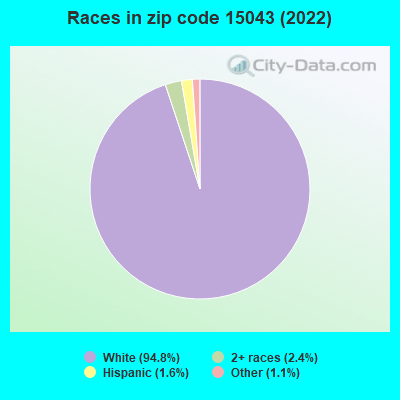
Black race population percentage significantly below state average.
Hispanic race population percentage significantly below state average.
Median age above state average.
Foreign-born population percentage significantly below state average.
Renting percentage significantly below state average.
Length of stay since moving in significantly above state average.
Number of college students below state average.
Percentage of population with a bachelor's degree or higher below state average.
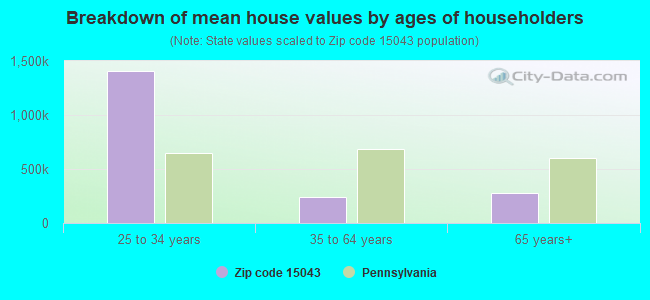
Estimated median house/condo value in 2022: $217,065
15043:
$217,065
Pennsylvania:
$245,500
According to our research of Pennsylvania and other state lists, there was 1 registered sex offender living in 15043 zip code as of April 27, 2024. The ratio of all residents to sex offenders in zip code 15043 is 2,134 to 1. The ratio of registered sex offenders to all residents in this zip code is much lower than the state average.
Median resident age:
This zip code:
48.0 years
Pennsylvania median age:
40.9 years
Average household size:
This zip code:
2.7 people
Pennsylvania:
2.4 people
Averages for the 2020 tax year for zip code 15043, filed in 2021:
Average Adjusted Gross Income (AGI) in 2020: $70,148 (Individual Income Tax Returns)
Here:
$70,148
State:
$75,707
Salary/wage: $61,987 (reported on 82.2% of returns)
Here:
$61,987
State:
$62,806
(% of AGI for various income ranges: 1063.5% for AGIs below $25k, 3172.8% for AGIs $25k-50k, 5943.8% for AGIs $50k-75k, 8031.1% for AGIs $75k-100k, 15154.3% for AGIs $100k-200k)
Taxable interest for individuals: $375 (reported on 31.7% of returns)
This zip code:
$375
Pennsylvania:
$1,633
(% of AGI for various income ranges: 7.6% for AGIs below $25k, 7.2% for AGIs $25k-50k, 11.5% for AGIs $50k-75k, 17.8% for AGIs $75k-100k, 28.6% for AGIs $100k-200k)
Ordinary dividends: $1,736 (reported on 13.9% of returns)
Here:
$1,736
State:
$7,382
(% of AGI for various income ranges: 6.5% for AGIs below $25k, 26.1% for AGIs $25k-50k, 67.8% for AGIs $75k-100k, 88.6% for AGIs $100k-200k)
Net capital gain/loss in AGI: +$4,800 (reported on 10.9% of returns)
Here:
+$4,800
State:
+$23,522
(% of AGI for various income ranges: 26.7% for AGIs $25k-50k, 27.8% for AGIs $75k-100k, 325.0% for AGIs $100k-200k)
Profit/loss from business: +$7,570 (reported on 9.9% of returns)
Here:
+$7,570
State:
+$16,274
(% of AGI for various income ranges: 55.3% for AGIs below $25k, 235.4% for AGIs $50k-75k, 255.0% for AGIs $100k-200k)
Taxable individual retirement arrangement distribution: $13,592 (reported on 11.9% of returns)
15043:
$13,592
Pennsylvania:
$18,583
(% of AGI for various income ranges: 70.0% for AGIs below $25k, 228.9% for AGIs $25k-50k, 472.2% for AGIs $75k-100k, 482.1% for AGIs $100k-200k)
Total itemized deductions: $21,733 (reported on 3.0% of returns)
Here:
$21,733
State:
$34,850
(% of AGI for various income ranges: 465.7% for AGIs $100k-200k)
Taxes paid: $8,000 (reported on 3.0% of returns)
15043:
$8,000
State:
$8,200
(% of AGI for various income ranges: 171.4% for AGIs $100k-200k)
Earned income credit: $1,912 (reported on 7.9% of returns)
Here:
$1,912
State:
$2,100
(% of AGI for various income ranges: 52.9% for AGIs below $25k, 35.0% for AGIs $25k-50k)
Percentage of individuals using paid preparers for their 2020 taxes: 96.0%
Here:
96%
State:
92%
(% for various income ranges: 96.3% for AGIs below $25k, 95.5% for AGIs $25k-50k, 94.1% for AGIs $50k-75k, 100.0% for AGIs $75k-100k, 95.0% for AGIs $100k-200k, 100.0% for AGIs over 200k)
Averages for the 2012 tax year for zip code 15043, filed in 2013:
Average Adjusted Gross Income (AGI) in 2012: $59,524 (Individual Income Tax Returns)
Here:
$59,524
State:
$61,346
Salary/wage: $48,153 (reported on 86.1% of returns)
Here:
$48,153
State:
$51,902
(% of AGI for various income ranges: 72.2% for AGIs below $25k, 78.3% for AGIs $25k-50k, 77.3% for AGIs $50k-75k, 78.0% for AGIs $75k-100k, 75.5% for AGIs $100k-200k, 34.9% for AGIs over 200k)
Taxable interest for individuals: $466 (reported on 32.4% of returns)
This zip code:
$466
Pennsylvania:
$1,588
(% of AGI for various income ranges: 0.7% for AGIs below $25k, 0.1% for AGIs $25k-50k, 0.3% for AGIs $50k-75k, 0.1% for AGIs $75k-100k, 0.2% for AGIs $100k-200k, 0.4% for AGIs over 200k)
Ordinary dividends: $1,047 (reported on 15.7% of returns)
Here:
$1,047
State:
$5,827
(% of AGI for various income ranges: 0.4% for AGIs below $25k, 0.2% for AGIs $25k-50k, 0.1% for AGIs $50k-75k, 0.3% for AGIs $75k-100k, 0.5% for AGIs $100k-200k)
Net capital gain/loss in AGI: +$289 (reported on 8.3% of returns)
Here:
+$289
State:
+$14,495
(% of AGI for various income ranges: 0.1% for AGIs $100k-200k)
Profit/loss from business: +$11,192 (reported on 11.1% of returns)
Here:
+$11,192
State:
+$16,268
(% of AGI for various income ranges: 7.0% for AGIs below $25k, 6.7% for AGIs $25k-50k, 2.4% for AGIs $75k-100k, 1.0% for AGIs $100k-200k)
Taxable individual retirement arrangement distribution: $10,930 (reported on 9.3% of returns)
15043:
$10,930
Pennsylvania:
$14,550
(% of AGI for various income ranges: 1.9% for AGIs below $25k, 4.1% for AGIs $25k-50k, 5.9% for AGIs $75k-100k)
Total itemized deductions: $16,589 (14% of AGI, reported on 25.0% of returns)
Here:
$16,589
State:
$23,538
Here:
14.4% of AGI
State:
18.4% of AGI
(% of AGI for various income ranges: 5.2% for AGIs $25k-50k, 5.8% for AGIs $50k-75k, 9.7% for AGIs $75k-100k, 12.3% for AGIs $100k-200k)
Charity contributions: $2,517 (reported on 16.7% of returns)
Here:
$2,517
State:
$4,025
(% of AGI for various income ranges: 1.2% for AGIs below $25k, 0.3% for AGIs $50k-75k, 0.9% for AGIs $75k-100k, 1.4% for AGIs $100k-200k)
Taxes paid: $7,696 (reported on 25.0% of returns)
15043:
$7,696
State:
$9,982
(% of AGI for various income ranges: 1.6% for AGIs $25k-50k, 2.0% for AGIs $50k-75k, 4.0% for AGIs $75k-100k, 6.8% for AGIs $100k-200k)
Earned income credit: $2,257 (reported on 13.0% of returns)
Here:
$2,257
State:
$2,106
(% of AGI for various income ranges: 5.6% for AGIs below $25k, 0.9% for AGIs $25k-50k)
Percentage of individuals using paid preparers for their 2012 taxes: 59.3%
Here:
59%
State:
53%
(% for various income ranges: 52.8% for AGIs below $25k, 58.3% for AGIs $25k-50k, 64.7% for AGIs $50k-75k, 69.2% for AGIs $75k-100k, 60.0% for AGIs $100k-200k, 66.7% for AGIs over 200k)
Averages for the 2004 tax year for zip code 15043, filed in 2005:
Average Adjusted Gross Income (AGI) in 2004: $38,226 (Individual Income Tax Returns)
Here:
$38,226
State:
$48,049
Salary/wage: $37,389 (reported on 86.2% of returns)
Here:
$37,389
State:
$42,646
(% of AGI for various income ranges: 95.7% for AGIs below $10k, 68.3% for AGIs $10k-25k, 82.2% for AGIs $25k-50k, 86.2% for AGIs $50k-75k, 91.7% for AGIs $75k-100k, 84.8% for AGIs over 100k)
Taxable interest for individuals: $750 (reported on 47.3% of returns)
This zip code:
$750
Pennsylvania:
$1,657
(% of AGI for various income ranges: 4.3% for AGIs below $10k, 1.5% for AGIs $10k-25k, 0.6% for AGIs $25k-50k, 1.5% for AGIs $50k-75k, 0.5% for AGIs $75k-100k, 0.2% for AGIs over 100k)
Taxable dividends: $698 (reported on 18.0% of returns)
Here:
$698
State:
$3,566
(% of AGI for various income ranges: 2.9% for AGIs below $10k, 0.3% for AGIs $10k-25k, 0.4% for AGIs $25k-50k, 0.2% for AGIs $50k-75k, 0.2% for AGIs $75k-100k, 0.5% for AGIs over 100k)
Profit/loss from business: +$8,174 (reported on 11.5% of returns)
Here:
+$8,174
State:
+$14,267
(% of AGI for various income ranges: 4.0% for AGIs below $10k, 6.2% for AGIs $10k-25k, 4.4% for AGIs $25k-50k, 1.9% for AGIs $50k-75k, 0.3% for AGIs $75k-100k)
IRA payment deduction: $3,208 (reported on 2.3% of returns)
15043:
$3,208
Pennsylvania:
$2,903
Total itemized deductions: $14,531 (21% of AGI, reported on 24.2% of returns)
Here:
$14,531
State:
$18,804
Here:
20.8% of AGI
State:
19.5% of AGI
(% of AGI for various income ranges: 2.9% for AGIs $10k-25k, 7.3% for AGIs $25k-50k, 10.7% for AGIs $50k-75k, 11.4% for AGIs $75k-100k, 12.6% for AGIs over 100k)
Charity contributions deductions: $1,793 (2% of AGI, reported on 21.2% of returns)
Here:
$1,793
State:
$3,337
Here:
2.5% of AGI
State:
3.3% of AGI
(% of AGI for various income ranges: 0.7% for AGIs $25k-50k, 1.1% for AGIs $50k-75k, 1.2% for AGIs $75k-100k, 1.9% for AGIs over 100k)
Total tax: $4,393 (reported on 75.1% of returns)
15043:
$4,393
State:
$8,008
(% of AGI for various income ranges: 2.4% for AGIs below $10k, 4.4% for AGIs $10k-25k, 6.7% for AGIs $25k-50k, 8.2% for AGIs $50k-75k, 9.9% for AGIs $75k-100k, 15.0% for AGIs over 100k)
Earned income credit: $1,626 (reported on 11.7% of returns)
Here:
$1,626
State:
$1,643
Percentage of individuals using paid preparers for their 2004 taxes: 59.4%
Here:
59%
State:
56%
(% for various income ranges: 54.0% for AGIs below $10k, 60.1% for AGIs $10k-25k, 63.4% for AGIs $25k-50k, 60.0% for AGIs $50k-75k, 60.0% for AGIs $75k-100k, 52.2% for AGIs over 100k)
Household received Food Stamps/SNAP in the past 12 months: 100 Household did not receive Food Stamps/SNAP in the past 12 months: 707
Women who had a birth in the past 12 months: 40 (7 now married, 28 unmarried) Women who did not have a birth in the past 12 months: 392 (191 now married, 200 unmarried)
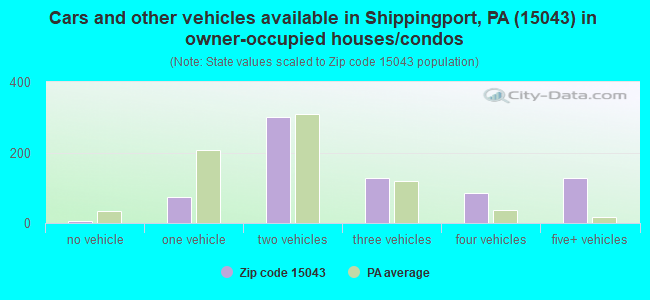
Housing units in zip code 15043 with a mortgage: 331 (29 second mortgage, 26 both second mortgage and home equity loan) Houses without a mortgage: 11
Median monthly owner costs for units with a mortgage: $1,542 Median monthly owner costs for units without a mortgage: $686
Residents with income below the poverty level in 2022:
This zip code:
9.9%
Whole state:
11.8%
Residents with income below 50% of the poverty level in 2022:
This zip code:
4.6%
Whole state:
6.1%
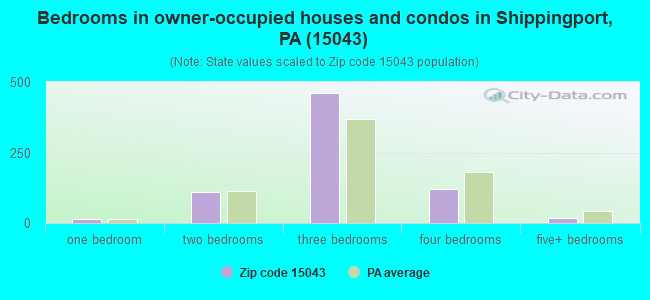
Median number of rooms in houses and condos:
Here:
6.3
State:
6.8
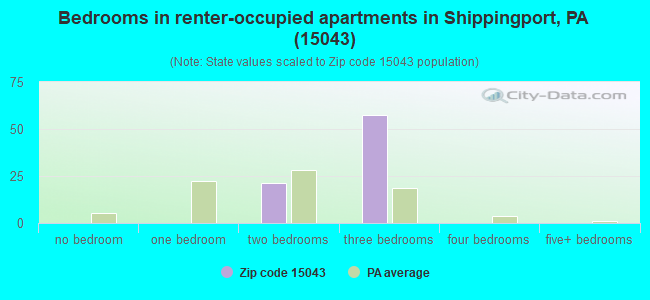
Median number of rooms in apartments:
Here:
5.0
State:
4.3
Notable locations in this zip code not listed on our city pages
Notable locations in zip code 15043: Neel Landing (A), Hookstown Grange (B), Hanover Township Volunteer Fire Department Station 68 - 2 (C). Display/hide their locations on the map
Churches in zip code 15043 include: Mill Creek Church (A), Free Methodist Church (B), Bethel Church (C), Tomlinson Run Church (D). Display/hide their locations on the map
Cemeteries: Tomlinson Run United Presbyterian Cemetery (1), Bethel Cemetery (2), Mill Creek Hill Cemetery (3), Georgetown Cemetery (4). Display/hide their locations on the map
In group quarters: 5 (-1 institutionalized population)
Size of family households: 365 2-persons, 105 3-persons, 124 4-persons, 45 5-persons, 12 6-persons, 3 7-or-more-persons
Size of nonfamily households: 120 1-person, 27 2-persons
305 married couples with children.
60 single-parent households (57 men, 3 women).
98.5% of residents of 15043 zip code speak English at home.
0.9% of residents speak Spanish at home (84% very well, 16% not at all).
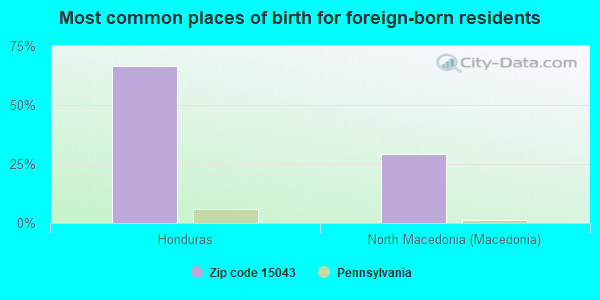
Foreign born population: 25 (1.1%) (87.9% of them are naturalized citizens)
This zip code:
1.1%
Whole state:
7.5%
67%Honduras
29%North Macedonia (Macedonia)
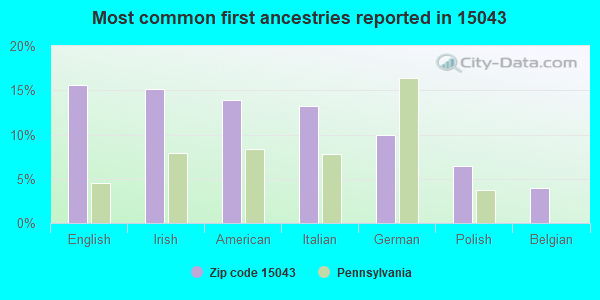
16%English
15%Irish
14%American
13%Italian
10%German
6%Polish
4%Belgian
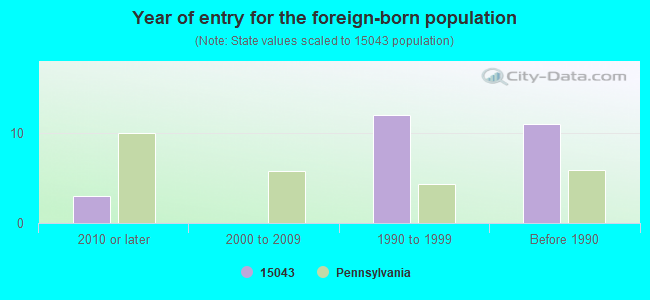
Year of entry for the foreign-born population
32010 or later
02000 to 2009
121990 to 1999
11Before 1990
Facilities with environmental interests located in this zip code:
C & C MARINE MAINT GEORGETOWN LANDING BARGE MOORING FAC (RIVER ST 5 MI FROM RT 168 NW in GEORGETOWN, PA)
STATE MASTER (Pennsylvania database) - PCS-PA0218219, National Pollutant Discharge Elimination System Permit, RCRIS-PAR000033514, HAZARDOUS WASTE PROGRAM National Pollutant Discharge Elimination System NON-MAJOR (Tracking pollutant discharge elimination systems) - permit Conditionally Exempt Small Quantity Generators, less than 100 kg/month of hazardous waste (Resource Conservation and Recovery Act (tracking hazardous waste)) - notification Business SIC classification: MARINE CARGO HANDLING Organizations: C&C MARINE MAINTENANCE CO (CONTACT/OWNER)
Alternative names: C & C MARINE MAINTENANCE CO, C & C MARINE MAINT CO GEORGETOWN LANDING BARGE MOORING FAC, C & C MARINE MAINTENANCE COMPA
Housing units lacking complete plumbing facilities: 1.1% Housing units lacking complete kitchen facilities: 1.1%
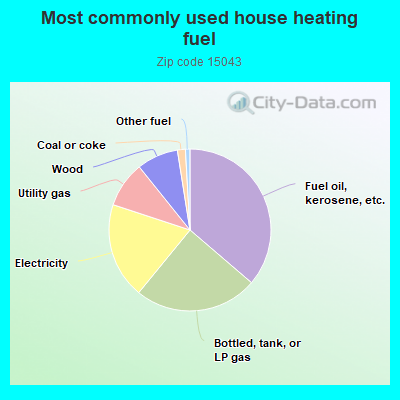
36.4%Fuel oil, kerosene, etc.
24.7%Bottled, tank, or LP gas
19.2%Electricity
9.2%Utility gas
8.3%Wood
1.6%Coal or coke
0.9%Other fuel
Population in 1990: 2,810.
Place of birth for U.S.-born residents:
This state: 1,567
Northeast: 34
Midwest: 438
South: 123
West: 11
70% of the 15043 zip code residents lived in the same house 5 years ago. Out of people who lived in different houses, 69% lived in this county. Out of people who lived in different counties, 50% lived in Pennsylvania.
94% of the 15043 zip code residents lived in the same house 1 year ago. Out of people who lived in different houses, 14% moved from this county. Out of people who lived in different houses, 84% moved from different county within same state. Out of people who lived in different houses, 2% moved from different state.
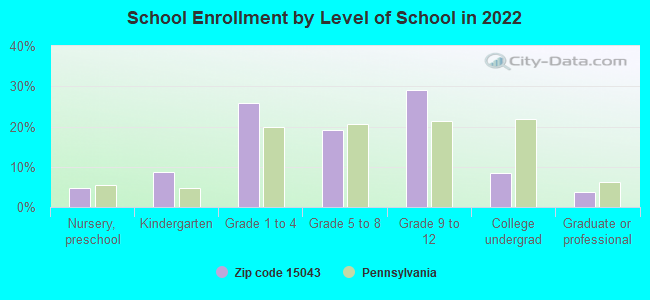
Private vs. public school enrollment:
Students in private schools in grades 1 to 8 (elementary and middle school):
Here:
0.0%
Pennsylvania:
15.7%
Students in private schools in grades 9 to 12 (high school): 9
Here:
8.6%
Pennsylvania:
13.4%
Students in private undergraduate colleges: 14
Here:
45.1%
Pennsylvania:
39.8%
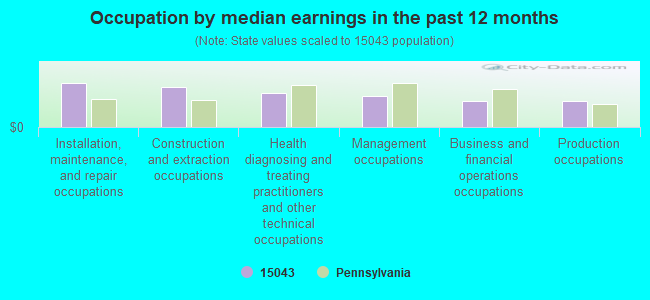
Occupation by median earnings in the past 12 months ($)
111,745Installation, maintenance, and repair occupations
101,260Construction and extraction occupations
87,616Health diagnosing and treating practitioners and other technical occupations
79,647Management occupations
67,209Business and financial operations occupations
64,831Production occupations
Top industries in this zip code by the number of employees in 2005:
Other Services (except Public Administration): Labor Unions and Similar Labor Organizations (20-49 employees: 1 establishment)
Real Estate and Rental and Leasing: General Rental Centers (20-49: 1)
Mining: Drilling Oil and Gas Wells (10-19: 1)
Mining: Construction Sand and Gravel Mining (10-19: 1)
Other Services (except Public Administration): Cemeteries and Crematories (5-9: 1)
Other Services (except Public Administration): Automotive Body, Paint, and Interior Repair and Maintenance (5-9: 1)
People in group quarters in 2010:
5 people in workers' group living quarters and job corps centers
Fatal accident statistics in 2011:
Fatal accident count: 2
Vehicles involved in fatal accidents: 4
Fatal accidents caused by drunken drivers: 1
Fatalities: 2
Persons involved in fatal accidents: 4
Pedestrians involved in fatal accidents: 0
Home Mortgage Disclosure Act Aggregated Statistics For Year 2009 (Based on 4 partial tracts)
A) FHA, FSA/RHS & VA Home Purchase Loans
B) Conventional Home Purchase Loans
C) Refinancings
D) Home Improvement Loans
E) Loans on Dwellings For 5+ Families
F) Non-occupant Loans on < 5 Family Dwellings (A B C & D)
G) Loans On Manufactured Home Dwelling (A B C & D)
Number
Average Value
Number
Average Value
Number
Average Value
Number
Average Value
Number
Average Value
Number
Average Value
Number
Average Value
LOANS ORIGINATED
12
$162,185
23
$135,594
110
$145,679
12
$84,345
1
$44,030
1
$36,830
3
$101,333
APPLICATIONS APPROVED, NOT ACCEPTED
1
$327,450
1
$17,610
10
$166,218
1
$8,810
0
$0
1
$17,610
0
$0
APPLICATIONS DENIED
3
$97,817
5
$106,324
46
$138,457
14
$29,043
0
$0
1
$8,010
11
$65,301
APPLICATIONS WITHDRAWN
2
$60,845
1
$16,010
34
$199,284
3
$43,037
0
$0
0
$0
3
$81,927
FILES CLOSED FOR INCOMPLETENESS
0
$0
0
$0
6
$155,758
0
$0
0
$0
0
$0
1
$39,900
Aggregated Statistics For Year 2008 (Based on 4 partial tracts)
A) FHA, FSA/RHS & VA Home Purchase Loans
B) Conventional Home Purchase Loans
C) Refinancings
D) Home Improvement Loans
F) Non-occupant Loans on < 5 Family Dwellings (A B C & D)
G) Loans On Manufactured Home Dwelling (A B C & D)
Number
Average Value
Number
Average Value
Number
Average Value
Number
Average Value
Number
Average Value
Number
Average Value
LOANS ORIGINATED
10
$134,686
26
$151,723
68
$114,779
25
$50,902
2
$146,110
9
$84,350
APPLICATIONS APPROVED, NOT ACCEPTED
1
$126,180
3
$83,297
12
$121,987
4
$38,208
1
$227,370
3
$83,607
APPLICATIONS DENIED
3
$78,243
15
$127,344
64
$145,256
9
$55,126
1
$9,280
16
$78,766
APPLICATIONS WITHDRAWN
2
$301,825
3
$148,383
22
$186,511
2
$62,845
0
$0
2
$96,470
FILES CLOSED FOR INCOMPLETENESS
0
$0
0
$0
4
$164,908
2
$99,275
0
$0
1
$16,010
Aggregated Statistics For Year 2007 (Based on 4 partial tracts)
A) FHA, FSA/RHS & VA Home Purchase Loans
B) Conventional Home Purchase Loans
C) Refinancings
D) Home Improvement Loans
F) Non-occupant Loans on < 5 Family Dwellings (A B C & D)
G) Loans On Manufactured Home Dwelling (A B C & D)
Number
Average Value
Number
Average Value
Number
Average Value
Number
Average Value
Number
Average Value
Number
Average Value
LOANS ORIGINATED
2
$100,475
44
$132,710
70
$108,641
26
$60,244
4
$80,488
9
$81,838
APPLICATIONS APPROVED, NOT ACCEPTED
0
$0
14
$83,774
21
$122,166
6
$63,960
3
$50,110
9
$52,183
APPLICATIONS DENIED
0
$0
14
$128,279
104
$108,138
24
$36,677
4
$65,778
19
$62,965
APPLICATIONS WITHDRAWN
0
$0
5
$174,090
30
$142,911
2
$6,005
0
$0
1
$96,070
FILES CLOSED FOR INCOMPLETENESS
1
$116,090
2
$180,135
11
$146,700
0
$0
1
$43,230
0
$0
Aggregated Statistics For Year 2006 (Based on 4 partial tracts)
A) FHA, FSA/RHS & VA Home Purchase Loans
B) Conventional Home Purchase Loans
C) Refinancings
D) Home Improvement Loans
F) Non-occupant Loans on < 5 Family Dwellings (A B C & D)
G) Loans On Manufactured Home Dwelling (A B C & D)
Number
Average Value
Number
Average Value
Number
Average Value
Number
Average Value
Number
Average Value
Number
Average Value
LOANS ORIGINATED
7
$182,461
73
$116,915
109
$98,445
42
$41,084
4
$60,845
18
$60,761
APPLICATIONS APPROVED, NOT ACCEPTED
0
$0
9
$55,347
20
$131,506
4
$16,042
2
$32,825
9
$47,066
APPLICATIONS DENIED
0
$0
22
$109,832
121
$142,019
25
$29,621
4
$58,958
19
$68,567
APPLICATIONS WITHDRAWN
0
$0
12
$111,036
55
$107,270
8
$37,136
2
$40,430
3
$66,977
FILES CLOSED FOR INCOMPLETENESS
0
$0
2
$80,810
14
$111,835
3
$45,720
1
$74,220
0
$0
Aggregated Statistics For Year 2005 (Based on 4 partial tracts)
A) FHA, FSA/RHS & VA Home Purchase Loans
B) Conventional Home Purchase Loans
C) Refinancings
D) Home Improvement Loans
F) Non-occupant Loans on < 5 Family Dwellings (A B C & D)
G) Loans On Manufactured Home Dwelling (A B C & D)
Number
Average Value
Number
Average Value
Number
Average Value
Number
Average Value
Number
Average Value
Number
Average Value
LOANS ORIGINATED
3
$139,480
57
$114,177
118
$124,244
27
$35,223
2
$20,875
17
$70,805
APPLICATIONS APPROVED, NOT ACCEPTED
2
$61,935
9
$76,936
24
$116,599
9
$56,416
1
$40,030
8
$58,382
APPLICATIONS DENIED
0
$0
26
$72,991
109
$132,030
33
$72,964
6
$22,683
29
$73,122
APPLICATIONS WITHDRAWN
0
$0
16
$105,888
65
$124,399
9
$168,161
2
$57,985
7
$58,441
FILES CLOSED FOR INCOMPLETENESS
0
$0
4
$168,125
8
$118,908
2
$120,890
0
$0
2
$46,835
Aggregated Statistics For Year 2004 (Based on 4 partial tracts)
A) FHA, FSA/RHS & VA Home Purchase Loans
B) Conventional Home Purchase Loans
C) Refinancings
D) Home Improvement Loans
F) Non-occupant Loans on < 5 Family Dwellings (A B C & D)
G) Loans On Manufactured Home Dwelling (A B C & D)
Number
Average Value
Number
Average Value
Number
Average Value
Number
Average Value
Number
Average Value
Number
Average Value
LOANS ORIGINATED
1
$161,440
53
$129,612
135
$107,996
42
$46,875
5
$62,696
10
$71,183
APPLICATIONS APPROVED, NOT ACCEPTED
0
$0
14
$87,092
29
$108,147
4
$22,685
2
$70,010
6
$37,607
APPLICATIONS DENIED
2
$71,050
27
$84,159
120
$127,814
16
$31,278
8
$53,834
28
$60,718
APPLICATIONS WITHDRAWN
0
$0
11
$121,655
61
$129,620
5
$86,714
0
$0
3
$60,030
FILES CLOSED FOR INCOMPLETENESS
0
$0
2
$106,080
32
$120,210
2
$22,240
0
$0
0
$0
Aggregated Statistics For Year 2003 (Based on 4 partial tracts)
A) FHA, FSA/RHS & VA Home Purchase Loans
B) Conventional Home Purchase Loans
C) Refinancings
D) Home Improvement Loans
F) Non-occupant Loans on < 5 Family Dwellings (A B C & D)
Number
Average Value
Number
Average Value
Number
Average Value
Number
Average Value
Number
Average Value
LOANS ORIGINATED
4
$152,538
56
$106,271
284
$108,574
28
$30,661
7
$58,674
APPLICATIONS APPROVED, NOT ACCEPTED
0
$0
7
$101,756
62
$119,703
9
$26,511
2
$119,690
APPLICATIONS DENIED
0
$0
21
$65,279
158
$109,631
16
$21,449
2
$86,465
APPLICATIONS WITHDRAWN
0
$0
11
$91,146
58
$113,237
4
$11,508
0
$0
FILES CLOSED FOR INCOMPLETENESS
0
$0
1
$80,060
13
$116,167
1
$16,010
1
$63,250
Aggregated Statistics For Year 2002 (Based on 4 partial tracts)
A) FHA, FSA/RHS & VA Home Purchase Loans
B) Conventional Home Purchase Loans
C) Refinancings
D) Home Improvement Loans
E) Loans on Dwellings For 5+ Families
F) Non-occupant Loans on < 5 Family Dwellings (A B C & D)
Number
Average Value
Number
Average Value
Number
Average Value
Number
Average Value
Number
Average Value
Number
Average Value
LOANS ORIGINATED
3
$70,407
52
$100,831
205
$100,154
20
$20,870
0
$0
4
$87,865
APPLICATIONS APPROVED, NOT ACCEPTED
1
$85,360
15
$75,867
38
$78,708
9
$47,102
0
$0
1
$41,630
APPLICATIONS DENIED
1
$74,460
41
$40,832
96
$98,919
12
$25,204
0
$0
2
$57,645
APPLICATIONS WITHDRAWN
0
$0
8
$92,299
58
$104,401
12
$24,957
1
$144,740
1
$64,050
FILES CLOSED FOR INCOMPLETENESS
1
$39,900
2
$121,690
24
$108,880
1
$46,430
0
$0
2
$52,440
Aggregated Statistics For Year 2001 (Based on 4 partial tracts)
A) FHA, FSA/RHS & VA Home Purchase Loans
B) Conventional Home Purchase Loans
C) Refinancings
D) Home Improvement Loans
F) Non-occupant Loans on < 5 Family Dwellings (A B C & D)
Number
Average Value
Number
Average Value
Number
Average Value
Number
Average Value
Number
Average Value
LOANS ORIGINATED
2
$109,680
60
$105,750
160
$93,319
31
$26,316
2
$27,370
APPLICATIONS APPROVED, NOT ACCEPTED
2
$68,050
14
$58,842
31
$86,751
9
$21,667
0
$0
APPLICATIONS DENIED
1
$73,300
45
$49,212
89
$80,929
23
$28,112
3
$146,583
APPLICATIONS WITHDRAWN
0
$0
5
$57,182
59
$99,430
7
$38,139
0
$0
FILES CLOSED FOR INCOMPLETENESS
1
$91,850
1
$32,020
17
$109,332
1
$102,990
0
$0
Aggregated Statistics For Year 2000 (Based on 4 partial tracts)
A) FHA, FSA/RHS & VA Home Purchase Loans
B) Conventional Home Purchase Loans
C) Refinancings
D) Home Improvement Loans
F) Non-occupant Loans on < 5 Family Dwellings (A B C & D)
Number
Average Value
Number
Average Value
Number
Average Value
Number
Average Value
Number
Average Value
LOANS ORIGINATED
8
$92,601
58
$83,429
96
$70,144
26
$27,262
3
$95,777
APPLICATIONS APPROVED, NOT ACCEPTED
3
$105,560
18
$43,830
31
$73,426
4
$10,685
0
$0
APPLICATIONS DENIED
3
$64,237
56
$41,359
89
$68,906
25
$14,308
5
$11,352
APPLICATIONS WITHDRAWN
0
$0
4
$53,580
32
$82,038
3
$29,963
1
$69,580
FILES CLOSED FOR INCOMPLETENESS
0
$0
2
$115,285
20
$104,256
1
$88,870
0
$0
Aggregated Statistics For Year 1999 (Based on 2 partial tracts)
A) FHA, FSA/RHS & VA Home Purchase Loans
B) Conventional Home Purchase Loans
C) Refinancings
D) Home Improvement Loans
F) Non-occupant Loans on < 5 Family Dwellings (A B C & D)

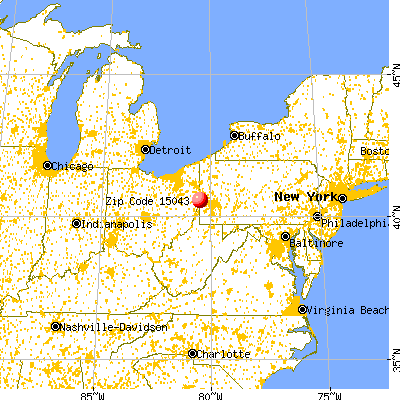


 Nearest zip codes: 15050, 26034, 26056, 15077, 26047, 15052.