Estimated zip code population in 2022: 6,025 Zip code population in 2010: 6,432 Zip code population in 2000: 6,816
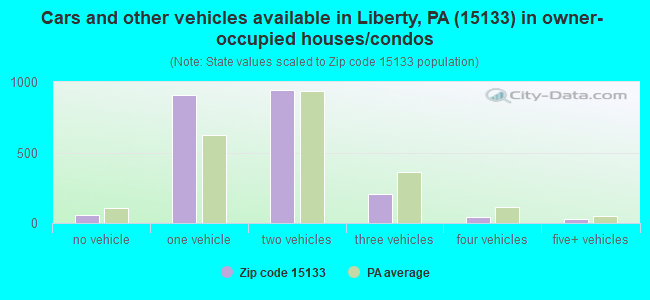
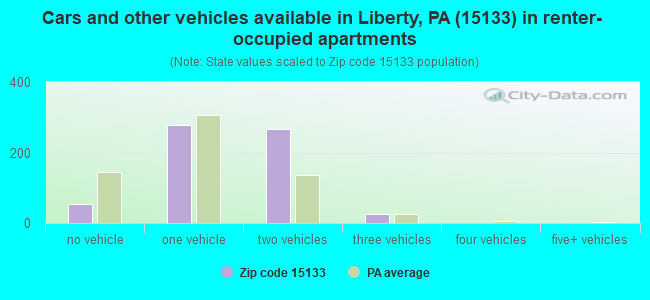
Houses and condos: 3,002 Renter-occupied apartments: 621
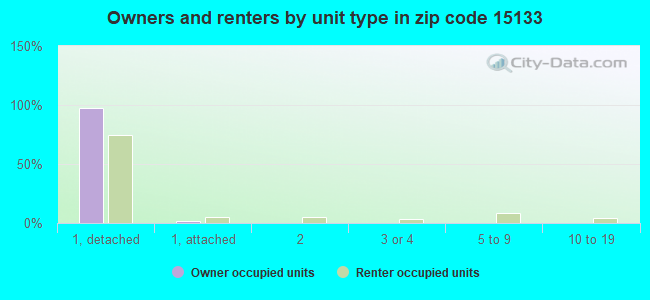
% of renters here:
22%
State:
31%
March 2022 cost of living index in zip code 15133: 91.8 (less than average, U.S. average is 100)
Land area: 3.0 sq. mi. Water area: 0.1 sq. mi.
Population density: 2,023 people per square mile
(low).
OSM Map
General Map
Google Map
MSN Map
OSM Map
General Map
Google Map
MSN Map
OSM Map
General Map
Google Map
MSN Map
OSM Map
General Map
Google Map
MSN Map
Please wait while loading the map...
Real estate property taxes paid for housing units in 2022:
This zip code:
1.5% ($1,430)
Pennsylvania:
1.3% ($3,094)
Median real estate property taxes paid for housing units with mortgages in 2022: $1,563 (1.6%) Median real estate property taxes paid for housing units with no mortgage in 2022: $1,355 (1.6%)
Business Search- 14 Million verified businesses
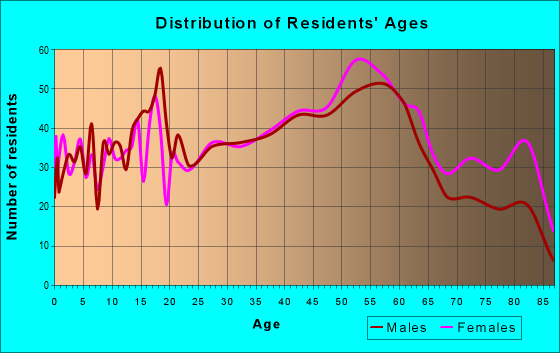
Males: 3,081
(51.1%)
Females: 2,943
(48.9%)
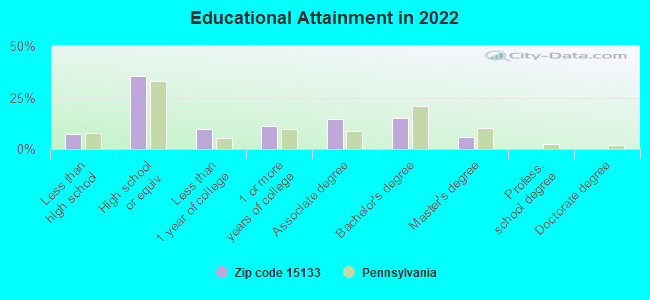
For population 25 years and over in 15133:
High school or higher: 91.9%
Bachelor's degree or higher: 21.4%
Graduate or professional degree: 6.4%
Unemployed: 7.1%
Mean travel time to work (commute): 30.2 minutes
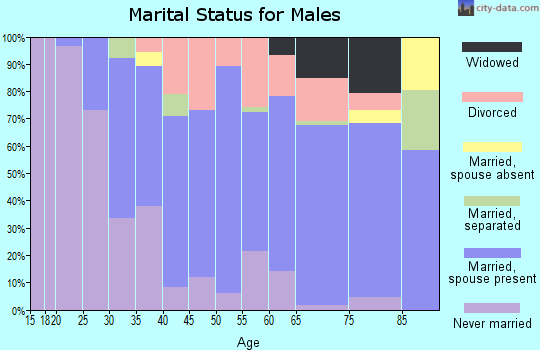
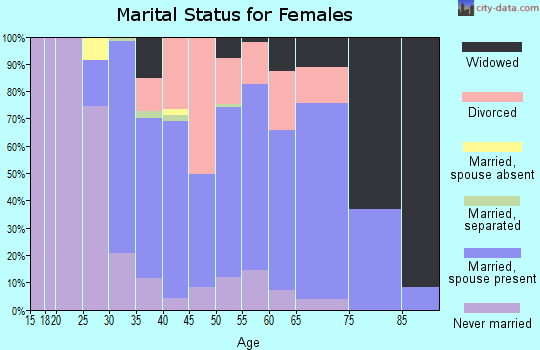
For population 15 years and over in 15133:
Never married: 31.9%
Now married: 48.9%
Separated: 2.4%
Widowed: 6.7%
Divorced: 10.1%
Zip code 15133 compared to state average:
Median house value significantly below state average.
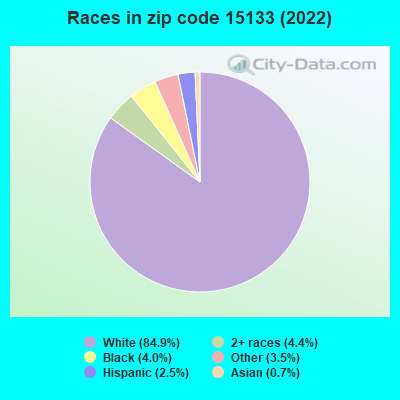
Black race population percentage below state average.
Hispanic race population percentage significantly below state average.
Median age above state average.
Foreign-born population percentage significantly below state average.
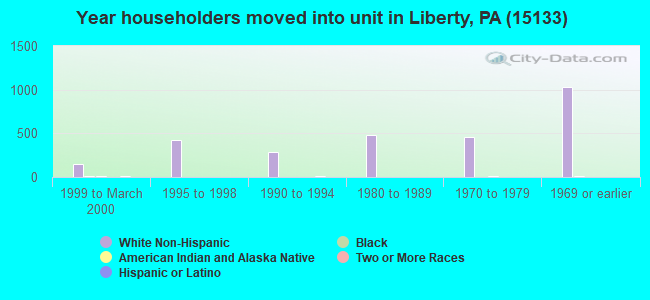
Length of stay since moving in significantly above state average.
Estimated median house/condo value in 2022: $94,532
15133:
$94,532
Pennsylvania:
$245,500
According to our research of Pennsylvania and other state lists, there were 8 registered sex offenders living in 15133 zip code as of April 27, 2024. The ratio of all residents to sex offenders in zip code 15133 is 801 to 1. The ratio of registered sex offenders to all residents in this zip code is lower than the state average.
Median resident age:
This zip code:
45.4 years
Pennsylvania median age:
40.9 years
Average household size:
This zip code:
2.1 people
Pennsylvania:
2.4 people
Averages for the 2020 tax year for zip code 15133, filed in 2021:
Average Adjusted Gross Income (AGI) in 2020: $49,299 (Individual Income Tax Returns)
Here:
$49,299
State:
$75,707
Salary/wage: $45,678 (reported on 81.7% of returns)
Here:
$45,678
State:
$62,806
(% of AGI for various income ranges: 902.0% for AGIs below $25k, 3277.2% for AGIs $25k-50k, 5994.5% for AGIs $50k-75k, 8647.5% for AGIs $75k-100k, 16629.5% for AGIs $100k-200k)
Taxable interest for individuals: $634 (reported on 22.6% of returns)
This zip code:
$634
Pennsylvania:
$1,633
(% of AGI for various income ranges: 13.2% for AGIs below $25k, 12.4% for AGIs $25k-50k, 20.9% for AGIs $50k-75k, 27.1% for AGIs $75k-100k, 44.5% for AGIs $100k-200k)
Ordinary dividends: $1,941 (reported on 12.5% of returns)
Here:
$1,941
State:
$7,382
(% of AGI for various income ranges: 17.3% for AGIs below $25k, 15.0% for AGIs $25k-50k, 46.1% for AGIs $50k-75k, 52.9% for AGIs $75k-100k, 86.4% for AGIs $100k-200k)
Net capital gain/loss in AGI: +$3,032 (reported on 9.5% of returns)
Here:
+$3,032
State:
+$23,522
(% of AGI for various income ranges: 2.0% for AGIs below $25k, 8.2% for AGIs $25k-50k, 39.8% for AGIs $50k-75k, 111.4% for AGIs $75k-100k, 166.8% for AGIs $100k-200k)
Profit/loss from business: +$8,630 (reported on 7.0% of returns)
Here:
+$8,630
State:
+$16,274
(% of AGI for various income ranges: 37.9% for AGIs below $25k, 56.5% for AGIs $25k-50k, 80.2% for AGIs $50k-75k, 21.8% for AGIs $75k-100k, 365.9% for AGIs $100k-200k)
Taxable individual retirement arrangement distribution: $11,428 (reported on 9.8% of returns)
15133:
$11,428
Pennsylvania:
$18,583
(% of AGI for various income ranges: 106.3% for AGIs below $25k, 63.9% for AGIs $25k-50k, 127.3% for AGIs $50k-75k, 234.3% for AGIs $75k-100k, 510.9% for AGIs $100k-200k)
Total itemized deductions: $26,667 (reported on 0.9% of returns)
Here:
$26,667
State:
$34,850
(% of AGI for various income ranges: 181.8% for AGIs $50k-75k)
Taxes paid: $6,600 (reported on 0.9% of returns)
15133:
$6,600
State:
$8,200
(% of AGI for various income ranges: 45.0% for AGIs $50k-75k)
Earned income credit: $1,877 (reported on 13.1% of returns)
Here:
$1,877
State:
$2,100
(% of AGI for various income ranges: 50.4% for AGIs below $25k, 51.0% for AGIs $25k-50k)
Percentage of individuals using paid preparers for their 2020 taxes: 92.7%
Here:
93%
State:
92%
(% for various income ranges: 91.9% for AGIs below $25k, 93.2% for AGIs $25k-50k, 92.9% for AGIs $50k-75k, 94.3% for AGIs $75k-100k, 91.4% for AGIs $100k-200k)
Averages for the 2012 tax year for zip code 15133, filed in 2013:
Average Adjusted Gross Income (AGI) in 2012: $41,182 (Individual Income Tax Returns)
Here:
$41,182
State:
$61,346
Salary/wage: $38,982 (reported on 83.5% of returns)
Here:
$38,982
State:
$51,902
(% of AGI for various income ranges: 69.0% for AGIs below $25k, 79.9% for AGIs $25k-50k, 82.5% for AGIs $50k-75k, 84.7% for AGIs $75k-100k, 74.7% for AGIs $100k-200k)
Taxable interest for individuals: $796 (reported on 29.2% of returns)
This zip code:
$796
Pennsylvania:
$1,588
(% of AGI for various income ranges: 1.5% for AGIs below $25k, 0.6% for AGIs $25k-50k, 0.4% for AGIs $50k-75k, 0.4% for AGIs $75k-100k, 0.3% for AGIs $100k-200k)
Ordinary dividends: $1,687 (reported on 15.9% of returns)
Here:
$1,687
State:
$5,827
(% of AGI for various income ranges: 1.3% for AGIs below $25k, 0.7% for AGIs $25k-50k, 0.5% for AGIs $50k-75k, 0.4% for AGIs $75k-100k, 0.6% for AGIs $100k-200k)
Net capital gain/loss in AGI: +$290 (reported on 8.6% of returns)
Here:
+$290
State:
+$14,495
(% of AGI for various income ranges: 0.2% for AGIs $100k-200k)
Profit/loss from business: +$8,450 (reported on 7.1% of returns)
Here:
+$8,450
State:
+$16,268
(% of AGI for various income ranges: 2.6% for AGIs below $25k, 1.1% for AGIs $25k-50k, 0.9% for AGIs $50k-75k, 1.4% for AGIs $75k-100k, 2.1% for AGIs $100k-200k)
Taxable individual retirement arrangement distribution: $8,579 (reported on 11.5% of returns)
15133:
$8,579
Pennsylvania:
$14,550
(% of AGI for various income ranges: 4.2% for AGIs below $25k, 2.0% for AGIs $25k-50k, 2.2% for AGIs $50k-75k, 1.9% for AGIs $75k-100k, 2.5% for AGIs $100k-200k)
Total itemized deductions: $15,598 (20% of AGI, reported on 13.3% of returns)
Here:
$15,598
State:
$23,538
Here:
19.7% of AGI
State:
18.4% of AGI
(% of AGI for various income ranges: 2.8% for AGIs below $25k, 3.3% for AGIs $25k-50k, 5.2% for AGIs $50k-75k, 5.0% for AGIs $75k-100k, 8.1% for AGIs $100k-200k)
Charity contributions: $1,903 (reported on 9.7% of returns)
Here:
$1,903
State:
$4,025
(% of AGI for various income ranges: 0.1% for AGIs below $25k, 0.2% for AGIs $25k-50k, 0.4% for AGIs $50k-75k, 0.7% for AGIs $75k-100k, 0.8% for AGIs $100k-200k)
Taxes paid: $5,231 (reported on 13.3% of returns)
15133:
$5,231
State:
$9,982
(% of AGI for various income ranges: 0.4% for AGIs below $25k, 0.9% for AGIs $25k-50k, 1.7% for AGIs $50k-75k, 1.8% for AGIs $75k-100k, 3.3% for AGIs $100k-200k)
Earned income credit: $1,943 (reported on 13.6% of returns)
Here:
$1,943
State:
$2,106
(% of AGI for various income ranges: 4.0% for AGIs below $25k, 0.7% for AGIs $25k-50k)
Percentage of individuals using paid preparers for their 2012 taxes: 45.4%
Here:
45%
State:
53%
(% for various income ranges: 43.1% for AGIs below $25k, 44.7% for AGIs $25k-50k, 46.7% for AGIs $50k-75k, 51.9% for AGIs $75k-100k, 52.4% for AGIs $100k-200k)
Averages for the 2004 tax year for zip code 15133, filed in 2005:
Average Adjusted Gross Income (AGI) in 2004: $33,579 (Individual Income Tax Returns)
Here:
$33,579
State:
$48,049
Salary/wage: $32,592 (reported on 83.2% of returns)
Here:
$32,592
State:
$42,646
(% of AGI for various income ranges: 66.3% for AGIs below $10k, 67.8% for AGIs $10k-25k, 83.1% for AGIs $25k-50k, 86.5% for AGIs $50k-75k, 86.8% for AGIs $75k-100k, 70.9% for AGIs over 100k)
Taxable interest for individuals: $1,408 (reported on 45.4% of returns)
This zip code:
$1,408
Pennsylvania:
$1,657
(% of AGI for various income ranges: 5.5% for AGIs below $10k, 3.0% for AGIs $10k-25k, 1.8% for AGIs $25k-50k, 1.0% for AGIs $50k-75k, 1.5% for AGIs $75k-100k, 2.8% for AGIs over 100k)
Taxable dividends: $1,190 (reported on 20.5% of returns)
Here:
$1,190
State:
$3,566
(% of AGI for various income ranges: 1.2% for AGIs below $10k, 1.3% for AGIs $10k-25k, 0.7% for AGIs $25k-50k, 0.4% for AGIs $50k-75k, 0.5% for AGIs $75k-100k, 1.1% for AGIs over 100k)
Net capital gain/loss: +$1,419 (reported on 12.0% of returns)
Here:
+$1,419
State:
+$9,716
(% of AGI for various income ranges: 1.1% for AGIs below $10k, 0.6% for AGIs $10k-25k, 0.1% for AGIs $25k-50k, 0.8% for AGIs $50k-75k, 0.5% for AGIs $75k-100k, 0.7% for AGIs over 100k)
Profit/loss from business: +$10,916 (reported on 7.2% of returns)
Here:
+$10,916
State:
+$14,267
(% of AGI for various income ranges: 4.1% for AGIs below $10k, 2.5% for AGIs $10k-25k, 1.4% for AGIs $25k-50k, 1.8% for AGIs $50k-75k, 1.2% for AGIs $75k-100k, 8.1% for AGIs over 100k)
IRA payment deduction: $2,431 (reported on 2.2% of returns)
15133:
$2,431
Pennsylvania:
$2,903
Total itemized deductions: $12,127 (21% of AGI, reported on 16.2% of returns)
Here:
$12,127
State:
$18,804
Here:
20.5% of AGI
State:
19.5% of AGI
(% of AGI for various income ranges: 3.4% for AGIs below $10k, 3.5% for AGIs $10k-25k, 5.3% for AGIs $25k-50k, 6.1% for AGIs $50k-75k, 7.9% for AGIs $75k-100k, 7.7% for AGIs over 100k)
Charity contributions deductions: $1,742 (3% of AGI, reported on 14.6% of returns)
Here:
$1,742
State:
$3,337
Here:
2.9% of AGI
State:
3.3% of AGI
(% of AGI for various income ranges: 0.5% for AGIs $10k-25k, 0.5% for AGIs $25k-50k, 0.8% for AGIs $50k-75k, 1.2% for AGIs $75k-100k, 1.4% for AGIs over 100k)
Total tax: $3,980 (reported on 73.1% of returns)
15133:
$3,980
State:
$8,008
(% of AGI for various income ranges: 1.4% for AGIs below $10k, 3.7% for AGIs $10k-25k, 7.0% for AGIs $25k-50k, 9.3% for AGIs $50k-75k, 11.2% for AGIs $75k-100k, 17.9% for AGIs over 100k)
Earned income credit: $1,525 (reported on 12.8% of returns)
Here:
$1,525
State:
$1,643
Percentage of individuals using paid preparers for their 2004 taxes: 46.8%
Here:
47%
State:
56%
(% for various income ranges: 37.3% for AGIs below $10k, 48.4% for AGIs $10k-25k, 48.7% for AGIs $25k-50k, 51.1% for AGIs $50k-75k, 49.2% for AGIs $75k-100k, 57.3% for AGIs over 100k)
Household received Food Stamps/SNAP in the past 12 months: 497 Household did not receive Food Stamps/SNAP in the past 12 months: 2,305
Women who had a birth in the past 12 months: 26 (9 now married, 14 unmarried) Women who did not have a birth in the past 12 months: 1,430 (622 now married, 805 unmarried)
Housing units in zip code 15133 with a mortgage: 1,104 (78 second mortgage, 74 both second mortgage and home equity loan) Houses without a mortgage: 190
Median monthly owner costs for units with a mortgage: $946 Median monthly owner costs for units without a mortgage: $426
Residents with income below the poverty level in 2022:
This zip code:
6.6%
Whole state:
11.8%
Residents with income below 50% of the poverty level in 2022:
This zip code:
3.8%
Whole state:
6.1%
Median number of rooms in houses and condos:
Here:
5.9
State:
6.8
Median number of rooms in apartments:
Here:
5.3
State:
4.3
Notable locations in this zip code not listed on our city pages
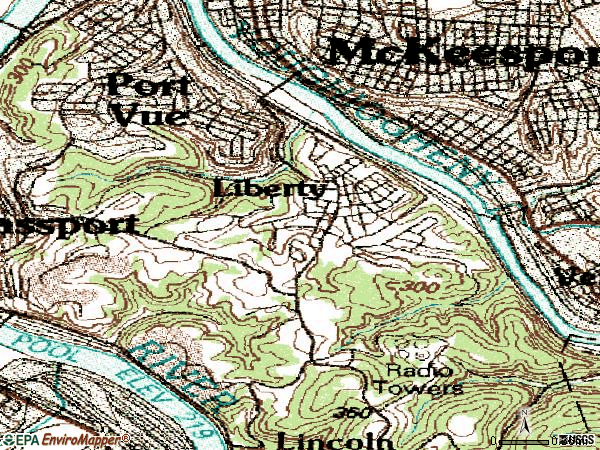
Notable locations in zip code 15133: Liberty Borough Hall (A), Port Vue Borough Hall (B), Port Vue Police Department (C), Professional Development and Learning Support Services (D), Sacred Heart Church Cemetery House (E), South Allegheny Middle-High School Library (F), Liberty Borough Volunteer Fire Department Station 183 (G), Vigilant Hose Company 1 Station 237 (H). Display/hide their locations on the map
In group quarters: 12 (-1 institutionalized population)
Size of family households: 961 2-persons, 416 3-persons, 239 4-persons, 54 5-persons, 10 6-persons, 18 7-or-more-persons
Size of nonfamily households: 860 1-person, 246 2-persons
523 married couples with children.
446 single-parent households (198 men, 248 women).
98.0% of residents of 15133 zip code speak English at home.
0.2% of residents speak Spanish at home (100% very well).
0.5% of residents speak other Indo-European language at home (100% very well).
0.5% of residents speak Asian or Pacific Island language at home (44% very well, 56% well).
0.1% of residents speak other language at home (100% very well).
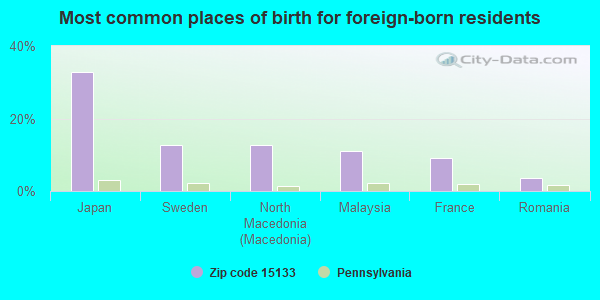
Foreign born population: 55 (0.9%) (66.9% of them are naturalized citizens)
This zip code:
0.9%
Whole state:
7.5%
33%Japan
13%Sweden
13%North Macedonia (Macedonia)
11%Malaysia
9%France
4%Romania
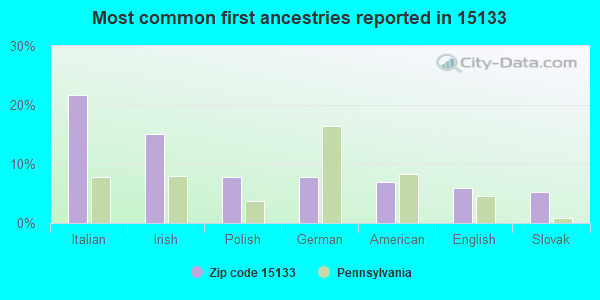
22%Italian
15%Irish
8%Polish
8%German
7%American
6%English
5%Slovak
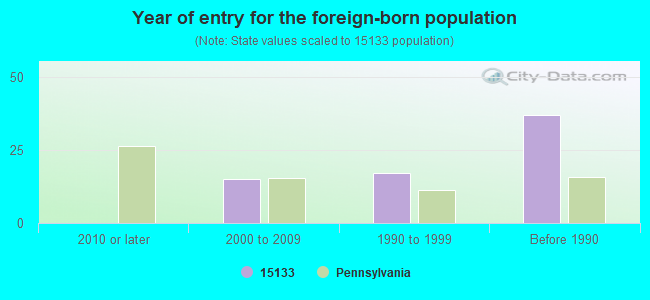
Year of entry for the foreign-born population
02010 or later
152000 to 2009
171990 to 1999
37Before 1990
Housing units lacking complete plumbing facilities: 2.6% Housing units lacking complete kitchen facilities: 2.6%
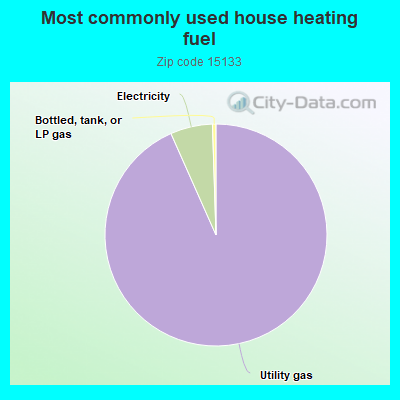
92.7%Utility gas
6.1%Electricity
0.5%Bottled, tank, or LP gas
Population in 1990: 7,385.
Place of birth for U.S.-born residents:
This state: 5,028
Northeast: 83
Midwest: 213
South: 479
West: 115
78% of the 15133 zip code residents lived in the same house 5 years ago. Out of people who lived in different houses, 85% lived in this county. Out of people who lived in different counties, 50% lived in Pennsylvania.
92% of the 15133 zip code residents lived in the same house 1 year ago. Out of people who lived in different houses, 85% moved from this county. Out of people who lived in different houses, 10% moved from different county within same state. Out of people who lived in different houses, 3% moved from abroad.
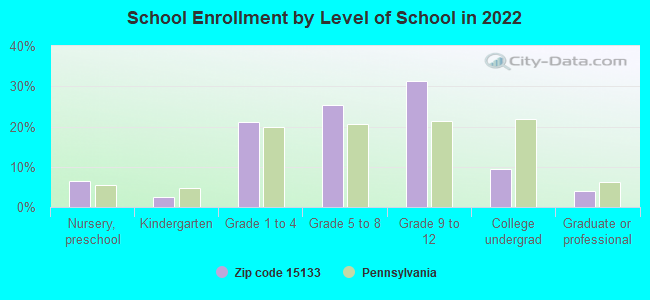
Private vs. public school enrollment:
Students in private schools in grades 1 to 8 (elementary and middle school): 20
Here:
3.9%
Pennsylvania:
15.7%
Students in private schools in grades 9 to 12 (high school): 10
Here:
3.0%
Pennsylvania:
13.4%
Students in private undergraduate colleges: 29
Here:
27.3%
Pennsylvania:
39.8%
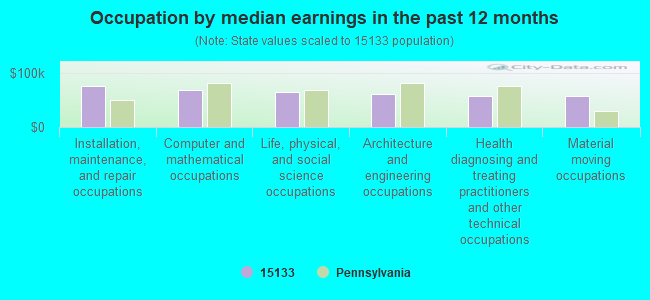
Occupation by median earnings in the past 12 months ($)
76,062Installation, maintenance, and repair occupations
68,222Computer and mathematical occupations
65,531Life, physical, and social science occupations
61,716Architecture and engineering occupations
58,287Health diagnosing and treating practitioners and other technical occupations
57,951Material moving occupations
Top industries in this zip code by the number of employees in 2005:
Other Services (except Public Administration): Religious Organizations (20-49 employees: 1 establishment, 10-19 employees: 2 establishments, 5-9 employees: 1 establishment)
Construction: Water and Sewer Line and Related Structures Construction (20-49: 1, 5-9: 1)
Accommodation and Food Services: Food Service Contractors (20-49: 1, 1-4: 1)
Administrative and Support and Waste Management and Remediation Services: Temporary Help Services (20-49: 1)
Accommodation and Food Services: Limited-Service Restaurants (10-19: 1, 1-4: 1)
Other Services (except Public Administration): Civic and Social Organizations (5-9: 2)
Finance and Insurance: Commercial Banking (5-9: 1, 1-4: 1)
Construction: Plumbing, Heating, and Air-Conditioning Contractors (5-9: 1, 1-4: 1)
People in group quarters in 2010:
27 people in nursing facilities/skilled-nursing facilities
People in group quarters in 2000:
16 people in nursing homes
10 people in homes for the mentally ill
2 people in religious group quarters
Home Mortgage Disclosure Act Aggregated Statistics For Year 2009 (Based on 6 partial tracts)
A) FHA, FSA/RHS & VA Home Purchase Loans
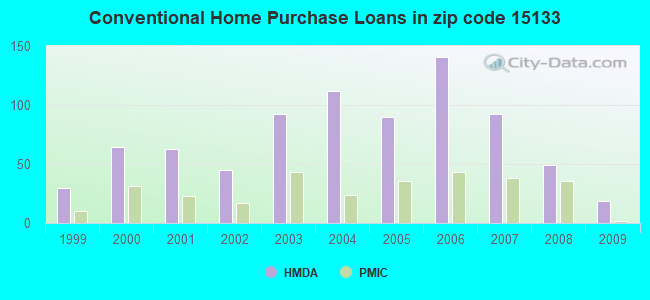
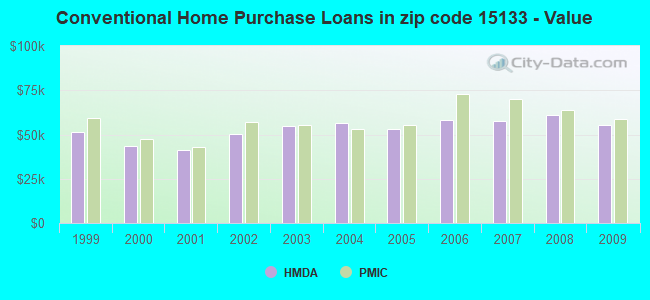
B) Conventional Home Purchase Loans
C) Refinancings
D) Home Improvement Loans
F) Non-occupant Loans on < 5 Family Dwellings (A B C & D)
Number
Average Value
Number
Average Value
Number
Average Value
Number
Average Value
Number
Average Value
LOANS ORIGINATED
76
$66,034
19
$55,195
83
$68,185
21
$25,717
10
$40,085
APPLICATIONS APPROVED, NOT ACCEPTED
0
$0
2
$52,150
12
$82,785
4
$21,045
2
$17,800
APPLICATIONS DENIED
8
$129,792
2
$34,135
71
$67,911
23
$25,904
2
$28,485
APPLICATIONS WITHDRAWN
4
$71,208
0
$0
40
$70,894
5
$56,450
0
$0
FILES CLOSED FOR INCOMPLETENESS
0
$0
2
$47,410
5
$60,170
0
$0
0
$0
Aggregated Statistics For Year 2008 (Based on 6 partial tracts)
A) FHA, FSA/RHS & VA Home Purchase Loans
B) Conventional Home Purchase Loans
C) Refinancings
D) Home Improvement Loans
E) Loans on Dwellings For 5+ Families
F) Non-occupant Loans on < 5 Family Dwellings (A B C & D)
G) Loans On Manufactured Home Dwelling (A B C & D)
Number
Average Value
Number
Average Value
Number
Average Value
Number
Average Value
Number
Average Value
Number
Average Value
Number
Average Value
LOANS ORIGINATED
50
$57,535
49
$60,813
94
$66,822
45
$31,403
4
$149,092
24
$42,012
0
$0
APPLICATIONS APPROVED, NOT ACCEPTED
2
$58,790
2
$80,595
16
$62,937
13
$33,295
0
$0
2
$80,595
2
$88,185
APPLICATIONS DENIED
4
$36,940
9
$60,922
116
$65,600
50
$35,207
0
$0
8
$42,166
0
$0
APPLICATIONS WITHDRAWN
2
$40,055
9
$60,942
34
$73,430
10
$14,818
0
$0
5
$44,662
0
$0
FILES CLOSED FOR INCOMPLETENESS
0
$0
0
$0
15
$66,262
9
$27,052
0
$0
2
$47,175
0
$0
Aggregated Statistics For Year 2007 (Based on 6 partial tracts)
A) FHA, FSA/RHS & VA Home Purchase Loans
B) Conventional Home Purchase Loans
C) Refinancings
D) Home Improvement Loans
F) Non-occupant Loans on < 5 Family Dwellings (A B C & D)
G) Loans On Manufactured Home Dwelling (A B C & D)
Number
Average Value
Number
Average Value
Number
Average Value
Number
Average Value
Number
Average Value
Number
Average Value
LOANS ORIGINATED
29
$70,460
92
$57,766
140
$60,134
58
$27,989
12
$49,908
0
$0
APPLICATIONS APPROVED, NOT ACCEPTED
4
$44,060
15
$62,227
26
$77,622
7
$25,830
0
$0
0
$0
APPLICATIONS DENIED
4
$70,762
18
$115,814
226
$64,216
66
$31,667
11
$50,946
2
$9,790
APPLICATIONS WITHDRAWN
0
$0
10
$69,863
47
$63,197
0
$0
0
$0
0
$0
FILES CLOSED FOR INCOMPLETENESS
0
$0
6
$46,197
11
$98,869
0
$0
2
$55,225
0
$0
Aggregated Statistics For Year 2006 (Based on 6 partial tracts)
A) FHA, FSA/RHS & VA Home Purchase Loans
B) Conventional Home Purchase Loans
C) Refinancings
D) Home Improvement Loans
E) Loans on Dwellings For 5+ Families
F) Non-occupant Loans on < 5 Family Dwellings (A B C & D)
G) Loans On Manufactured Home Dwelling (A B C & D)
Number
Average Value
Number
Average Value
Number
Average Value
Number
Average Value
Number
Average Value
Number
Average Value
Number
Average Value
LOANS ORIGINATED
30
$63,422
141
$58,050
174
$56,471
38
$15,680
2
$8,535
21
$46,409
0
$0
APPLICATIONS APPROVED, NOT ACCEPTED
0
$0
10
$52,786
43
$49,851
13
$19,335
0
$0
2
$45,130
2
$40,700
APPLICATIONS DENIED
0
$0
40
$67,632
207
$72,364
68
$22,501
0
$0
5
$46,998
3
$86,090
APPLICATIONS WITHDRAWN
0
$0
22
$53,425
83
$76,193
15
$49,309
0
$0
9
$42,922
0
$0
FILES CLOSED FOR INCOMPLETENESS
0
$0
8
$106,199
31
$77,155
0
$0
0
$0
2
$43,615
0
$0
Aggregated Statistics For Year 2005 (Based on 6 partial tracts)
A) FHA, FSA/RHS & VA Home Purchase Loans
B) Conventional Home Purchase Loans
C) Refinancings
D) Home Improvement Loans
E) Loans on Dwellings For 5+ Families
F) Non-occupant Loans on < 5 Family Dwellings (A B C & D)
G) Loans On Manufactured Home Dwelling (A B C & D)
Number
Average Value
Number
Average Value
Number
Average Value
Number
Average Value
Number
Average Value
Number
Average Value
Number
Average Value
LOANS ORIGINATED
21
$65,046
90
$53,290
229
$62,343
84
$26,015
0
$0
22
$62,990
0
$0
APPLICATIONS APPROVED, NOT ACCEPTED
0
$0
11
$50,079
49
$54,974
6
$26,688
0
$0
2
$24,035
0
$0
APPLICATIONS DENIED
2
$56,075
33
$50,051
291
$62,503
69
$21,879
2
$123,265
13
$34,301
2
$9,480
APPLICATIONS WITHDRAWN
0
$0
11
$62,329
78
$91,649
15
$116,589
0
$0
0
$0
0
$0
FILES CLOSED FOR INCOMPLETENESS
0
$0
5
$51,966
16
$79,369
4
$40,055
0
$0
0
$0
0
$0
Aggregated Statistics For Year 2004 (Based on 6 partial tracts)
A) FHA, FSA/RHS & VA Home Purchase Loans
B) Conventional Home Purchase Loans
C) Refinancings
D) Home Improvement Loans
E) Loans on Dwellings For 5+ Families
F) Non-occupant Loans on < 5 Family Dwellings (A B C & D)
G) Loans On Manufactured Home Dwelling (A B C & D)
Number
Average Value
Number
Average Value
Number
Average Value
Number
Average Value
Number
Average Value
Number
Average Value
Number
Average Value
LOANS ORIGINATED
40
$61,546
112
$56,751
280
$57,089
54
$20,113
0
$0
26
$38,216
5
$2,848
APPLICATIONS APPROVED, NOT ACCEPTED
0
$0
11
$81,238
53
$59,526
16
$17,891
0
$0
0
$0
0
$0
APPLICATIONS DENIED
4
$37,385
23
$53,527
292
$64,508
63
$22,184
0
$0
9
$36,443
2
$25,815
APPLICATIONS WITHDRAWN
2
$70,165
25
$55,595
145
$63,381
6
$48,448
2
$132,750
5
$67,896
0
$0
FILES CLOSED FOR INCOMPLETENESS
0
$0
4
$41,390
42
$74,023
4
$91,502
0
$0
0
$0
0
$0
Aggregated Statistics For Year 2003 (Based on 6 partial tracts)
A) FHA, FSA/RHS & VA Home Purchase Loans
B) Conventional Home Purchase Loans
C) Refinancings
D) Home Improvement Loans
F) Non-occupant Loans on < 5 Family Dwellings (A B C & D)
Number
Average Value
Number
Average Value
Number
Average Value
Number
Average Value
Number
Average Value
LOANS ORIGINATED
48
$64,805
92
$54,755
392
$57,053
82
$23,343
18
$40,437
APPLICATIONS APPROVED, NOT ACCEPTED
2
$77,750
6
$47,248
101
$55,184
10
$8,748
4
$21,808
APPLICATIONS DENIED
0
$0
24
$56,322
220
$67,272
44
$27,229
11
$46,054
APPLICATIONS WITHDRAWN
2
$60,525
4
$48,065
113
$69,573
9
$17,089
6
$35,593
FILES CLOSED FOR INCOMPLETENESS
0
$0
2
$86,285
23
$63,567
2
$40,055
0
$0
Aggregated Statistics For Year 2002 (Based on 6 partial tracts)
A) FHA, FSA/RHS & VA Home Purchase Loans
B) Conventional Home Purchase Loans
C) Refinancings
D) Home Improvement Loans
F) Non-occupant Loans on < 5 Family Dwellings (A B C & D)
Number
Average Value
Number
Average Value
Number
Average Value
Number
Average Value
Number
Average Value
LOANS ORIGINATED
49
$58,783
45
$50,444
339
$58,667
50
$22,301
19
$32,554
APPLICATIONS APPROVED, NOT ACCEPTED
4
$44,285
6
$58,747
121
$62,709
22
$15,968
2
$42,725
APPLICATIONS DENIED
0
$0
7
$24,157
265
$57,420
48
$16,710
2
$38,875
APPLICATIONS WITHDRAWN
4
$49,625
2
$8,010
161
$63,199
19
$11,611
0
$0
FILES CLOSED FOR INCOMPLETENESS
0
$0
2
$58,790
45
$55,229
2
$17,800
0
$0
Aggregated Statistics For Year 2001 (Based on 6 partial tracts)
A) FHA, FSA/RHS & VA Home Purchase Loans
B) Conventional Home Purchase Loans
C) Refinancings
D) Home Improvement Loans
F) Non-occupant Loans on < 5 Family Dwellings (A B C & D)
Number
Average Value
Number
Average Value
Number
Average Value
Number
Average Value
Number
Average Value
LOANS ORIGINATED
47
$54,040
63
$41,196
269
$49,124
93
$22,200
18
$24,727
APPLICATIONS APPROVED, NOT ACCEPTED
4
$38,838
14
$32,713
127
$51,133
26
$25,653
4
$24,922
APPLICATIONS DENIED
0
$0
24
$45,063
307
$53,374
92
$16,437
2
$11,570
APPLICATIONS WITHDRAWN
2
$24,925
15
$44,469
128
$51,592
11
$16,680
0
$0
FILES CLOSED FOR INCOMPLETENESS
0
$0
2
$38,275
17
$57,039
0
$0
0
$0
Aggregated Statistics For Year 2000 (Based on 6 partial tracts)
A) FHA, FSA/RHS & VA Home Purchase Loans
B) Conventional Home Purchase Loans
C) Refinancings
D) Home Improvement Loans
F) Non-occupant Loans on < 5 Family Dwellings (A B C & D)
Number
Average Value
Number
Average Value
Number
Average Value
Number
Average Value
Number
Average Value
LOANS ORIGINATED
46
$52,100
64
$43,650
179
$47,169
81
$17,388
9
$27,796
APPLICATIONS APPROVED, NOT ACCEPTED
0
$0
15
$39,073
90
$43,440
28
$16,875
4
$23,142
APPLICATIONS DENIED
0
$0
23
$53,653
217
$41,509
49
$14,592
5
$21,718
APPLICATIONS WITHDRAWN
2
$40,775
20
$39,342
74
$45,610
7
$37,650
0
$0
FILES CLOSED FOR INCOMPLETENESS
0
$0
6
$33,257
30
$37,687
0
$0
2
$25,815
Aggregated Statistics For Year 1999 (Based on 1 full and 2 partial tracts)
A) FHA, FSA/RHS & VA Home Purchase Loans
B) Conventional Home Purchase Loans
C) Refinancings
D) Home Improvement Loans
F) Non-occupant Loans on < 5 Family Dwellings (A B C & D)
2003 - 2018 National Fire Incident Reporting System (NFIRS) incidents
Based on the data from the years 2003 - 2018 the average number of fire incidents per year is 14. The highest number of fire incidents - 37 took place in 2018, and the least - 0 in 2012. The data has a rising trend.
When looking into fire subcategories, the most reports belonged to: Structure Fires (65.8%), and Other (13.2%).
Fire incident types reported to NFIRS in Zip Code 15133


 Nearest zip codes: 15045, 15132, 15034, 15122, 15110, 15135.


 Based on the data from the years 2003 - 2018 the average number of fire incidents per year is 14. The highest number of fire incidents - 37 took place in 2018, and the least - 0 in 2012. The data has a rising trend.
 When looking into fire subcategories, the most reports belonged to: Structure Fires (65.8%), and Other (13.2%).