Estimated zip code population in 2022: 23,024 Zip code population in 2010: 21,849 Zip code population in 2000: 22,537
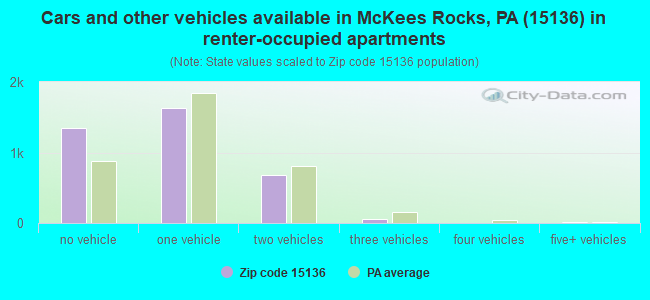
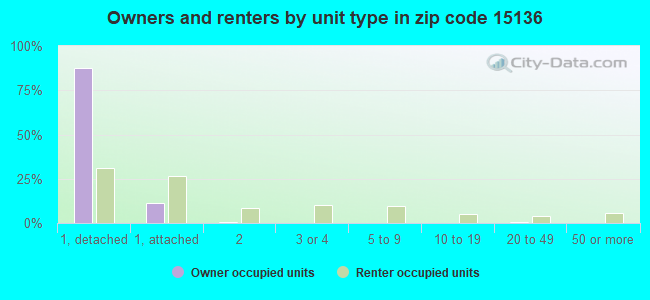
Houses and condos: 11,446 Renter-occupied apartments: 3,756
% of renters here:
36%
State:
31%
March 2022 cost of living index in zip code 15136: 93.8 (less than average, U.S. average is 100)
Land area: 11.1 sq. mi. Water area: 0.4 sq. mi.
Population density: 2,068 people per square mile
(low).
OSM Map
General Map
Google Map
MSN Map
OSM Map
General Map
Google Map
MSN Map
OSM Map
General Map
Google Map
MSN Map
OSM Map
General Map
Google Map
MSN Map
Please wait while loading the map...
Real estate property taxes paid for housing units in 2022:
This zip code:
1.6% ($2,888)
Pennsylvania:
1.3% ($3,094)
Median real estate property taxes paid for housing units with mortgages in 2022: $3,375 (1.5%) Median real estate property taxes paid for housing units with no mortgage in 2022: $2,167 (1.5%)
Averages for the 2020 tax year for zip code 15136, filed in 2021:
Average Adjusted Gross Income (AGI) in 2020: $63,778 (Individual Income Tax Returns)
Here:
$63,778
State:
$75,707
Salary/wage: $54,462 (reported on 81.9% of returns)
Here:
$54,462
State:
$62,806
(% of AGI for various income ranges: 937.4% for AGIs below $25k, 3297.7% for AGIs $25k-50k, 6224.4% for AGIs $50k-75k, 9025.7% for AGIs $75k-100k, 16777.8% for AGIs $100k-200k, 67872.5% for AGIs over 200k)
Taxable interest for individuals: $1,083 (reported on 28.1% of returns)
This zip code:
$1,083
Pennsylvania:
$1,633
(% of AGI for various income ranges: 14.3% for AGIs below $25k, 15.4% for AGIs $25k-50k, 37.1% for AGIs $50k-75k, 60.9% for AGIs $75k-100k, 89.1% for AGIs $100k-200k, 636.2% for AGIs over 200k)
Ordinary dividends: $3,634 (reported on 19.2% of returns)
Here:
$3,634
State:
$7,382
(% of AGI for various income ranges: 17.5% for AGIs below $25k, 28.1% for AGIs $25k-50k, 78.5% for AGIs $50k-75k, 147.4% for AGIs $75k-100k, 258.2% for AGIs $100k-200k, 1520.0% for AGIs over 200k)
Net capital gain/loss in AGI: +$11,900 (reported on 15.7% of returns)
Here:
+$11,900
State:
+$23,522
(% of AGI for various income ranges: 8.6% for AGIs below $25k, 25.7% for AGIs $25k-50k, 80.3% for AGIs $50k-75k, 160.6% for AGIs $75k-100k, 507.0% for AGIs $100k-200k, 8616.2% for AGIs over 200k)
Profit/loss from business: +$14,861 (reported on 10.3% of returns)
Here:
+$14,861
State:
+$16,274
(% of AGI for various income ranges: 58.4% for AGIs below $25k, 58.0% for AGIs $25k-50k, 139.3% for AGIs $50k-75k, 227.4% for AGIs $75k-100k, 499.8% for AGIs $100k-200k, 4078.8% for AGIs over 200k)
Taxable individual retirement arrangement distribution: $16,169 (reported on 10.4% of returns)
15136:
$16,169
Pennsylvania:
$18,583
(% of AGI for various income ranges: 65.1% for AGIs below $25k, 97.0% for AGIs $25k-50k, 237.4% for AGIs $50k-75k, 386.2% for AGIs $75k-100k, 667.1% for AGIs $100k-200k, 1991.9% for AGIs over 200k)
Self-employed (Keogh) retirement plans: $20,625 (reported on 0.3% of returns)
15136:
$20,625
Pennsylvania:
$25,407
(% of AGI for various income ranges: 515.6% for AGIs over 200k)
Total itemized deductions: $28,825 (reported on 4.8% of returns)
Here:
$28,825
State:
$34,850
(% of AGI for various income ranges: 22.9% for AGIs below $25k, 29.8% for AGIs $25k-50k, 129.9% for AGIs $50k-75k, 281.0% for AGIs $75k-100k, 498.4% for AGIs $100k-200k, 3956.9% for AGIs over 200k)
Charity contributions: $6,991 (reported on 3.8% of returns)
Here:
$6,991
State:
$12,392
(% of AGI for various income ranges: 2.7% for AGIs $25k-50k, 17.6% for AGIs $50k-75k, 29.6% for AGIs $75k-100k, 108.2% for AGIs $100k-200k, 950.6% for AGIs over 200k)
Taxes paid: $8,146 (reported on 4.8% of returns)
15136:
$8,146
State:
$8,200
(% of AGI for various income ranges: 2.8% for AGIs below $25k, 7.5% for AGIs $25k-50k, 42.7% for AGIs $50k-75k, 93.7% for AGIs $75k-100k, 173.8% for AGIs $100k-200k, 890.6% for AGIs over 200k)
Earned income credit: $2,145 (reported on 16.9% of returns)
Here:
$2,145
State:
$2,100
(% of AGI for various income ranges: 87.2% for AGIs below $25k, 67.2% for AGIs $25k-50k)
Percentage of individuals using paid preparers for their 2020 taxes: 92.6%
Here:
93%
State:
92%
(% for various income ranges: 91.5% for AGIs below $25k, 94.9% for AGIs $25k-50k, 91.8% for AGIs $50k-75k, 91.8% for AGIs $75k-100k, 91.9% for AGIs $100k-200k, 93.8% for AGIs over 200k)
Averages for the 2012 tax year for zip code 15136, filed in 2013:
Average Adjusted Gross Income (AGI) in 2012: $46,094 (Individual Income Tax Returns)
Here:
$46,094
State:
$61,346
Salary/wage: $42,114 (reported on 84.8% of returns)
Here:
$42,114
State:
$51,902
(% of AGI for various income ranges: 75.0% for AGIs below $25k, 80.4% for AGIs $25k-50k, 75.1% for AGIs $50k-75k, 79.2% for AGIs $75k-100k, 81.6% for AGIs $100k-200k, 68.2% for AGIs over 200k)
Taxable interest for individuals: $934 (reported on 31.1% of returns)
This zip code:
$934
Pennsylvania:
$1,588
(% of AGI for various income ranges: 1.1% for AGIs below $25k, 0.7% for AGIs $25k-50k, 0.6% for AGIs $50k-75k, 0.5% for AGIs $75k-100k, 0.6% for AGIs $100k-200k, 0.4% for AGIs over 200k)
Ordinary dividends: $2,854 (reported on 20.1% of returns)
Here:
$2,854
State:
$5,827
(% of AGI for various income ranges: 1.4% for AGIs below $25k, 0.8% for AGIs $25k-50k, 0.9% for AGIs $50k-75k, 1.0% for AGIs $75k-100k, 1.2% for AGIs $100k-200k, 2.6% for AGIs over 200k)
Net capital gain/loss in AGI: +$3,567 (reported on 12.8% of returns)
Here:
+$3,567
State:
+$14,495
(% of AGI for various income ranges: 0.3% for AGIs $25k-50k, 0.4% for AGIs $50k-75k, 0.6% for AGIs $75k-100k, 1.1% for AGIs $100k-200k, 3.9% for AGIs over 200k)
Profit/loss from business: +$13,904 (reported on 9.5% of returns)
Here:
+$13,904
State:
+$16,268
(% of AGI for various income ranges: 4.9% for AGIs below $25k, 1.8% for AGIs $25k-50k, 2.1% for AGIs $50k-75k, 1.7% for AGIs $75k-100k, 2.5% for AGIs $100k-200k, 5.5% for AGIs over 200k)
Taxable individual retirement arrangement distribution: $11,358 (reported on 10.5% of returns)
15136:
$11,358
Pennsylvania:
$14,550
(% of AGI for various income ranges: 3.5% for AGIs below $25k, 2.4% for AGIs $25k-50k, 3.1% for AGIs $50k-75k, 2.9% for AGIs $75k-100k, 2.3% for AGIs $100k-200k, 1.6% for AGIs over 200k)
Self-employment retirement plans: $21,400 (reported on 0.4% of returns)
15136:
$21,400
Pennsylvania:
$20,922
Total itemized deductions: $18,648 (18% of AGI, reported on 22.5% of returns)
Here:
$18,648
State:
$23,538
Here:
18.2% of AGI
State:
18.4% of AGI
(% of AGI for various income ranges: 4.2% for AGIs below $25k, 6.0% for AGIs $25k-50k, 7.9% for AGIs $50k-75k, 10.3% for AGIs $75k-100k, 12.2% for AGIs $100k-200k, 11.7% for AGIs over 200k)
Charity contributions: $2,492 (reported on 18.7% of returns)
Here:
$2,492
State:
$4,025
(% of AGI for various income ranges: 0.2% for AGIs below $25k, 0.5% for AGIs $25k-50k, 0.8% for AGIs $50k-75k, 1.1% for AGIs $75k-100k, 1.5% for AGIs $100k-200k, 1.5% for AGIs over 200k)
Taxes paid: $8,224 (reported on 22.4% of returns)
15136:
$8,224
State:
$9,982
(% of AGI for various income ranges: 1.0% for AGIs below $25k, 1.9% for AGIs $25k-50k, 3.0% for AGIs $50k-75k, 4.4% for AGIs $75k-100k, 6.1% for AGIs $100k-200k, 6.0% for AGIs over 200k)
Earned income credit: $2,158 (reported on 19.8% of returns)
Here:
$2,158
State:
$2,106
(% of AGI for various income ranges: 6.7% for AGIs below $25k, 0.8% for AGIs $25k-50k)
Percentage of individuals using paid preparers for their 2012 taxes: 44.7%
Here:
45%
State:
53%
(% for various income ranges: 42.5% for AGIs below $25k, 40.7% for AGIs $25k-50k, 50.0% for AGIs $50k-75k, 46.4% for AGIs $75k-100k, 51.9% for AGIs $100k-200k, 72.7% for AGIs over 200k)
Averages for the 2004 tax year for zip code 15136, filed in 2005:
Average Adjusted Gross Income (AGI) in 2004: $38,629 (Individual Income Tax Returns)
Here:
$38,629
State:
$48,049
Salary/wage: $37,037 (reported on 82.7% of returns)
Here:
$37,037
State:
$42,646
(% of AGI for various income ranges: 84.2% for AGIs below $10k, 71.7% for AGIs $10k-25k, 79.7% for AGIs $25k-50k, 81.9% for AGIs $50k-75k, 85.6% for AGIs $75k-100k, 76.4% for AGIs over 100k)
Taxable interest for individuals: $1,658 (reported on 47.1% of returns)
This zip code:
$1,658
Pennsylvania:
$1,657
(% of AGI for various income ranges: 5.3% for AGIs below $10k, 3.3% for AGIs $10k-25k, 2.0% for AGIs $25k-50k, 1.8% for AGIs $50k-75k, 1.0% for AGIs $75k-100k, 1.9% for AGIs over 100k)
Taxable dividends: $1,610 (reported on 26.3% of returns)
Here:
$1,610
State:
$3,566
(% of AGI for various income ranges: 2.8% for AGIs below $10k, 1.3% for AGIs $10k-25k, 1.0% for AGIs $25k-50k, 1.0% for AGIs $50k-75k, 0.8% for AGIs $75k-100k, 1.2% for AGIs over 100k)
Net capital gain/loss: +$2,562 (reported on 18.4% of returns)
Here:
+$2,562
State:
+$9,716
(% of AGI for various income ranges: -1.4% for AGIs below $10k, 0.3% for AGIs $10k-25k, 0.5% for AGIs $25k-50k, 0.2% for AGIs $50k-75k, 0.7% for AGIs $75k-100k, 3.4% for AGIs over 100k)
Profit/loss from business: +$13,654 (reported on 9.4% of returns)
Here:
+$13,654
State:
+$14,267
(% of AGI for various income ranges: 4.7% for AGIs below $10k, 3.9% for AGIs $10k-25k, 2.7% for AGIs $25k-50k, 2.5% for AGIs $50k-75k, 2.1% for AGIs $75k-100k, 4.8% for AGIs over 100k)
IRA payment deduction: $2,845 (reported on 2.8% of returns)
15136:
$2,845
Pennsylvania:
$2,903
(% of AGI for various income ranges: 0.3% for AGIs below $10k, 0.2% for AGIs $10k-25k, 0.3% for AGIs $25k-50k, 0.2% for AGIs $50k-75k, 0.2% for AGIs $75k-100k, 0.1% for AGIs over 100k)
Self-employed pension: $11,302 (reported on 0.4% of returns)
Here:
$11,302
Pennsylvania:
$14,674
Total itemized deductions: $15,647 (20% of AGI, reported on 25.0% of returns)
Here:
$15,647
State:
$18,804
Here:
19.8% of AGI
State:
19.5% of AGI
(% of AGI for various income ranges: 5.6% for AGIs below $10k, 4.9% for AGIs $10k-25k, 7.8% for AGIs $25k-50k, 10.8% for AGIs $50k-75k, 13.0% for AGIs $75k-100k, 12.6% for AGIs over 100k)
Charity contributions deductions: $1,983 (2% of AGI, reported on 22.4% of returns)
Here:
$1,983
State:
$3,337
Here:
2.4% of AGI
State:
3.3% of AGI
(% of AGI for various income ranges: 0.3% for AGIs below $10k, 0.4% for AGIs $10k-25k, 0.8% for AGIs $25k-50k, 1.1% for AGIs $50k-75k, 1.5% for AGIs $75k-100k, 1.7% for AGIs over 100k)
Total tax: $5,476 (reported on 74.0% of returns)
15136:
$5,476
State:
$8,008
(% of AGI for various income ranges: 1.8% for AGIs below $10k, 4.1% for AGIs $10k-25k, 7.6% for AGIs $25k-50k, 9.4% for AGIs $50k-75k, 10.4% for AGIs $75k-100k, 17.3% for AGIs over 100k)
Earned income credit: $1,674 (reported on 15.1% of returns)
Here:
$1,674
State:
$1,643
Percentage of individuals using paid preparers for their 2004 taxes: 49.2%
Here:
49%
State:
56%
(% for various income ranges: 44.5% for AGIs below $10k, 50.7% for AGIs $10k-25k, 49.3% for AGIs $25k-50k, 49.8% for AGIs $50k-75k, 51.3% for AGIs $75k-100k, 55.1% for AGIs over 100k)
Likely homosexual households (counted as self-reported same-sex unmarried-partner households)
Lesbian couples: 0.2% of all households
Gay men: 0.2% of all households
Household received Food Stamps/SNAP in the past 12 months: 2,706 Household did not receive Food Stamps/SNAP in the past 12 months: 7,740
Women who had a birth in the past 12 months: 361 (228 now married, 127 unmarried) Women who did not have a birth in the past 12 months: 4,542 (1,466 now married, 3,087 unmarried)
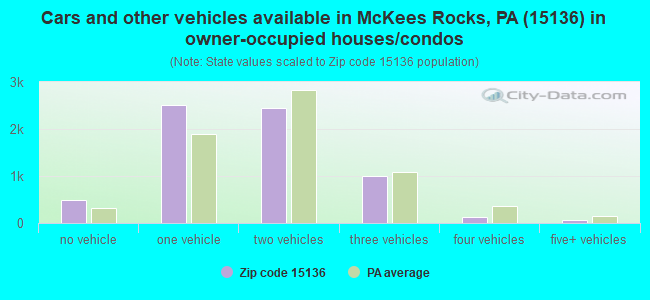
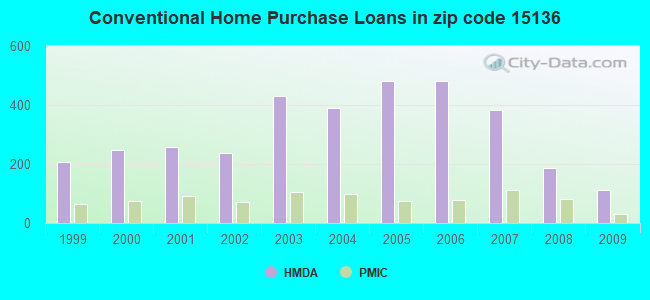
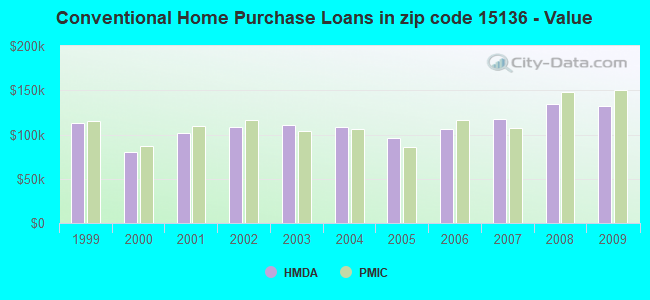
Housing units in zip code 15136 with a mortgage: 3,489 (413 second mortgage, 394 both second mortgage and home equity loan) Houses without a mortgage: 306
Median monthly owner costs for units with a mortgage: $1,437 Median monthly owner costs for units without a mortgage: $505
Residents with income below the poverty level in 2022:
This zip code:
17.1%
Whole state:
11.8%
Residents with income below 50% of the poverty level in 2022:
This zip code:
5.6%
Whole state:
6.1%
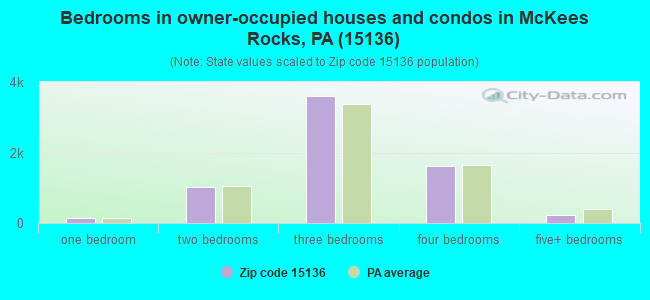
Median number of rooms in houses and condos:
Here:
6.6
State:
6.8
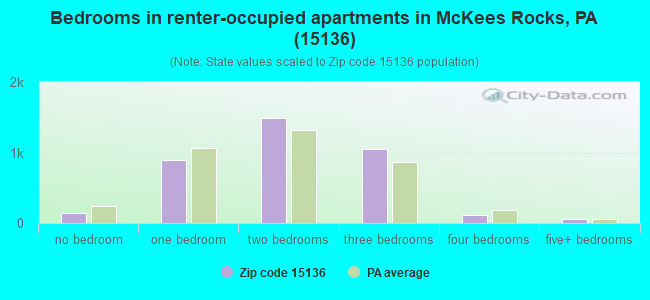
Median number of rooms in apartments:
Here:
4.6
State:
4.3
Notable locations in this zip code not listed on our city pages
Notable locations in zip code 15136: Bradley Center (A), McKees Rocks Borough Hall (B), McKees Rocks Police Department (C), Mormon Missionaries Home (D), Ms Idas Day Care Center (E), Robinson Township Hall (F), Robinson Township Police Department (G), Stowe Township Volunteer Fire Department Station 277 Preston (H), Robinson Township Fire Department (I), McKees Rocks Independent Volunteer Fire Department Station 189 (J), McKees Rocks Station (K), North McKees Rocks Station (L), Stowe Township Volunteer Fire Department Station 276 West Park (M), Stowe Township Volunteer Fire Department Station 275 Fleming Park (N), Moon Run Volunteer Fire Department Station 245 (O), Kennedy Township Independent Volunteer Fire Company Station 181 (P). Display/hide their locations on the map
Churches in zip code 15136 include: Union United Church (A), Holy Ghost Byzantine Catholic Church (B), Union Presbyterian Church of Robinson Township (C), Saint Marys Ukrainian Orthodox Church (D), Saint Andrew the Apostle Romanian Orthodox Church (E), Moon Run United Presbyterian Church (F), Good Shepherd Lutheran Church (G), First Baptist Church of McKees Rocks (H), Kennedy First Alliance Church (I). Display/hide their locations on the map
Cemeteries: Beth Hamedrash Hagodal Cemetery (1), Saint Marks Cemetery (2), Saint Marys Cemetery (3), Mount Calvary Cemetery (4), Saint Marys Greek Cemetery (5), Polish Cemetery (6). Display/hide their locations on the map
2,065 married couples with children.
2,354 single-parent households (384 men, 1,970 women).
95.4% of residents of 15136 zip code speak English at home.
1.1% of residents speak Spanish at home (92% very well, 8% well).
1.5% of residents speak other Indo-European language at home (81% very well, 3% well, 12% not well, 4% not at all).
0.5% of residents speak Asian or Pacific Island language at home (39% very well, 39% well, 22% not well).
0.9% of residents speak other language at home (58% very well, 42% well).
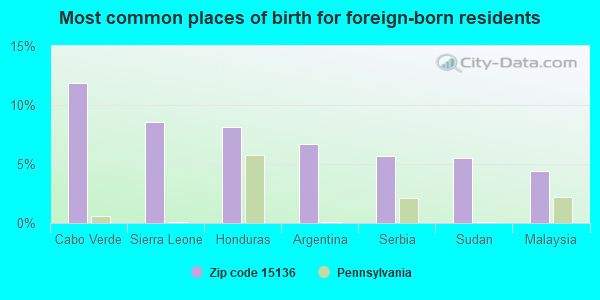
Foreign born population: 827 (3.6%) (39.1% of them are naturalized citizens)
This zip code:
3.6%
Whole state:
7.5%
12%Cabo Verde
9%Sierra Leone
8%Honduras
7%Argentina
6%Serbia
6%Sudan
4%Malaysia
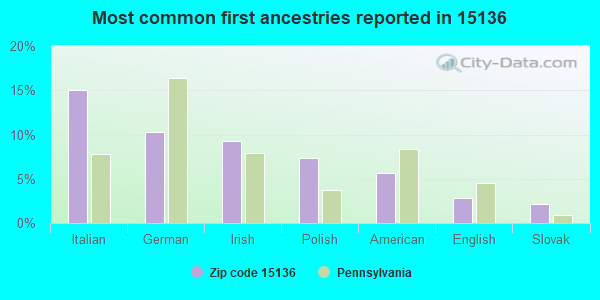
15%Italian
10%German
9%Irish
7%Polish
6%American
3%English
2%Slovak
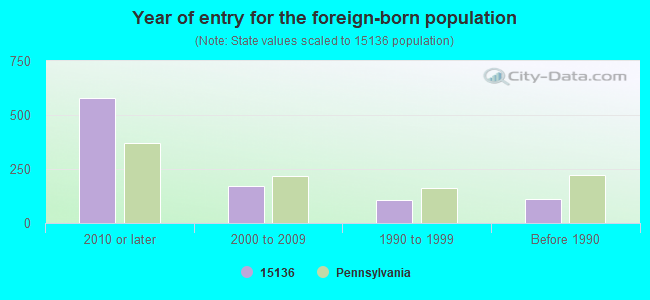
Year of entry for the foreign-born population
5802010 or later
1712000 to 2009
1081990 to 1999
111Before 1990
Facilities with environmental interests located in this zip code:
ATLANTIC 0364 1107 (821 CHARTIES AVENUE in MCKEES ROCKS, PA)
STATE MASTER (Pennsylvania database) - RCRIS-PAD987339058, HAZARDOUS WASTE PROGRAM Conditionally Exempt Small Quantity Generators, less than 100 kg/month of hazardous waste (Resource Conservation and Recovery Act (tracking hazardous waste)) - notification Organizations: OPERNAME (CONTACT/OPERATOR)
, ATLANTIC REFINING & MARKETING (CONTACT/OWNER)
, ATLANTIC REFINING & MARKETING CORPORATION (CONTACT/OWNER)
Alternative names: ATLANTIC SERVICE STATION
A STUCKI MFG (CHAMBERS ST in MCKEES ROCKS, PA)
STATE MASTER (Pennsylvania database) - RCRIS-PAD094212156, HAZARDOUS WASTE PROGRAM Conditionally Exempt Small Quantity Generators, less than 100 kg/month of hazardous waste (Resource Conservation and Recovery Act (tracking hazardous waste)) - notification Organizations: OPERNAME (CONTACT/OPERATOR)
, OWNERNAME (CONTACT/OWNER)
Alternative names: A STUCKI CO MFG, STUCKI, A CO
A J VATER (201 MUNSON AVE in MCKEES ROCKS, PA)
STATE MASTER (Pennsylvania database) - RCRIS-PAD987357001, HAZARDOUS WASTE PROGRAM Small Quantity Generators, between 100 kg and 1000 kg of hazardous waste/month (Resource Conservation and Recovery Act (tracking hazardous waste)) - notification Organizations: VATER FRANK (CONTACT/OWNER)
AUTO DIAG (400 LOCUST ST in MCKEES ROCKS, PA)
STATE MASTER (Pennsylvania database) - RCRIS-PAR000004143, HAZARDOUS WASTE PROGRAM, RESIDUAL WASTE Conditionally Exempt Small Quantity Generators, less than 100 kg/month of hazardous waste (Resource Conservation and Recovery Act (tracking hazardous waste)) - notification Organizations: LAUX DAVE (CONTACT/OWNER)
Alternative names: AUTO DIAGNOSTIC
ABUNDANT LIFE CHURCH (825 BROADWAY in MC KEES ROCKS, PA)
(Integrated Compliance Information System) - ICIS-03-1989-0857, FORMAL ENFORCEMENT ACTION COMPLIANCE ACTIVITY (Tracking inspections of insecticide, fungicide, and rodenticide, and toxic substances) Business SIC classification: RELIGIOUS ORGANIZATIONS Alternative names: ABUNDANT LIFE ACADEMY
BETTY BRITE CLEANERS (KENMAWR PLAZA - PINE HOLLOW ROAD in MCKEES ROCKS, PA)
AIR MINOR (AIRS/AFS) CRITERIA AND HAZARDOUS AIR POLLUTANT INVENTORY (Inventory of air pollution sources) Small Quantity Generators, between 100 kg and 1000 kg of hazardous waste/month (Resource Conservation and Recovery Act (tracking hazardous waste)) - notification Business SIC classification: DRYCLEANING PLANTS, EXCEPT RUG CLEANING Organizations: OPERNAME (CONTACT/OPERATOR)
, THRIFTY DRY CLEANERS INC (CONTACT/OWNER)
Alternative names: BETTY BRITE CLEANERS-MCKEES ROCKS
7-ELEVEN #56137 (CLEVER & FAIRHAVEN RD in MCKEES ROCKS, PA)
AIR MINOR (AIRS/AFS) Business SIC classification: GASOLINE SERVICE STATIONS
A. STUCKI CO._CHAMBER STREET FACILITY (2600 CHAMBERS ST. in MCKEES ROCKS, PA)
AIR MINOR (AIRS/AFS) Business SIC classification: MECHANICAL POWER TRANSMISSION EQUIPMENT; GENERAL INDUSTRIAL MACHINERY AND EQUIPMENT
ACHA MCKEES ROCKS TERRACE (HOWARD DRIVE in MC KEES ROCKS, PA)
AIR MINOR (AIRS/AFS) Business SIC classification: OPERATORS OF APARTMENT BUILDINGS Alternative names: ALLEGHENY COUNTY HOUSING AUTHORITY
ARMOND TRAPUZZANO (TRAPS AND WEBBS AUTO in MCKEES ROCKS, PA)
National Pollutant Discharge Elimination System NON-MAJOR (Tracking pollutant discharge elimination systems) - permit Business SIC classification: MOTOR VEHICLE PARTS, USED Alternative names: TRAP'S & WEBB'S AUTO
ALCOA RECYCLE CENTER INC (RIVER RD in MC KEES ROCKS, PA)
Small Quantity Generators, between 100 kg and 1000 kg of hazardous waste/month (Resource Conservation and Recovery Act (tracking hazardous waste)) - notification Organizations: ALCOA RECYLCE CENTER INC (CONTACT/OWNER)
BOB & SONS AUTO BODY INC (1381 ISLAND AVE in MCKEES ROCKS, PA)
Conditionally Exempt Small Quantity Generators, less than 100 kg/month of hazardous waste (Resource Conservation and Recovery Act (tracking hazardous waste)) - notification Organizations: YOST TIM (CONTACT/OWNER)
Alternative names: BOB SONS AUTO BODY
Housing units lacking complete plumbing facilities: 4.4% Housing units lacking complete kitchen facilities: 4.6%
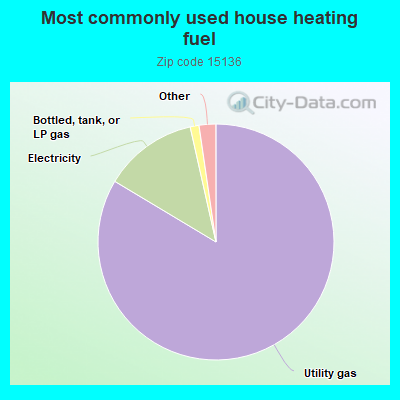
83.6%Utility gas
12.9%Electricity
1.2%Bottled, tank, or LP gas
0.9%Fuel oil, kerosene, etc.
0.7%Wood
Population in 1990: 25,092.
Place of birth for U.S.-born residents:
This state: 19,383
Northeast: 527
Midwest: 661
South: 1,148
West: 256
66% of the 15136 zip code residents lived in the same house 5 years ago. Out of people who lived in different houses, 82% lived in this county. Out of people who lived in different counties, 50% lived in Pennsylvania.
89% of the 15136 zip code residents lived in the same house 1 year ago. Out of people who lived in different houses, 81% moved from this county. Out of people who lived in different houses, 5% moved from different county within same state. Out of people who lived in different houses, 11% moved from different state.
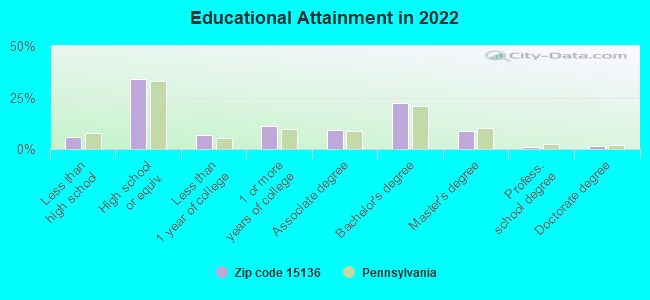
Private vs. public school enrollment:
Students in private schools in grades 1 to 8 (elementary and middle school): 130
Here:
7.2%
Pennsylvania:
15.7%
Students in private schools in grades 9 to 12 (high school): 217
Here:
17.8%
Pennsylvania:
13.4%
Students in private undergraduate colleges: 297
Here:
43.0%
Pennsylvania:
39.8%
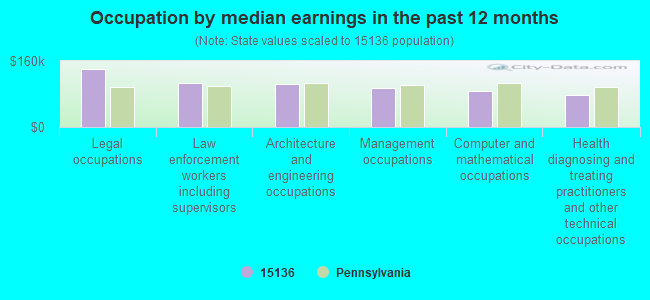
Occupation by median earnings in the past 12 months ($)
140,716Legal occupations
105,609Law enforcement workers including supervisors
104,189Architecture and engineering occupations
94,561Management occupations
87,104Computer and mathematical occupations
78,029Health diagnosing and treating practitioners and other technical occupations
Companies with biggest federal contracts located in this zip code:
TOTAL INDUSTRIAL & PACKAGING C (1300 ISLAND AVE in MC KEES ROCKS, PA; small business) : $7,385,871 in 265 contractsfrom 2001 to 2006
Contracts for Belting, Drive Belts, Fan Belts, and Accessories, Specialized Shipping and Storage Containers, Pipe, Tube and Rigid Tubing, Bags and Sacks, and moreby Defense Logistics Agency, Navy, Army Signed by year:2000: $0; 2001: $167,588; 2002: $1,616,951; 2003: $1,493,335; 2004: $2,241,190; 2005: $1,360,768; 2006: $506,039.
Biggest contracts:
$573,799 with Defense Logistics Agency for Belting, Drive Belts, Fan Belts, and Accessories. Signed on 2004-05-27. Completion date: 2004-08-31.
$388,320, same as above.Signed on 2003-10-16. Completion date: 2004-01-15.
$381,282 with Navy for Specialized Shipping and Storage Containers. Signed on 2003-03-05. Completion date: 2004-03-31.
$358,050 with Defense Logistics Agency for Belting, Drive Belts, Fan Belts, and Accessories. Signed on 2004-10-05. Completion date: 2004-12-12.
TOTAL INDUSTRIAL AND PACKAGING (97 HELEN STREET in MCKEES ROCKS, PA; small business) : $4,845,410 in 13 contractsfrom 2003 to 2006
Contracts for Bags and Sacks, Bearings, Antifriction, Unmounted, Miscellaneous Welding, Soldering, and Brazing Supplies and Accessories, Vehicular Brake, Steering, Axle, Wheel, and Track Components, and moreby Defense Logistics Agency Signed by year:2000: $0; 2001: $0; 2002: $0; 2003: $0; 2004: $4,806,710; 2005: $5,442; 2006: $33,258.
Biggest contracts:
$2,833,650 with Defense Logistics Agency for Bags and Sacks. Signed on 2004-07-15. Completion date: 2004-10-15.
$1,868,110, same as above.Signed on 2004-10-14. Completion date: 2005-01-15.
$104,950, same as above.Signed on 2004-02-02. Completion date: 2004-02-23.
$19,738 with Defense Logistics Agency for Bearings, Antifriction, Unmounted. Signed on 2006-01-13. Completion date: 2006-02-12.
HOLLOWOOD MUSIC & SOUND, INC (601 CHARTIERS AVE in MCKEES ROCKS, PA; small business) : $150,049 in 3 contractsfrom 2003 to 2005
$132,717 with Army for Audio/Visual Services. Signed on 2005-09-02. Completion date: 2005-10-31.
$14,370 with Army for Musical Instruments. Signed on 2003-08-07. Completion date: 2003-08-22.
$2,962 with Army for Intercommunication and Public Address Systems, Except Airborne. Signed on 2005-08-19. Completion date: 2005-08-31.
PEPSI COLA CO (400 GRAHAM ST in MCKEES ROCKS, PA) : $104,396 in 6 contractsfrom 2004 to 2006
Contracts for Food Items For Resale, Non-Food Items For Resale by Defense Commissary Agency Signed by year:2000: $0; 2001: $0; 2002: $0; 2003: $0; 2004: $19,261; 2005: $64,469; 2006: $20,666.
Biggest contracts:
$32,126 with Defense Commissary Agency for Food Items For Resale. Signed on 2005-04-01. Completion date: 2005-08-31.
$20,666 with Defense Commissary Agency for Non-Food Items For Resale. Signed on 2006-01-01. Completion date: 2006-03-31.
$19,261 with Defense Commissary Agency for Food Items For Resale. Signed on 2004-10-01. Completion date: 2005-02-28.
$13,947 with Defense Commissary Agency for Non-Food Items For Resale. Signed on 2005-10-01. Completion date: 2005-12-31.
STEEL FACTORY CORP. (200 BRADLEY ST in MC KEES ROCKS, PA; small business)
$79,000 with Air Force for Prefabricated and Portable Buildings. Taking place in FL. Signed on 2000-04-27. Completion date: 2000-05-30.
BUH ENTERPRISES, INC (415 SHINGISS STREET in MCKEES ROCKS, PA; small business)
$58,900 with Army for Maintenance, Repair or Alteration of Real Property -- Other Administrative Facilities and Service Buildings. Signed on 2001-04-05. Completion date: 2001-07-31.
SILVER STAR MEATS INC (1720 MIDDLETOWN RD in MC KEES ROCKS, PA; small business) : $40,822 in 5 contractsfrom 2004 to 2005
Contracts for Food Items For Resale, Non-Food Items For Resale by Defense Commissary Agency Signed by year:2000: $0; 2001: $0; 2002: $0; 2003: $0; 2004: $11,251; 2005: $29,571; 2006: $0.
Biggest contracts:
$11,251 with Defense Commissary Agency for Food Items For Resale. Signed on 2004-10-01. Completion date: 2005-02-28.
$10,904 with Defense Commissary Agency for Non-Food Items For Resale. Signed on 2005-10-01. Completion date: 2005-12-31.
$10,365 with Defense Commissary Agency for Food Items For Resale. Signed on 2005-04-01. Completion date: 2005-08-31.
$6,299, same as above.Signed on 2005-01-01. Completion date: 2005-03-31.
RICCIS ITALIAN SAUSAGE (811 BROADWAY in MCKEES ROCKS, PA; small business) : $21,641 in 6 contractsfrom 2004 to 2006
Contracts for Food Items For Resale, Non-Food Items For Resale by Defense Commissary Agency Signed by year:2000: $0; 2001: $0; 2002: $0; 2003: $0; 2004: $4,924; 2005: $14,165; 2006: $2,552.
Biggest contracts:
$6,186 with Defense Commissary Agency for Food Items For Resale. Signed on 2005-04-01. Completion date: 2005-08-31.
$4,924, same as above.Signed on 2004-10-01. Completion date: 2005-03-31.
$3,565, same as above.Signed on 2005-01-01. Completion date: 2005-03-31.
$3,378 with Defense Commissary Agency for Non-Food Items For Resale. Signed on 2005-10-01. Completion date: 2005-12-31.
ACE WIRE SPRING & FORM CO, INC (1105 THOMPSON AVE in MC KEES ROCKS, PA; small business) : $13,606 in 5 contractsfrom 2005 to 2006
Contracts for Coil, Flat, Leaf, and Wire Springs by Army Signed by year:2000: $0; 2001: $0; 2002: $0; 2003: $0; 2004: $0; 2005: $5,559; 2006: $8,047.
Biggest contracts:
$6,810 with Army for Coil, Flat, Leaf, and Wire Springs. Signed on 2006-03-29. Completion date: 2006-05-19.
$3,786, same as above.Signed on 2005-12-12. Completion date: 2006-02-20.
$1,773, same as above.Signed on 2005-12-20. Completion date: 2006-01-31.
$940, same as above.Signed on 2006-02-21. Completion date: 2006-02-20.
BLACK ELECTRIC INC (1110 ISLAND AVENUE in MCKEES ROCKS, PA; small business) : $12,580 in 2 contractsin 2004
$8,100 with Army for Maintenance, Repair or Alteration of Real Property -- Miscellaneous Buildings. Signed on 2004-01-14. Completion date: 2004-01-30.
$4,480, same as above.Signed on 2004-02-26. Completion date: 2004-02-26.
Top industries in this zip code by the number of employees in 2005:
Health Care and Social Assistance: General Medical and Surgical Hospitals (500-999 employees: 1 establishment)
2003 - 2018 National Fire Incident Reporting System (NFIRS) incidents
Based on the data from the years 2003 - 2018 the average number of fires per year is 19. The highest number of fire incidents - 110 took place in 2018, and the least - 0 in 2009. The data has a growing trend.
When looking into fire subcategories, the most incidents belonged to: Structure Fires (60.0%), and Mobile Property/Vehicle Fires (16.1%).
Fire incident types reported to NFIRS in Zip Code 15136
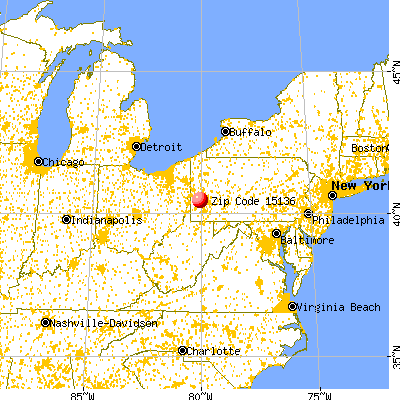


 Nearest zip codes: 15205, 15225, 15204, 15202, 15106, 15233.
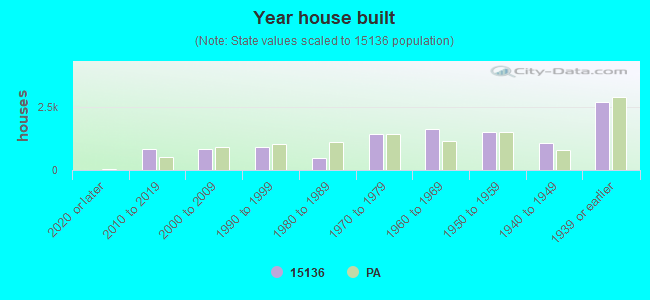


 Based on the data from the years 2003 - 2018 the average number of fires per year is 19. The highest number of fire incidents - 110 took place in 2018, and the least - 0 in 2009. The data has a growing trend.
 When looking into fire subcategories, the most incidents belonged to: Structure Fires (60.0%), and Mobile Property/Vehicle Fires (16.1%).