Estimated zip code population in 2022: 10,553 Zip code population in 2010: 11,081 Zip code population in 2000: 12,477
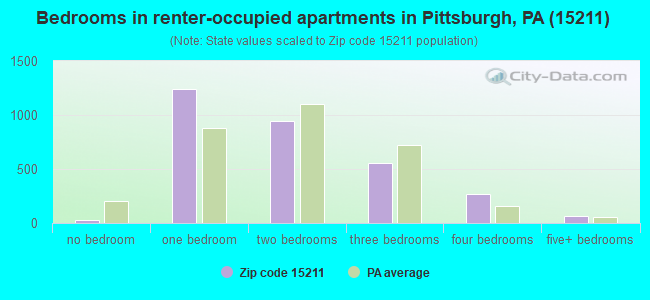
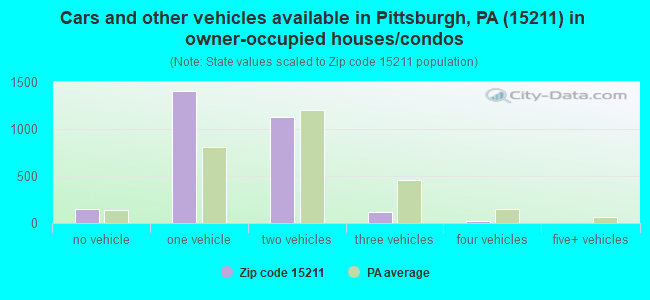
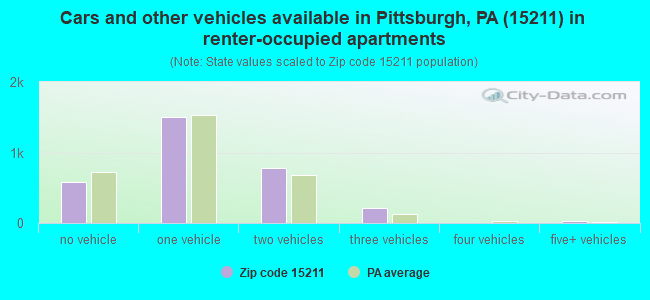
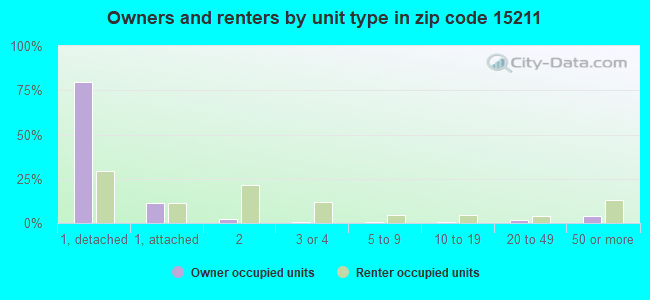
Houses and condos: 6,631 Renter-occupied apartments: 3,117
% of renters here:
53%
State:
31%
March 2022 cost of living index in zip code 15211: 94.1 (less than average, U.S. average is 100)
Land area: 1.5 sq. mi. Water area: 0.0 sq. mi.
Population density: 6,842 people per square mile
(high).
OSM Map
General Map
Google Map
MSN Map
OSM Map
General Map
Google Map
MSN Map
OSM Map
General Map
Google Map
MSN Map
OSM Map
General Map
Google Map
MSN Map
Please wait while loading the map...
Real estate property taxes paid for housing units in 2022:
This zip code:
0.9% ($1,693)
Pennsylvania:
1.3% ($3,094)
Median real estate property taxes paid for housing units with mortgages in 2022: $2,203 (1.0%) Median real estate property taxes paid for housing units with no mortgage in 2022: $1,347 (0.9%)
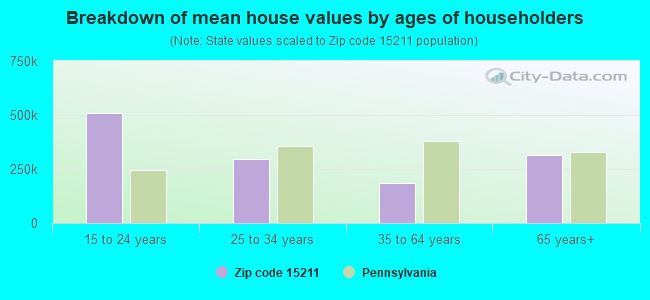
Estimated median house/condo value in 2022: $190,474
15211:
$190,474
Pennsylvania:
$245,500
According to our research of Pennsylvania and other state lists, there were 19 registered sex offenders living in 15211 zip code as of April 27, 2024. The ratio of all residents to sex offenders in zip code 15211 is 586 to 1. The ratio of registered sex offenders to all residents in this zip code is near the state average.
Median resident age:
This zip code:
36.0 years
Pennsylvania median age:
40.9 years
Average household size:
This zip code:
1.8 people
Pennsylvania:
2.4 people
Averages for the 2020 tax year for zip code 15211, filed in 2021:
Average Adjusted Gross Income (AGI) in 2020: $68,316 (Individual Income Tax Returns)
Here:
$68,316
State:
$75,707
Salary/wage: $57,228 (reported on 84.3% of returns)
Here:
$57,228
State:
$62,806
(% of AGI for various income ranges: 1013.1% for AGIs below $25k, 3539.8% for AGIs $25k-50k, 6578.9% for AGIs $50k-75k, 9972.7% for AGIs $75k-100k, 18249.5% for AGIs $100k-200k, 89681.4% for AGIs over 200k)
Taxable interest for individuals: $1,771 (reported on 26.6% of returns)
This zip code:
$1,771
Pennsylvania:
$1,633
(% of AGI for various income ranges: 14.5% for AGIs below $25k, 7.3% for AGIs $25k-50k, 24.2% for AGIs $50k-75k, 59.3% for AGIs $75k-100k, 137.2% for AGIs $100k-200k, 2371.4% for AGIs over 200k)
Ordinary dividends: $5,475 (reported on 21.8% of returns)
Here:
$5,475
State:
$7,382
(% of AGI for various income ranges: 19.1% for AGIs below $25k, 21.6% for AGIs $25k-50k, 68.0% for AGIs $50k-75k, 139.5% for AGIs $75k-100k, 431.5% for AGIs $100k-200k, 5742.9% for AGIs over 200k)
Net capital gain/loss in AGI: +$14,761 (reported on 19.7% of returns)
Here:
+$14,761
State:
+$23,522
(% of AGI for various income ranges: 11.3% for AGIs below $25k, 24.6% for AGIs $25k-50k, 77.0% for AGIs $50k-75k, 210.5% for AGIs $75k-100k, 806.7% for AGIs $100k-200k, 18488.6% for AGIs over 200k)
Profit/loss from business: +$15,758 (reported on 12.7% of returns)
Here:
+$15,758
State:
+$16,274
(% of AGI for various income ranges: 77.9% for AGIs below $25k, 99.2% for AGIs $25k-50k, 215.5% for AGIs $50k-75k, 179.3% for AGIs $75k-100k, 628.2% for AGIs $100k-200k, 6944.3% for AGIs over 200k)
Taxable individual retirement arrangement distribution: $24,714 (reported on 7.9% of returns)
15211:
$24,714
Pennsylvania:
$18,583
(% of AGI for various income ranges: 69.7% for AGIs below $25k, 49.9% for AGIs $25k-50k, 133.6% for AGIs $50k-75k, 278.8% for AGIs $75k-100k, 733.1% for AGIs $100k-200k, 7580.0% for AGIs over 200k)
Self-employed (Keogh) retirement plans: $26,400 (reported on 0.3% of returns)
15211:
$26,400
Pennsylvania:
$25,407
(% of AGI for various income ranges: 33.6% for AGIs $25k-50k)
Total itemized deductions: $28,868 (reported on 5.9% of returns)
Here:
$28,868
State:
$34,850
(% of AGI for various income ranges: 63.4% for AGIs below $25k, 130.1% for AGIs $50k-75k, 308.3% for AGIs $75k-100k, 783.6% for AGIs $100k-200k, 6355.7% for AGIs over 200k)
Charity contributions: $7,700 (reported on 4.3% of returns)
Here:
$7,700
State:
$12,392
(% of AGI for various income ranges: 16.5% for AGIs $50k-75k, 39.0% for AGIs $75k-100k, 107.7% for AGIs $100k-200k, 1931.4% for AGIs over 200k)
Taxes paid: $7,976 (reported on 5.9% of returns)
15211:
$7,976
State:
$8,200
(% of AGI for various income ranges: 7.9% for AGIs below $25k, 26.1% for AGIs $50k-75k, 112.0% for AGIs $75k-100k, 283.3% for AGIs $100k-200k, 1515.7% for AGIs over 200k)
Earned income credit: $1,482 (reported on 9.9% of returns)
Here:
$1,482
State:
$2,100
(% of AGI for various income ranges: 48.7% for AGIs below $25k, 21.7% for AGIs $25k-50k)
Percentage of individuals using paid preparers for their 2020 taxes: 93.3%
Here:
93%
State:
92%
(% for various income ranges: 92.5% for AGIs below $25k, 94.2% for AGIs $25k-50k, 94.0% for AGIs $50k-75k, 93.3% for AGIs $75k-100k, 91.4% for AGIs $100k-200k, 92.3% for AGIs over 200k)
Averages for the 2012 tax year for zip code 15211, filed in 2013:
Average Adjusted Gross Income (AGI) in 2012: $50,941 (Individual Income Tax Returns)
Here:
$50,941
State:
$61,346
Salary/wage: $42,250 (reported on 86.5% of returns)
Here:
$42,250
State:
$51,902
(% of AGI for various income ranges: 78.9% for AGIs below $25k, 86.8% for AGIs $25k-50k, 85.1% for AGIs $50k-75k, 77.1% for AGIs $75k-100k, 74.0% for AGIs $100k-200k, 38.4% for AGIs over 200k)
Taxable interest for individuals: $1,225 (reported on 26.7% of returns)
This zip code:
$1,225
Pennsylvania:
$1,588
(% of AGI for various income ranges: 0.5% for AGIs below $25k, 0.3% for AGIs $25k-50k, 0.5% for AGIs $50k-75k, 0.8% for AGIs $75k-100k, 0.5% for AGIs $100k-200k, 1.3% for AGIs over 200k)
Ordinary dividends: $5,050 (reported on 18.1% of returns)
Here:
$5,050
State:
$5,827
(% of AGI for various income ranges: 1.8% for AGIs below $25k, 0.6% for AGIs $25k-50k, 1.0% for AGIs $50k-75k, 1.2% for AGIs $75k-100k, 1.9% for AGIs $100k-200k, 3.8% for AGIs over 200k)
Net capital gain/loss in AGI: +$24,408 (reported on 12.2% of returns)
Here:
+$24,408
State:
+$14,495
(% of AGI for various income ranges: 0.9% for AGIs below $25k, 1.0% for AGIs $25k-50k, 0.3% for AGIs $50k-75k, 0.4% for AGIs $75k-100k, 2.5% for AGIs $100k-200k, 24.4% for AGIs over 200k)
Profit/loss from business: +$18,532 (reported on 10.4% of returns)
Here:
+$18,532
State:
+$16,268
(% of AGI for various income ranges: 4.1% for AGIs below $25k, 2.4% for AGIs $25k-50k, 2.5% for AGIs $50k-75k, 1.5% for AGIs $75k-100k, 4.2% for AGIs $100k-200k, 6.8% for AGIs over 200k)
Taxable individual retirement arrangement distribution: $20,017 (reported on 8.2% of returns)
15211:
$20,017
Pennsylvania:
$14,550
(% of AGI for various income ranges: 2.6% for AGIs below $25k, 1.5% for AGIs $25k-50k, 2.0% for AGIs $50k-75k, 3.4% for AGIs $75k-100k, 3.7% for AGIs $100k-200k, 5.6% for AGIs over 200k)
Self-employment retirement plans: $31,600 (reported on 0.5% of returns)
15211:
$31,600
Pennsylvania:
$20,922
Total itemized deductions: $20,729 (17% of AGI, reported on 20.3% of returns)
Here:
$20,729
State:
$23,538
Here:
16.5% of AGI
State:
18.4% of AGI
(% of AGI for various income ranges: 4.0% for AGIs below $25k, 4.2% for AGIs $25k-50k, 6.6% for AGIs $50k-75k, 10.1% for AGIs $75k-100k, 12.8% for AGIs $100k-200k, 10.7% for AGIs over 200k)
Charity contributions: $3,401 (reported on 15.5% of returns)
Here:
$3,401
State:
$4,025
(% of AGI for various income ranges: 0.3% for AGIs below $25k, 0.4% for AGIs $25k-50k, 0.6% for AGIs $50k-75k, 1.1% for AGIs $75k-100k, 1.6% for AGIs $100k-200k, 1.8% for AGIs over 200k)
Taxes paid: $9,652 (reported on 20.1% of returns)
15211:
$9,652
State:
$9,982
(% of AGI for various income ranges: 0.7% for AGIs below $25k, 1.3% for AGIs $25k-50k, 2.7% for AGIs $50k-75k, 4.4% for AGIs $75k-100k, 6.3% for AGIs $100k-200k, 6.2% for AGIs over 200k)
Earned income credit: $1,701 (reported on 12.6% of returns)
Here:
$1,701
State:
$2,106
(% of AGI for various income ranges: 3.3% for AGIs below $25k, 0.4% for AGIs $25k-50k)
Percentage of individuals using paid preparers for their 2012 taxes: 42.1%
Here:
42%
State:
53%
(% for various income ranges: 37.8% for AGIs below $25k, 38.2% for AGIs $25k-50k, 43.4% for AGIs $50k-75k, 48.8% for AGIs $75k-100k, 62.2% for AGIs $100k-200k, 84.6% for AGIs over 200k)
Averages for the 2004 tax year for zip code 15211, filed in 2005:
Average Adjusted Gross Income (AGI) in 2004: $43,950 (Individual Income Tax Returns)
Here:
$43,950
State:
$48,049
Salary/wage: $35,583 (reported on 85.0% of returns)
Here:
$35,583
State:
$42,646
(% of AGI for various income ranges: 148.9% for AGIs below $10k, 77.6% for AGIs $10k-25k, 85.3% for AGIs $25k-50k, 84.2% for AGIs $50k-75k, 82.3% for AGIs $75k-100k, 44.3% for AGIs over 100k)
Taxable interest for individuals: $1,931 (reported on 39.0% of returns)
This zip code:
$1,931
Pennsylvania:
$1,657
(% of AGI for various income ranges: 8.5% for AGIs below $10k, 1.7% for AGIs $10k-25k, 1.0% for AGIs $25k-50k, 1.1% for AGIs $50k-75k, 0.9% for AGIs $75k-100k, 2.4% for AGIs over 100k)
Taxable dividends: $5,166 (reported on 22.1% of returns)
Here:
$5,166
State:
$3,566
(% of AGI for various income ranges: 7.8% for AGIs below $10k, 1.2% for AGIs $10k-25k, 0.8% for AGIs $25k-50k, 0.9% for AGIs $50k-75k, 1.8% for AGIs $75k-100k, 4.8% for AGIs over 100k)
Net capital gain/loss: +$25,863 (reported on 16.0% of returns)
Here:
+$25,863
State:
+$9,716
(% of AGI for various income ranges: -2.4% for AGIs below $10k, 0.4% for AGIs $10k-25k, 0.3% for AGIs $25k-50k, 0.2% for AGIs $50k-75k, 1.6% for AGIs $75k-100k, 23.5% for AGIs over 100k)
Profit/loss from business: +$14,091 (reported on 10.2% of returns)
Here:
+$14,091
State:
+$14,267
(% of AGI for various income ranges: 13.0% for AGIs below $10k, 3.6% for AGIs $10k-25k, 2.2% for AGIs $25k-50k, 2.0% for AGIs $50k-75k, 2.4% for AGIs $75k-100k, 4.2% for AGIs over 100k)
IRA payment deduction: $2,545 (reported on 2.1% of returns)
15211:
$2,545
Pennsylvania:
$2,903
(% of AGI for various income ranges: 0.2% for AGIs $10k-25k, 0.2% for AGIs $25k-50k, 0.2% for AGIs $50k-75k, 0.0% for AGIs over 100k)
Self-employed pension: $17,292 (reported on 0.8% of returns)
Here:
$17,292
Pennsylvania:
$14,674
Total itemized deductions: $19,436 (17% of AGI, reported on 22.7% of returns)
Here:
$19,436
State:
$18,804
Here:
17.3% of AGI
State:
19.5% of AGI
(% of AGI for various income ranges: 10.3% for AGIs below $10k, 4.6% for AGIs $10k-25k, 6.4% for AGIs $25k-50k, 9.5% for AGIs $50k-75k, 12.4% for AGIs $75k-100k, 13.4% for AGIs over 100k)
Charity contributions deductions: $3,167 (3% of AGI, reported on 19.6% of returns)
Here:
$3,167
State:
$3,337
Here:
2.7% of AGI
State:
3.3% of AGI
(% of AGI for various income ranges: 0.6% for AGIs below $10k, 0.5% for AGIs $10k-25k, 0.6% for AGIs $25k-50k, 1.3% for AGIs $50k-75k, 1.8% for AGIs $75k-100k, 2.1% for AGIs over 100k)
Total tax: $7,457 (reported on 76.4% of returns)
15211:
$7,457
State:
$8,008
(% of AGI for various income ranges: 3.1% for AGIs below $10k, 4.7% for AGIs $10k-25k, 8.6% for AGIs $25k-50k, 11.1% for AGIs $50k-75k, 12.7% for AGIs $75k-100k, 19.1% for AGIs over 100k)
Earned income credit: $1,469 (reported on 13.4% of returns)
Here:
$1,469
State:
$1,643
Percentage of individuals using paid preparers for their 2004 taxes: 47.4%
Here:
47%
State:
56%
(% for various income ranges: 44.6% for AGIs below $10k, 44.6% for AGIs $10k-25k, 46.5% for AGIs $25k-50k, 48.2% for AGIs $50k-75k, 50.2% for AGIs $75k-100k, 71.6% for AGIs over 100k)
Likely homosexual households (counted as self-reported same-sex unmarried-partner households)
Lesbian couples: 0.1% of all households
Gay men: 0.4% of all households
Household received Food Stamps/SNAP in the past 12 months: 664 Household did not receive Food Stamps/SNAP in the past 12 months: 5,220
Women who had a birth in the past 12 months: 35 (27 now married, 8 unmarried) Women who did not have a birth in the past 12 months: 2,650 (776 now married, 1,882 unmarried)
Housing units in zip code 15211 with a mortgage: 1,559 (107 second mortgage, 86 both second mortgage and home equity loan) Houses without a mortgage: 43
Median monthly owner costs for units with a mortgage: $1,283 Median monthly owner costs for units without a mortgage: $518
Residents with income below the poverty level in 2022:
This zip code:
10.3%
Whole state:
11.8%
Residents with income below 50% of the poverty level in 2022:
This zip code:
5.1%
Whole state:
6.1%
Median number of rooms in houses and condos:
Here:
6.1
State:
6.8
Median number of rooms in apartments:
Here:
4.4
State:
4.3
Notable locations in this zip code not listed on our city pages
Notable locations in zip code 15211: Palm Garden Station (A), Mount Washington Overlook (B), Mount Washington Branch Carnegie Free Library of Pittsburgh (C), Mount Washington Childrens Center (D), Prospect Elementary School Library (E), Prospect Middle School Library (F), Prospect Multi-Racial-Cultural Library (G), Whittier Elementary School Library (H), West Belt Junction Station (I), Pittsburgh Bureau of Fire Station 27 (J). Display/hide their locations on the map
Churches in zip code 15211 include: Saint Justin Church (A), Presbyterian Church of Mount Washington (B), Mount Washington Baptist Church (C), Haven Heights Methodist Church (D), Greater Deliverance Temple of Apostolic Faith (E), Grandview United Presbyterian Church (F), Grace Episcopal Church (G), Saint Marys of the Mount Church (H). Display/hide their locations on the map
507 married couples with children.
379 single-parent households (97 men, 282 women).
94.3% of residents of 15211 zip code speak English at home.
1.7% of residents speak Spanish at home (83% very well, 7% well, 10% not well).
2.7% of residents speak other Indo-European language at home (76% very well, 12% well, 12% not well).
0.7% of residents speak Asian or Pacific Island language at home (100% very well).
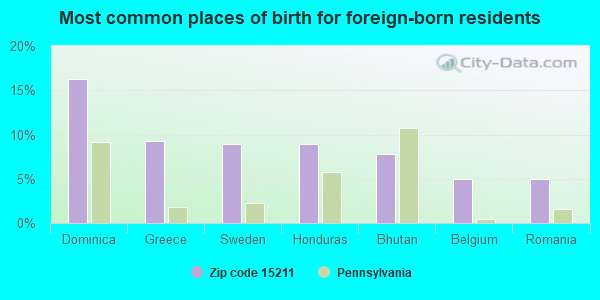
Foreign born population: 460 (4.4%) (50.0% of them are naturalized citizens)
Facilities with environmental interests located in this zip code:
BP OIL 07098 (10 VIRGINIA AVE in PITTSBURGH, PA)
STATE MASTER (Pennsylvania database) - RCRIS-PAD981934086, HAZARDOUS WASTE PROGRAM Small Quantity Generators, between 100 kg and 1000 kg of hazardous waste/month (Resource Conservation and Recovery Act (tracking hazardous waste)) - notification Organizations: OPERNAME (CONTACT/OPERATOR)
, BP OIL COMPANY (CONTACT/OWNER)
Alternative names: BP OIL COMPANY 07098
BRAMS CLEANERS (120 1/2 SHILOH STREET in PITTSBURGH, PA)
AIR MINOR (AIRS/AFS) CRITERIA AND HAZARDOUS AIR POLLUTANT INVENTORY (Inventory of air pollution sources) Small Quantity Generators, between 100 kg and 1000 kg of hazardous waste/month (Resource Conservation and Recovery Act (tracking hazardous waste)) - notification Business SIC classification: DRYCLEANING PLANTS, EXCEPT RUG CLEANING Organizations: ALAN BRAM (CONTACT/OWNER)
Housing units lacking complete plumbing facilities: 1.3% Housing units lacking complete kitchen facilities: 1.9%
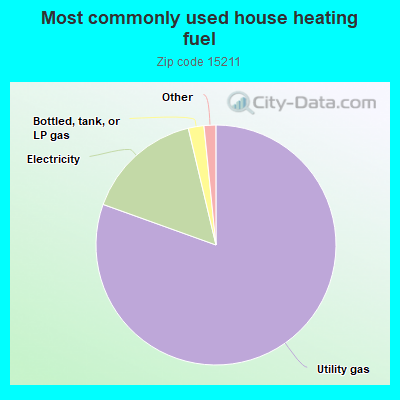
80.5%Utility gas
15.8%Electricity
2.1%Bottled, tank, or LP gas
0.7%Fuel oil, kerosene, etc.
0.5%No fuel used
Population in 1990: 13,333.
Place of birth for U.S.-born residents:
This state: 8,148
Northeast: 404
Midwest: 692
South: 584
West: 133
61% of the 15211 zip code residents lived in the same house 5 years ago. Out of people who lived in different houses, 63% lived in this county. Out of people who lived in different counties, 50% lived in Pennsylvania.
81% of the 15211 zip code residents lived in the same house 1 year ago. Out of people who lived in different houses, 63% moved from this county. Out of people who lived in different houses, 9% moved from different county within same state. Out of people who lived in different houses, 24% moved from different state. Out of people who lived in different houses, 1% moved from abroad.
Private vs. public school enrollment:
Students in private schools in grades 1 to 8 (elementary and middle school): 11
Here:
4.1%
Pennsylvania:
15.7%
Students in private schools in grades 9 to 12 (high school): 16
Here:
10.8%
Pennsylvania:
13.4%
Students in private undergraduate colleges: 94
Here:
33.6%
Pennsylvania:
39.8%
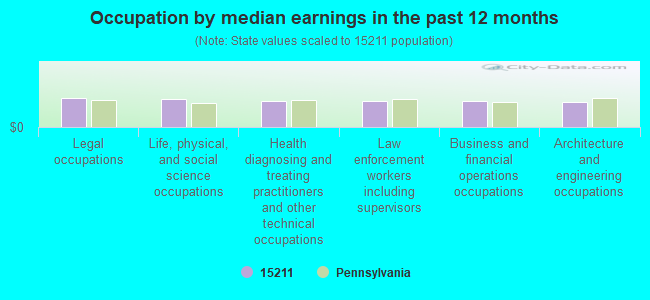
Occupation by median earnings in the past 12 months ($)
80,710Legal occupations
79,161Life, physical, and social science occupations
73,991Health diagnosing and treating practitioners and other technical occupations
73,872Law enforcement workers including supervisors
73,789Business and financial operations occupations
71,513Architecture and engineering occupations
Top industries in this zip code by the number of employees in 2005:
Other Services (except Public Administration): Other Similar Organizations (except Business, Professional, Labor, and Political Organizations) (10-19: 2, 1-4: 2)
Educational Services: Elementary and Secondary Schools (20-49: 1)
Administrative and Support and Waste Management and Remediation Services: Security Systems Services (except Locksmiths) (20-49: 1)
Health Care and Social Assistance: Child Day Care Services (20-49: 1)
People in group quarters in 2010:
10 people in correctional residential facilities
2 people in workers' group living quarters and job corps centers
People in group quarters in 2000:
10 people in religious group quarters
Fatal accident statistics in 2011:
Fatal accident count: 1
Vehicles involved in fatal accidents: 1
Fatal accidents caused by drunken drivers: 0
Fatalities: 1
Persons involved in fatal accidents: 1
Pedestrians involved in fatal accidents: 0
Fatal accident statistics in 2010:
Fatal accident count: 1
Vehicles involved in fatal accidents: 1
Fatal accidents caused by drunken drivers: 1
Fatalities: 1
Persons involved in fatal accidents: 1
Pedestrians involved in fatal accidents: 0
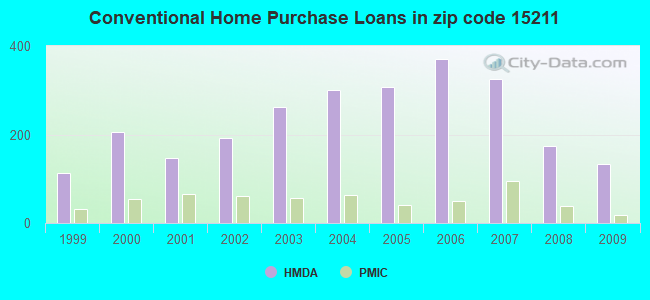
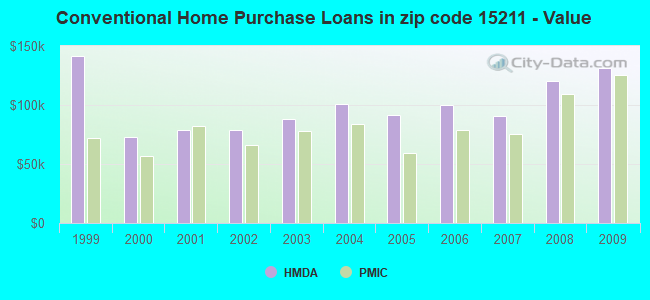
Home Mortgage Disclosure Act Aggregated Statistics For Year 2009 (Based on 2 full and 8 partial tracts)
A) FHA, FSA/RHS & VA Home Purchase Loans
B) Conventional Home Purchase Loans
C) Refinancings
D) Home Improvement Loans
E) Loans on Dwellings For 5+ Families
F) Non-occupant Loans on < 5 Family Dwellings (A B C & D)
Number
Average Value
Number
Average Value
Number
Average Value
Number
Average Value
Number
Average Value
Number
Average Value
LOANS ORIGINATED
69
$108,455
133
$131,237
175
$134,235
51
$54,394
3
$1,281,600
59
$100,225
APPLICATIONS APPROVED, NOT ACCEPTED
13
$108,554
11
$126,606
28
$160,928
2
$82,090
0
$0
9
$79,682
APPLICATIONS DENIED
13
$90,398
18
$165,138
123
$118,043
43
$35,961
0
$0
30
$100,015
APPLICATIONS WITHDRAWN
26
$109,879
11
$171,856
56
$170,057
8
$57,241
0
$0
15
$200,836
FILES CLOSED FOR INCOMPLETENESS
6
$121,987
4
$129,285
24
$105,132
5
$24,896
0
$0
4
$65,870
Aggregated Statistics For Year 2008 (Based on 2 full and 8 partial tracts)
A) FHA, FSA/RHS & VA Home Purchase Loans
B) Conventional Home Purchase Loans
C) Refinancings
D) Home Improvement Loans
E) Loans on Dwellings For 5+ Families
F) Non-occupant Loans on < 5 Family Dwellings (A B C & D)
G) Loans On Manufactured Home Dwelling (A B C & D)
Number
Average Value
Number
Average Value
Number
Average Value
Number
Average Value
Number
Average Value
Number
Average Value
Number
Average Value
LOANS ORIGINATED
36
$92,751
173
$119,976
204
$105,108
77
$36,228
7
$345,619
137
$78,472
0
$0
APPLICATIONS APPROVED, NOT ACCEPTED
6
$104,750
15
$118,029
16
$83,437
13
$38,466
0
$0
12
$65,359
0
$0
APPLICATIONS DENIED
3
$84,163
42
$92,816
183
$108,264
80
$40,834
2
$48,600
51
$117,308
4
$107,275
APPLICATIONS WITHDRAWN
2
$45,000
19
$76,526
45
$143,125
13
$49,894
0
$0
11
$68,865
0
$0
FILES CLOSED FOR INCOMPLETENESS
2
$43,125
0
$0
13
$74,598
4
$90,940
0
$0
6
$97,875
0
$0
Aggregated Statistics For Year 2007 (Based on 2 full and 8 partial tracts)
A) FHA, FSA/RHS & VA Home Purchase Loans
B) Conventional Home Purchase Loans
C) Refinancings
D) Home Improvement Loans
E) Loans on Dwellings For 5+ Families
F) Non-occupant Loans on < 5 Family Dwellings (A B C & D)
Number
Average Value
Number
Average Value
Number
Average Value
Number
Average Value
Number
Average Value
Number
Average Value
LOANS ORIGINATED
33
$103,736
325
$90,445
225
$114,788
86
$31,455
3
$298,603
139
$91,294
APPLICATIONS APPROVED, NOT ACCEPTED
2
$85,535
63
$144,972
57
$145,201
3
$70,937
0
$0
35
$88,871
APPLICATIONS DENIED
5
$115,204
80
$102,006
263
$99,832
98
$47,548
0
$0
74
$79,257
APPLICATIONS WITHDRAWN
0
$0
37
$94,078
88
$100,159
13
$46,630
0
$0
12
$74,219
FILES CLOSED FOR INCOMPLETENESS
4
$124,502
11
$129,083
17
$108,693
4
$31,995
0
$0
0
$0
Aggregated Statistics For Year 2006 (Based on 2 full and 8 partial tracts)
A) FHA, FSA/RHS & VA Home Purchase Loans
B) Conventional Home Purchase Loans
C) Refinancings
D) Home Improvement Loans
E) Loans on Dwellings For 5+ Families
F) Non-occupant Loans on < 5 Family Dwellings (A B C & D)
G) Loans On Manufactured Home Dwelling (A B C & D)
Number
Average Value
Number
Average Value
Number
Average Value
Number
Average Value
Number
Average Value
Number
Average Value
Number
Average Value
LOANS ORIGINATED
32
$83,194
371
$99,674
347
$94,625
107
$44,237
11
$393,170
213
$82,436
3
$30,930
APPLICATIONS APPROVED, NOT ACCEPTED
0
$0
35
$142,859
66
$106,700
15
$16,603
0
$0
17
$56,999
2
$48,600
APPLICATIONS DENIED
7
$56,520
125
$92,177
312
$86,465
121
$28,260
2
$403,690
82
$88,128
2
$370,315
APPLICATIONS WITHDRAWN
0
$0
60
$122,554
150
$76,708
13
$59,616
0
$0
28
$89,790
0
$0
FILES CLOSED FOR INCOMPLETENESS
0
$0
9
$73,467
31
$94,935
2
$95,770
2
$351,160
6
$80,575
0
$0
Aggregated Statistics For Year 2005 (Based on 2 full and 8 partial tracts)
A) FHA, FSA/RHS & VA Home Purchase Loans
B) Conventional Home Purchase Loans
C) Refinancings
D) Home Improvement Loans
E) Loans on Dwellings For 5+ Families
F) Non-occupant Loans on < 5 Family Dwellings (A B C & D)
G) Loans On Manufactured Home Dwelling (A B C & D)
Number
Average Value
Number
Average Value
Number
Average Value
Number
Average Value
Number
Average Value
Number
Average Value
Number
Average Value
LOANS ORIGINATED
15
$82,642
308
$91,798
355
$98,385
133
$40,280
2
$154,325
184
$79,636
0
$0
APPLICATIONS APPROVED, NOT ACCEPTED
0
$0
36
$80,802
75
$88,594
17
$23,560
0
$0
24
$63,466
0
$0
APPLICATIONS DENIED
0
$0
103
$71,451
374
$82,360
153
$26,714
2
$771,935
107
$45,625
6
$29,118
APPLICATIONS WITHDRAWN
0
$0
46
$97,295
139
$125,565
29
$68,888
0
$0
18
$120,765
0
$0
FILES CLOSED FOR INCOMPLETENESS
0
$0
8
$193,270
29
$83,158
4
$15,962
0
$0
3
$95,553
0
$0
Aggregated Statistics For Year 2004 (Based on 2 full and 8 partial tracts)
A) FHA, FSA/RHS & VA Home Purchase Loans
B) Conventional Home Purchase Loans
C) Refinancings
D) Home Improvement Loans
E) Loans on Dwellings For 5+ Families
F) Non-occupant Loans on < 5 Family Dwellings (A B C & D)
G) Loans On Manufactured Home Dwelling (A B C & D)
Number
Average Value
Number
Average Value
Number
Average Value
Number
Average Value
Number
Average Value
Number
Average Value
Number
Average Value
LOANS ORIGINATED
33
$78,491
300
$101,052
499
$92,847
126
$28,260
4
$190,082
181
$70,760
3
$6,090
APPLICATIONS APPROVED, NOT ACCEPTED
4
$90,488
40
$87,800
112
$87,129
22
$21,046
0
$0
22
$42,100
0
$0
APPLICATIONS DENIED
2
$39,400
42
$71,042
435
$71,919
165
$20,286
0
$0
117
$40,808
4
$1,692
APPLICATIONS WITHDRAWN
4
$89,882
42
$90,078
160
$90,787
22
$25,557
0
$0
20
$99,149
0
$0
FILES CLOSED FOR INCOMPLETENESS
0
$0
9
$67,273
58
$97,053
5
$13,450
0
$0
9
$94,087
0
$0
Aggregated Statistics For Year 2003 (Based on 2 full and 8 partial tracts)
A) FHA, FSA/RHS & VA Home Purchase Loans
B) Conventional Home Purchase Loans
C) Refinancings
D) Home Improvement Loans
E) Loans on Dwellings For 5+ Families
F) Non-occupant Loans on < 5 Family Dwellings (A B C & D)
Number
Average Value
Number
Average Value
Number
Average Value
Number
Average Value
Number
Average Value
Number
Average Value
LOANS ORIGINATED
33
$64,536
263
$87,953
737
$84,237
104
$38,548
5
$309,516
189
$73,302
APPLICATIONS APPROVED, NOT ACCEPTED
4
$69,715
33
$81,461
195
$91,472
21
$46,696
2
$369,815
26
$61,184
APPLICATIONS DENIED
6
$66,423
46
$73,733
375
$96,243
80
$19,464
2
$42,615
73
$56,050
APPLICATIONS WITHDRAWN
2
$106,920
26
$110,436
168
$83,644
13
$13,658
0
$0
24
$78,465
FILES CLOSED FOR INCOMPLETENESS
2
$112,750
3
$110,377
29
$91,126
6
$38,473
0
$0
9
$73,436
Aggregated Statistics For Year 2002 (Based on 2 full and 8 partial tracts)
A) FHA, FSA/RHS & VA Home Purchase Loans
B) Conventional Home Purchase Loans
C) Refinancings
D) Home Improvement Loans
E) Loans on Dwellings For 5+ Families
F) Non-occupant Loans on < 5 Family Dwellings (A B C & D)
Number
Average Value
Number
Average Value
Number
Average Value
Number
Average Value
Number
Average Value
Number
Average Value
LOANS ORIGINATED
41
$68,538
192
$78,485
478
$74,411
71
$32,804
7
$229,944
153
$65,278
APPLICATIONS APPROVED, NOT ACCEPTED
0
$0
23
$63,502
148
$62,900
30
$23,972
0
$0
5
$84,238
APPLICATIONS DENIED
2
$36,185
46
$54,608
330
$63,758
65
$16,282
2
$30,000
24
$54,269
APPLICATIONS WITHDRAWN
0
$0
20
$114,238
165
$63,126
19
$19,476
0
$0
13
$71,312
FILES CLOSED FOR INCOMPLETENESS
0
$0
4
$54,578
40
$75,368
2
$34,815
0
$0
7
$109,166
Aggregated Statistics For Year 2001 (Based on 2 full and 8 partial tracts)
A) FHA, FSA/RHS & VA Home Purchase Loans
B) Conventional Home Purchase Loans
C) Refinancings
D) Home Improvement Loans
E) Loans on Dwellings For 5+ Families
F) Non-occupant Loans on < 5 Family Dwellings (A B C & D)
Number
Average Value
Number
Average Value
Number
Average Value
Number
Average Value
Number
Average Value
Number
Average Value
LOANS ORIGINATED
32
$71,811
148
$78,518
423
$65,260
123
$23,319
9
$738,119
95
$57,038
APPLICATIONS APPROVED, NOT ACCEPTED
6
$51,708
20
$50,640
149
$52,328
32
$17,577
2
$49,875
13
$54,198
APPLICATIONS DENIED
7
$55,004
47
$44,479
357
$60,669
113
$18,558
0
$0
32
$46,609
APPLICATIONS WITHDRAWN
5
$55,108
28
$111,446
208
$57,290
31
$15,245
0
$0
9
$107,417
FILES CLOSED FOR INCOMPLETENESS
0
$0
3
$57,707
39
$96,222
3
$36,707
0
$0
7
$54,324
Aggregated Statistics For Year 2000 (Based on 2 full and 8 partial tracts)
A) FHA, FSA/RHS & VA Home Purchase Loans
B) Conventional Home Purchase Loans
C) Refinancings
D) Home Improvement Loans
E) Loans on Dwellings For 5+ Families
F) Non-occupant Loans on < 5 Family Dwellings (A B C & D)
Number
Average Value
Number
Average Value
Number
Average Value
Number
Average Value
Number
Average Value
Number
Average Value
LOANS ORIGINATED
51
$56,169
206
$73,283
263
$60,043
109
$18,168
5
$130,492
78
$48,287
APPLICATIONS APPROVED, NOT ACCEPTED
0
$0
21
$76,936
87
$53,378
22
$21,556
2
$245,600
17
$46,556
APPLICATIONS DENIED
6
$44,325
36
$57,276
219
$44,260
105
$22,633
2
$48,600
21
$42,348
APPLICATIONS WITHDRAWN
5
$53,836
15
$157,666
111
$49,764
13
$21,680
0
$0
7
$35,929
FILES CLOSED FOR INCOMPLETENESS
0
$0
5
$35,732
25
$60,072
0
$0
0
$0
2
$24,625
Aggregated Statistics For Year 1999 (Based on 3 full and 4 partial tracts)
A) FHA, FSA/RHS & VA Home Purchase Loans
B) Conventional Home Purchase Loans
C) Refinancings
D) Home Improvement Loans
E) Loans on Dwellings For 5+ Families
F) Non-occupant Loans on < 5 Family Dwellings (A B C & D)
2004 - 2018 National Fire Incident Reporting System (NFIRS) incidents
Based on the data from the years 2004 - 2018 the average number of fires per year is 16. The highest number of fire incidents - 38 took place in 2009, and the least - 0 in 2012. The data has a growing trend.
When looking into fire subcategories, the most reports belonged to: Outside Fires (38.2%), and Structure Fires (35.3%).
Fire incident types reported to NFIRS in Zip Code 15211

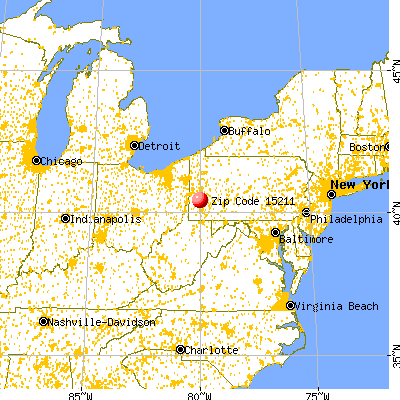


 Nearest zip codes: 15290, 15222, 15216, 15220, 15219, 15226.


 Based on the data from the years 2004 - 2018 the average number of fires per year is 16. The highest number of fire incidents - 38 took place in 2009, and the least - 0 in 2012. The data has a growing trend.
 When looking into fire subcategories, the most reports belonged to: Outside Fires (38.2%), and Structure Fires (35.3%).