Estimated zip code population in 2022: 15,387
Zip code population in 2010: 13,825
Zip code population in 2000: 13,677
Houses and condos: 6,711
Renter-occupied apartments: 1,648
% of renters here:
26%State:
31%
March 2022 cost of living index in zip code 15229: 94.1
(less than average, U.S. average is 100)
Land area: 4.0
sq. mi.
Water area: 0.0
sq. mi.
Population density: 3,805 people per square mile (average).
OSM Map
General Map
Google Map
MSN Map
OSM Map
General Map
Google Map
MSN Map
OSM Map
General Map
Google Map
MSN Map
OSM Map
General Map
Google Map
MSN Map
Please wait while loading the map...
Real estate property taxes paid for housing units in 2022:
This zip code:
1.4% ($3,345)Pennsylvania:
1.3% ($3,094)
Median real estate property taxes paid for housing units with mortgages in 2022: $3,445 (1.3%)
Median real estate property taxes paid for housing units with no mortgage in 2022: $3,181 (1.6%)
Profiles of local businesses
Business Search - 14 Million verified businesses
Males: 7,215 Females: 8,172
For population 25 years and over in 15229:
High school or higher: 97.8%Bachelor's degree or higher: 43.4%Graduate or professional degree: 17.4%Unemployed: 3.4%Mean travel time to work (commute): 22.5 minutes
For population 15 years and over in 15229:
Never married: 31.9%Now married: 52.5%Separated: 0.9%Widowed: 5.9%Divorced: 8.7%
Zip code 15229 compared to state average:
Black race population percentage below state average. Hispanic race population percentage significantly below state average. Foreign-born population percentage below state average. 13,604 88.4% White 630 4.1% Black 432 2.8% Hispanic or Latino 352 2.3% Two or more races 321 2.1% Asian 41 0.3% Some other race 3 0.02% Native Hawaiian and Other
Data:
Median household income ($)
Median household income (% change since 2000)
Household income diversity
Ratio of average income to average house value (%)
Ratio of average income to average rent
Median household income ($) - White
Median household income ($) - Black or African American
Median household income ($) - Asian
Median household income ($) - Hispanic or Latino
Median household income ($) - American Indian and Alaska Native
Median household income ($) - Multirace
Median household income ($) - Other Race
Median household income for houses/condos with a mortgage ($)
Median household income for apartments without a mortgage ($)
Races - White alone (%)
Races - White alone (% change since 2000)
Races - Black alone (%)
Races - Black alone (% change since 2000)
Races - American Indian alone (%)
Races - American Indian alone (% change since 2000)
Races - Asian alone (%)
Races - Asian alone (% change since 2000)
Races - Hispanic (%)
Races - Hispanic (% change since 2000)
Races - Native Hawaiian and Other Pacific Islander alone (%)
Races - Native Hawaiian and Other Pacific Islander alone (% change since 2000)
Races - Two or more races (%)
Races - Two or more races (% change since 2000)
Races - Other race alone (%)
Races - Other race alone (% change since 2000)
Racial diversity
Unemployment (%)
Unemployment (% change since 2000)
Unemployment (%) - White
Unemployment (%) - Black or African American
Unemployment (%) - Asian
Unemployment (%) - Hispanic or Latino
Unemployment (%) - American Indian and Alaska Native
Unemployment (%) - Multirace
Unemployment (%) - Other Race
Population density (people per square mile)
Population - Males (%)
Population - Females (%)
Population - Males (%) - White
Population - Males (%) - Black or African American
Population - Males (%) - Asian
Population - Males (%) - Hispanic or Latino
Population - Males (%) - American Indian and Alaska Native
Population - Males (%) - Multirace
Population - Males (%) - Other Race
Population - Females (%) - White
Population - Females (%) - Black or African American
Population - Females (%) - Asian
Population - Females (%) - Hispanic or Latino
Population - Females (%) - American Indian and Alaska Native
Population - Females (%) - Multirace
Population - Females (%) - Other Race
Coronavirus confirmed cases (Apr 27, 2024)
Deaths caused by coronavirus (Apr 27, 2024)
Coronavirus confirmed cases (per 100k population) (Apr 27, 2024)
Deaths caused by coronavirus (per 100k population) (Apr 27, 2024)
Daily increase in number of cases (Apr 27, 2024)
Weekly increase in number of cases (Apr 27, 2024)
Cases doubled (in days) (Apr 27, 2024)
Hospitalized patients (Apr 18, 2022)
Negative test results (Apr 18, 2022)
Total test results (Apr 18, 2022)
COVID Vaccine doses distributed (per 100k population) (Sep 19, 2023)
COVID Vaccine doses administered (per 100k population) (Sep 19, 2023)
COVID Vaccine doses distributed (Sep 19, 2023)
COVID Vaccine doses administered (Sep 19, 2023)
Likely homosexual households (%)
Likely homosexual households (% change since 2000)
Likely homosexual households - Lesbian couples (%)
Likely homosexual households - Lesbian couples (% change since 2000)
Likely homosexual households - Gay men (%)
Likely homosexual households - Gay men (% change since 2000)
Cost of living index
Median gross rent ($)
Median contract rent ($)
Median monthly housing costs ($)
Median house or condo value ($)
Median house or condo value ($ change since 2000)
Mean house or condo value by units in structure - 1, detached ($)
Mean house or condo value by units in structure - 1, attached ($)
Mean house or condo value by units in structure - 2 ($)
Mean house or condo value by units in structure by units in structure - 3 or 4 ($)
Mean house or condo value by units in structure - 5 or more ($)
Mean house or condo value by units in structure - Boat, RV, van, etc. ($)
Mean house or condo value by units in structure - Mobile home ($)
Median house or condo value ($) - White
Median house or condo value ($) - Black or African American
Median house or condo value ($) - Asian
Median house or condo value ($) - Hispanic or Latino
Median house or condo value ($) - American Indian and Alaska Native
Median house or condo value ($) - Multirace
Median house or condo value ($) - Other Race
Median resident age
Resident age diversity
Median resident age - Males
Median resident age - Females
Median resident age - White
Median resident age - Black or African American
Median resident age - Asian
Median resident age - Hispanic or Latino
Median resident age - American Indian and Alaska Native
Median resident age - Multirace
Median resident age - Other Race
Median resident age - Males - White
Median resident age - Males - Black or African American
Median resident age - Males - Asian
Median resident age - Males - Hispanic or Latino
Median resident age - Males - American Indian and Alaska Native
Median resident age - Males - Multirace
Median resident age - Males - Other Race
Median resident age - Females - White
Median resident age - Females - Black or African American
Median resident age - Females - Asian
Median resident age - Females - Hispanic or Latino
Median resident age - Females - American Indian and Alaska Native
Median resident age - Females - Multirace
Median resident age - Females - Other Race
Commute - mean travel time to work (minutes)
Travel time to work - Less than 5 minutes (%)
Travel time to work - Less than 5 minutes (% change since 2000)
Travel time to work - 5 to 9 minutes (%)
Travel time to work - 5 to 9 minutes (% change since 2000)
Travel time to work - 10 to 19 minutes (%)
Travel time to work - 10 to 19 minutes (% change since 2000)
Travel time to work - 20 to 29 minutes (%)
Travel time to work - 20 to 29 minutes (% change since 2000)
Travel time to work - 30 to 39 minutes (%)
Travel time to work - 30 to 39 minutes (% change since 2000)
Travel time to work - 40 to 59 minutes (%)
Travel time to work - 40 to 59 minutes (% change since 2000)
Travel time to work - 60 to 89 minutes (%)
Travel time to work - 60 to 89 minutes (% change since 2000)
Travel time to work - 90 or more minutes (%)
Travel time to work - 90 or more minutes (% change since 2000)
Marital status - Never married (%)
Marital status - Now married (%)
Marital status - Separated (%)
Marital status - Widowed (%)
Marital status - Divorced (%)
Median family income ($)
Median family income (% change since 2000)
Median non-family income ($)
Median non-family income (% change since 2000)
Median per capita income ($)
Median per capita income (% change since 2000)
Median family income ($) - White
Median family income ($) - Black or African American
Median family income ($) - Asian
Median family income ($) - Hispanic or Latino
Median family income ($) - American Indian and Alaska Native
Median family income ($) - Multirace
Median family income ($) - Other Race
Median year house/condo built
Median year apartment built
Year house built - Built 2005 or later (%)
Year house built - Built 2000 to 2004 (%)
Year house built - Built 1990 to 1999 (%)
Year house built - Built 1980 to 1989 (%)
Year house built - Built 1970 to 1979 (%)
Year house built - Built 1960 to 1969 (%)
Year house built - Built 1950 to 1959 (%)
Year house built - Built 1940 to 1949 (%)
Year house built - Built 1939 or earlier (%)
Average household size
Household density (households per square mile)
Average household size - White
Average household size - Black or African American
Average household size - Asian
Average household size - Hispanic or Latino
Average household size - American Indian and Alaska Native
Average household size - Multirace
Average household size - Other Race
Occupied housing units (%)
Vacant housing units (%)
Owner occupied housing units (%)
Renter occupied housing units (%)
Vacancy status - For rent (%)
Vacancy status - For sale only (%)
Vacancy status - Rented or sold, not occupied (%)
Vacancy status - For seasonal, recreational, or occasional use (%)
Vacancy status - For migrant workers (%)
Vacancy status - Other vacant (%)
Residents with income below the poverty level (%)
Residents with income below 50% of the poverty level (%)
Children below poverty level (%)
Poor families by family type - Married-couple family (%)
Poor families by family type - Male, no wife present (%)
Poor families by family type - Female, no husband present (%)
Poverty status for native-born residents (%)
Poverty status for foreign-born residents (%)
Poverty among high school graduates not in families (%)
Poverty among people who did not graduate high school not in families (%)
Residents with income below the poverty level (%) - White
Residents with income below the poverty level (%) - Black or African American
Residents with income below the poverty level (%) - Asian
Residents with income below the poverty level (%) - Hispanic or Latino
Residents with income below the poverty level (%) - American Indian and Alaska Native
Residents with income below the poverty level (%) - Multirace
Residents with income below the poverty level (%) - Other Race
Air pollution - Air Quality Index (AQI)
Air pollution - CO
Air pollution - NO2
Air pollution - SO2
Air pollution - Ozone
Air pollution - PM10
Air pollution - PM25
Air pollution - Pb
Crime - Murders per 100,000 population
Crime - Rapes per 100,000 population
Crime - Robberies per 100,000 population
Crime - Assaults per 100,000 population
Crime - Burglaries per 100,000 population
Crime - Thefts per 100,000 population
Crime - Auto thefts per 100,000 population
Crime - Arson per 100,000 population
Crime - City-data.com crime index
Crime - Violent crime index
Crime - Property crime index
Crime - Murders per 100,000 population (5 year average)
Crime - Rapes per 100,000 population (5 year average)
Crime - Robberies per 100,000 population (5 year average)
Crime - Assaults per 100,000 population (5 year average)
Crime - Burglaries per 100,000 population (5 year average)
Crime - Thefts per 100,000 population (5 year average)
Crime - Auto thefts per 100,000 population (5 year average)
Crime - Arson per 100,000 population (5 year average)
Crime - City-data.com crime index (5 year average)
Crime - Violent crime index (5 year average)
Crime - Property crime index (5 year average)
1996 Presidential Elections Results (%) - Democratic Party (Clinton)
1996 Presidential Elections Results (%) - Republican Party (Dole)
1996 Presidential Elections Results (%) - Other
2000 Presidential Elections Results (%) - Democratic Party (Gore)
2000 Presidential Elections Results (%) - Republican Party (Bush)
2000 Presidential Elections Results (%) - Other
2004 Presidential Elections Results (%) - Democratic Party (Kerry)
2004 Presidential Elections Results (%) - Republican Party (Bush)
2004 Presidential Elections Results (%) - Other
2008 Presidential Elections Results (%) - Democratic Party (Obama)
2008 Presidential Elections Results (%) - Republican Party (McCain)
2008 Presidential Elections Results (%) - Other
2012 Presidential Elections Results (%) - Democratic Party (Obama)
2012 Presidential Elections Results (%) - Republican Party (Romney)
2012 Presidential Elections Results (%) - Other
2016 Presidential Elections Results (%) - Democratic Party (Clinton)
2016 Presidential Elections Results (%) - Republican Party (Trump)
2016 Presidential Elections Results (%) - Other
2020 Presidential Elections Results (%) - Democratic Party (Biden)
2020 Presidential Elections Results (%) - Republican Party (Trump)
2020 Presidential Elections Results (%) - Other
Ancestries Reported - Arab (%)
Ancestries Reported - Czech (%)
Ancestries Reported - Danish (%)
Ancestries Reported - Dutch (%)
Ancestries Reported - English (%)
Ancestries Reported - French (%)
Ancestries Reported - French Canadian (%)
Ancestries Reported - German (%)
Ancestries Reported - Greek (%)
Ancestries Reported - Hungarian (%)
Ancestries Reported - Irish (%)
Ancestries Reported - Italian (%)
Ancestries Reported - Lithuanian (%)
Ancestries Reported - Norwegian (%)
Ancestries Reported - Polish (%)
Ancestries Reported - Portuguese (%)
Ancestries Reported - Russian (%)
Ancestries Reported - Scotch-Irish (%)
Ancestries Reported - Scottish (%)
Ancestries Reported - Slovak (%)
Ancestries Reported - Subsaharan African (%)
Ancestries Reported - Swedish (%)
Ancestries Reported - Swiss (%)
Ancestries Reported - Ukrainian (%)
Ancestries Reported - United States (%)
Ancestries Reported - Welsh (%)
Ancestries Reported - West Indian (%)
Ancestries Reported - Other (%)
Educational Attainment - No schooling completed (%)
Educational Attainment - Less than high school (%)
Educational Attainment - High school or equivalent (%)
Educational Attainment - Less than 1 year of college (%)
Educational Attainment - 1 or more years of college (%)
Educational Attainment - Associate degree (%)
Educational Attainment - Bachelor's degree (%)
Educational Attainment - Master's degree (%)
Educational Attainment - Professional school degree (%)
Educational Attainment - Doctorate degree (%)
School Enrollment - Nursery, preschool (%)
School Enrollment - Kindergarten (%)
School Enrollment - Grade 1 to 4 (%)
School Enrollment - Grade 5 to 8 (%)
School Enrollment - Grade 9 to 12 (%)
School Enrollment - College undergrad (%)
School Enrollment - Graduate or professional (%)
School Enrollment - Not enrolled in school (%)
School enrollment - Public schools (%)
School enrollment - Private schools (%)
School enrollment - Not enrolled (%)
Median number of rooms in houses and condos
Median number of rooms in apartments
Housing units lacking complete plumbing facilities (%)
Housing units lacking complete kitchen facilities (%)
Density of houses
Urban houses (%)
Rural houses (%)
Households with people 60 years and over (%)
Households with people 65 years and over (%)
Households with people 75 years and over (%)
Households with one or more nonrelatives (%)
Households with no nonrelatives (%)
Population in households (%)
Family households (%)
Nonfamily households (%)
Population in families (%)
Family households with own children (%)
Median number of bedrooms in owner occupied houses
Mean number of bedrooms in owner occupied houses
Median number of bedrooms in renter occupied houses
Mean number of bedrooms in renter occupied houses
Median number of vehichles in owner occupied houses
Mean number of vehichles in owner occupied houses
Median number of vehichles in renter occupied houses
Mean number of vehichles in renter occupied houses
Mortgage status - with mortgage (%)
Mortgage status - with second mortgage (%)
Mortgage status - with home equity loan (%)
Mortgage status - with both second mortgage and home equity loan (%)
Mortgage status - without a mortgage (%)
Average family size
Average family size - White
Average family size - Black or African American
Average family size - Asian
Average family size - Hispanic or Latino
Average family size - American Indian and Alaska Native
Average family size - Multirace
Average family size - Other Race
Geographical mobility - Same house 1 year ago (%)
Geographical mobility - Moved within same county (%)
Geographical mobility - Moved from different county within same state (%)
Geographical mobility - Moved from different state (%)
Geographical mobility - Moved from abroad (%)
Place of birth - Born in state of residence (%)
Place of birth - Born in other state (%)
Place of birth - Native, outside of US (%)
Place of birth - Foreign born (%)
Housing units in structures - 1, detached (%)
Housing units in structures - 1, attached (%)
Housing units in structures - 2 (%)
Housing units in structures - 3 or 4 (%)
Housing units in structures - 5 to 9 (%)
Housing units in structures - 10 to 19 (%)
Housing units in structures - 20 to 49 (%)
Housing units in structures - 50 or more (%)
Housing units in structures - Mobile home (%)
Housing units in structures - Boat, RV, van, etc. (%)
House/condo owner moved in on average (years ago)
Renter moved in on average (years ago)
Year householder moved into unit - Moved in 1999 to March 2000 (%)
Year householder moved into unit - Moved in 1995 to 1998 (%)
Year householder moved into unit - Moved in 1990 to 1994 (%)
Year householder moved into unit - Moved in 1980 to 1989 (%)
Year householder moved into unit - Moved in 1970 to 1979 (%)
Year householder moved into unit - Moved in 1969 or earlier (%)
Means of transportation to work - Drove car alone (%)
Means of transportation to work - Carpooled (%)
Means of transportation to work - Public transportation (%)
Means of transportation to work - Bus or trolley bus (%)
Means of transportation to work - Streetcar or trolley car (%)
Means of transportation to work - Subway or elevated (%)
Means of transportation to work - Railroad (%)
Means of transportation to work - Ferryboat (%)
Means of transportation to work - Taxicab (%)
Means of transportation to work - Motorcycle (%)
Means of transportation to work - Bicycle (%)
Means of transportation to work - Walked (%)
Means of transportation to work - Other means (%)
Working at home (%)
Industry diversity
Most Common Industries - Agriculture, forestry, fishing and hunting, and mining (%)
Most Common Industries - Agriculture, forestry, fishing and hunting (%)
Most Common Industries - Mining, quarrying, and oil and gas extraction (%)
Most Common Industries - Construction (%)
Most Common Industries - Manufacturing (%)
Most Common Industries - Wholesale trade (%)
Most Common Industries - Retail trade (%)
Most Common Industries - Transportation and warehousing, and utilities (%)
Most Common Industries - Transportation and warehousing (%)
Most Common Industries - Utilities (%)
Most Common Industries - Information (%)
Most Common Industries - Finance and insurance, and real estate and rental and leasing (%)
Most Common Industries - Finance and insurance (%)
Most Common Industries - Real estate and rental and leasing (%)
Most Common Industries - Professional, scientific, and management, and administrative and waste management services (%)
Most Common Industries - Professional, scientific, and technical services (%)
Most Common Industries - Management of companies and enterprises (%)
Most Common Industries - Administrative and support and waste management services (%)
Most Common Industries - Educational services, and health care and social assistance (%)
Most Common Industries - Educational services (%)
Most Common Industries - Health care and social assistance (%)
Most Common Industries - Arts, entertainment, and recreation, and accommodation and food services (%)
Most Common Industries - Arts, entertainment, and recreation (%)
Most Common Industries - Accommodation and food services (%)
Most Common Industries - Other services, except public administration (%)
Most Common Industries - Public administration (%)
Occupation diversity
Most Common Occupations - Management, business, science, and arts occupations (%)
Most Common Occupations - Management, business, and financial occupations (%)
Most Common Occupations - Management occupations (%)
Most Common Occupations - Business and financial operations occupations (%)
Most Common Occupations - Computer, engineering, and science occupations (%)
Most Common Occupations - Computer and mathematical occupations (%)
Most Common Occupations - Architecture and engineering occupations (%)
Most Common Occupations - Life, physical, and social science occupations (%)
Most Common Occupations - Education, legal, community service, arts, and media occupations (%)
Most Common Occupations - Community and social service occupations (%)
Most Common Occupations - Legal occupations (%)
Most Common Occupations - Education, training, and library occupations (%)
Most Common Occupations - Arts, design, entertainment, sports, and media occupations (%)
Most Common Occupations - Healthcare practitioners and technical occupations (%)
Most Common Occupations - Health diagnosing and treating practitioners and other technical occupations (%)
Most Common Occupations - Health technologists and technicians (%)
Most Common Occupations - Service occupations (%)
Most Common Occupations - Healthcare support occupations (%)
Most Common Occupations - Protective service occupations (%)
Most Common Occupations - Fire fighting and prevention, and other protective service workers including supervisors (%)
Most Common Occupations - Law enforcement workers including supervisors (%)
Most Common Occupations - Food preparation and serving related occupations (%)
Most Common Occupations - Building and grounds cleaning and maintenance occupations (%)
Most Common Occupations - Personal care and service occupations (%)
Most Common Occupations - Sales and office occupations (%)
Most Common Occupations - Sales and related occupations (%)
Most Common Occupations - Office and administrative support occupations (%)
Most Common Occupations - Natural resources, construction, and maintenance occupations (%)
Most Common Occupations - Farming, fishing, and forestry occupations (%)
Most Common Occupations - Construction and extraction occupations (%)
Most Common Occupations - Installation, maintenance, and repair occupations (%)
Most Common Occupations - Production, transportation, and material moving occupations (%)
Most Common Occupations - Production occupations (%)
Most Common Occupations - Transportation occupations (%)
Most Common Occupations - Material moving occupations (%)
People in Group quarters - Institutionalized population (%)
People in Group quarters - Correctional institutions (%)
People in Group quarters - Federal prisons and detention centers (%)
People in Group quarters - Halfway houses (%)
People in Group quarters - Local jails and other confinement facilities (including police lockups) (%)
People in Group quarters - Military disciplinary barracks (%)
People in Group quarters - State prisons (%)
People in Group quarters - Other types of correctional institutions (%)
People in Group quarters - Nursing homes (%)
People in Group quarters - Hospitals/wards, hospices, and schools for the handicapped (%)
People in Group quarters - Hospitals/wards and hospices for chronically ill (%)
People in Group quarters - Hospices or homes for chronically ill (%)
People in Group quarters - Military hospitals or wards for chronically ill (%)
People in Group quarters - Other hospitals or wards for chronically ill (%)
People in Group quarters - Hospitals or wards for drug/alcohol abuse (%)
People in Group quarters - Mental (Psychiatric) hospitals or wards (%)
People in Group quarters - Schools, hospitals, or wards for the mentally retarded (%)
People in Group quarters - Schools, hospitals, or wards for the physically handicapped (%)
People in Group quarters - Institutions for the deaf (%)
People in Group quarters - Institutions for the blind (%)
People in Group quarters - Orthopedic wards and institutions for the physically handicapped (%)
People in Group quarters - Wards in general hospitals for patients who have no usual home elsewhere (%)
People in Group quarters - Wards in military hospitals for patients who have no usual home elsewhere (%)
People in Group quarters - Juvenile institutions (%)
People in Group quarters - Long-term care (%)
People in Group quarters - Homes for abused, dependent, and neglected children (%)
People in Group quarters - Residential treatment centers for emotionally disturbed children (%)
People in Group quarters - Training schools for juvenile delinquents (%)
People in Group quarters - Short-term care, detention or diagnostic centers for delinquent children (%)
People in Group quarters - Type of juvenile institution unknown (%)
People in Group quarters - Noninstitutionalized population (%)
People in Group quarters - College dormitories (includes college quarters off campus) (%)
People in Group quarters - Military quarters (%)
People in Group quarters - On base (%)
People in Group quarters - Barracks, unaccompanied personnel housing (UPH), (Enlisted/Officer), ;and similar group living quarters for military personnel (%)
People in Group quarters - Transient quarters for temporary residents (%)
People in Group quarters - Military ships (%)
People in Group quarters - Group homes (%)
People in Group quarters - Homes or halfway houses for drug/alcohol abuse (%)
People in Group quarters - Homes for the mentally ill (%)
People in Group quarters - Homes for the mentally retarded (%)
People in Group quarters - Homes for the physically handicapped (%)
People in Group quarters - Other group homes (%)
People in Group quarters - Religious group quarters (%)
People in Group quarters - Dormitories (%)
People in Group quarters - Agriculture workers' dormitories on farms (%)
People in Group quarters - Job Corps and vocational training facilities (%)
People in Group quarters - Other workers' dormitories (%)
People in Group quarters - Crews of maritime vessels (%)
People in Group quarters - Other nonhousehold living situations (%)
People in Group quarters - Other noninstitutional group quarters (%)
Residents speaking English at home (%)
Residents speaking English at home - Born in the United States (%)
Residents speaking English at home - Native, born elsewhere (%)
Residents speaking English at home - Foreign born (%)
Residents speaking Spanish at home (%)
Residents speaking Spanish at home - Born in the United States (%)
Residents speaking Spanish at home - Native, born elsewhere (%)
Residents speaking Spanish at home - Foreign born (%)
Residents speaking other language at home (%)
Residents speaking other language at home - Born in the United States (%)
Residents speaking other language at home - Native, born elsewhere (%)
Residents speaking other language at home - Foreign born (%)
Class of Workers - Employee of private company (%)
Class of Workers - Self-employed in own incorporated business (%)
Class of Workers - Private not-for-profit wage and salary workers (%)
Class of Workers - Local government workers (%)
Class of Workers - State government workers (%)
Class of Workers - Federal government workers (%)
Class of Workers - Self-employed workers in own not incorporated business and Unpaid family workers (%)
House heating fuel used in houses and condos - Utility gas (%)
House heating fuel used in houses and condos - Bottled, tank, or LP gas (%)
House heating fuel used in houses and condos - Electricity (%)
House heating fuel used in houses and condos - Fuel oil, kerosene, etc. (%)
House heating fuel used in houses and condos - Coal or coke (%)
House heating fuel used in houses and condos - Wood (%)
House heating fuel used in houses and condos - Solar energy (%)
House heating fuel used in houses and condos - Other fuel (%)
House heating fuel used in houses and condos - No fuel used (%)
House heating fuel used in apartments - Utility gas (%)
House heating fuel used in apartments - Bottled, tank, or LP gas (%)
House heating fuel used in apartments - Electricity (%)
House heating fuel used in apartments - Fuel oil, kerosene, etc. (%)
House heating fuel used in apartments - Coal or coke (%)
House heating fuel used in apartments - Wood (%)
House heating fuel used in apartments - Solar energy (%)
House heating fuel used in apartments - Other fuel (%)
House heating fuel used in apartments - No fuel used (%)
Armed forces status - In Armed Forces (%)
Armed forces status - Civilian (%)
Armed forces status - Civilian - Veteran (%)
Armed forces status - Civilian - Nonveteran (%)
Fatal accidents locations in years 2005-2021
Fatal accidents locations in 2005
Fatal accidents locations in 2006
Fatal accidents locations in 2007
Fatal accidents locations in 2008
Fatal accidents locations in 2009
Fatal accidents locations in 2010
Fatal accidents locations in 2011
Fatal accidents locations in 2012
Fatal accidents locations in 2013
Fatal accidents locations in 2014
Fatal accidents locations in 2015
Fatal accidents locations in 2016
Fatal accidents locations in 2017
Fatal accidents locations in 2018
Fatal accidents locations in 2019
Fatal accidents locations in 2020
Fatal accidents locations in 2021
Alcohol use - People drinking some alcohol every month (%)
Alcohol use - People not drinking at all (%)
Alcohol use - Average days/month drinking alcohol
Alcohol use - Average drinks/week
Alcohol use - Average days/year people drink much
Audiometry - Average condition of hearing (%)
Audiometry - People that can hear a whisper from across a quiet room (%)
Audiometry - People that can hear normal voice from across a quiet room (%)
Audiometry - Ears ringing, roaring, buzzing (%)
Audiometry - Had a job exposure to loud noise (%)
Audiometry - Had off-work exposure to loud noise (%)
Blood Pressure & Cholesterol - Has high blood pressure (%)
Blood Pressure & Cholesterol - Checking blood pressure at home (%)
Blood Pressure & Cholesterol - Frequently checking blood cholesterol (%)
Blood Pressure & Cholesterol - Has high cholesterol level (%)
Consumer Behavior - Money monthly spent on food at supermarket/grocery store
Consumer Behavior - Money monthly spent on food at other stores
Consumer Behavior - Money monthly spent on eating out
Consumer Behavior - Money monthly spent on carryout/delivered foods
Consumer Behavior - Income spent on food at supermarket/grocery store (%)
Consumer Behavior - Income spent on food at other stores (%)
Consumer Behavior - Income spent on eating out (%)
Consumer Behavior - Income spent on carryout/delivered foods (%)
Current Health Status - General health condition (%)
Current Health Status - Blood donors (%)
Current Health Status - Has blood ever tested for HIV virus (%)
Current Health Status - Left-handed people (%)
Dermatology - People using sunscreen (%)
Diabetes - Diabetics (%)
Diabetes - Had a blood test for high blood sugar (%)
Diabetes - People taking insulin (%)
Diet Behavior & Nutrition - Diet health (%)
Diet Behavior & Nutrition - Milk product consumption (# of products/month)
Diet Behavior & Nutrition - Meals not home prepared (#/week)
Diet Behavior & Nutrition - Meals from fast food or pizza place (#/week)
Diet Behavior & Nutrition - Ready-to-eat foods (#/month)
Diet Behavior & Nutrition - Frozen meals/pizza (#/month)
Drug Use - People that ever used marijuana or hashish (%)
Drug Use - Ever used hard drugs (%)
Drug Use - Ever used any form of cocaine (%)
Drug Use - Ever used heroin (%)
Drug Use - Ever used methamphetamine (%)
Health Insurance - People covered by health insurance (%)
Kidney Conditions-Urology - Avg. # of times urinating at night
Medical Conditions - People with asthma (%)
Medical Conditions - People with anemia (%)
Medical Conditions - People with psoriasis (%)
Medical Conditions - People with overweight (%)
Medical Conditions - Elderly people having difficulties in thinking or remembering (%)
Medical Conditions - People who ever received blood transfusion (%)
Medical Conditions - People having trouble seeing even with glass/contacts (%)
Medical Conditions - People with arthritis (%)
Medical Conditions - People with gout (%)
Medical Conditions - People with congestive heart failure (%)
Medical Conditions - People with coronary heart disease (%)
Medical Conditions - People with angina pectoris (%)
Medical Conditions - People who ever had heart attack (%)
Medical Conditions - People who ever had stroke (%)
Medical Conditions - People with emphysema (%)
Medical Conditions - People with thyroid problem (%)
Medical Conditions - People with chronic bronchitis (%)
Medical Conditions - People with any liver condition (%)
Medical Conditions - People who ever had cancer or malignancy (%)
Mental Health - People who have little interest in doing things (%)
Mental Health - People feeling down, depressed, or hopeless (%)
Mental Health - People who have trouble sleeping or sleeping too much (%)
Mental Health - People feeling tired or having little energy (%)
Mental Health - People with poor appetite or overeating (%)
Mental Health - People feeling bad about themself (%)
Mental Health - People who have trouble concentrating on things (%)
Mental Health - People moving or speaking slowly or too fast (%)
Mental Health - People having thoughts they would be better off dead (%)
Oral Health - Average years since last visit a dentist
Oral Health - People embarrassed because of mouth (%)
Oral Health - People with gum disease (%)
Oral Health - General health of teeth and gums (%)
Oral Health - Average days a week using dental floss/device
Oral Health - Average days a week using mouthwash for dental problem
Oral Health - Average number of teeth
Pesticide Use - Households using pesticides to control insects (%)
Pesticide Use - Households using pesticides to kill weeds (%)
Physical Activity - People doing vigorous-intensity work activities (%)
Physical Activity - People doing moderate-intensity work activities (%)
Physical Activity - People walking or bicycling (%)
Physical Activity - People doing vigorous-intensity recreational activities (%)
Physical Activity - People doing moderate-intensity recreational activities (%)
Physical Activity - Average hours a day doing sedentary activities
Physical Activity - Average hours a day watching TV or videos
Physical Activity - Average hours a day using computer
Physical Functioning - People having limitations keeping them from working (%)
Physical Functioning - People limited in amount of work they can do (%)
Physical Functioning - People that need special equipment to walk (%)
Physical Functioning - People experiencing confusion/memory problems (%)
Physical Functioning - People requiring special healthcare equipment (%)
Prescription Medications - Average number of prescription medicines taking
Preventive Aspirin Use - Adults 40+ taking low-dose aspirin (%)
Reproductive Health - Vaginal deliveries (%)
Reproductive Health - Cesarean deliveries (%)
Reproductive Health - Deliveries resulted in a live birth (%)
Reproductive Health - Pregnancies resulted in a delivery (%)
Reproductive Health - Women breastfeeding newborns (%)
Reproductive Health - Women that had a hysterectomy (%)
Reproductive Health - Women that had both ovaries removed (%)
Reproductive Health - Women that have ever taken birth control pills (%)
Reproductive Health - Women taking birth control pills (%)
Reproductive Health - Women that have ever used Depo-Provera or injectables (%)
Reproductive Health - Women that have ever used female hormones (%)
Sexual Behavior - People 18+ that ever had sex (vaginal, anal, or oral) (%)
Sexual Behavior - Males 18+ that ever had vaginal sex with a woman (%)
Sexual Behavior - Males 18+ that ever performed oral sex on a woman (%)
Sexual Behavior - Males 18+ that ever had anal sex with a woman (%)
Sexual Behavior - Males 18+ that ever had any sex with a man (%)
Sexual Behavior - Females 18+ that ever had vaginal sex with a man (%)
Sexual Behavior - Females 18+ that ever performed oral sex on a man (%)
Sexual Behavior - Females 18+ that ever had anal sex with a man (%)
Sexual Behavior - Females 18+ that ever had any kind of sex with a woman (%)
Sexual Behavior - Average age people first had sex
Sexual Behavior - Average number of female sex partners in lifetime (males 18+)
Sexual Behavior - Average number of female vaginal sex partners in lifetime (males 18+)
Sexual Behavior - Average age people first performed oral sex on a woman (18+)
Sexual Behavior - Average number of woman performed oral sex on in lifetime (18+)
Sexual Behavior - Average number of male sex partners in lifetime (males 18+)
Sexual Behavior - Average number of male anal sex partners in lifetime (males 18+)
Sexual Behavior - Average age people first performed oral sex on a man (18+)
Sexual Behavior - Average number of male oral sex partners in lifetime (18+)
Sexual Behavior - People using protection when performing oral sex (%)
Sexual Behavior - Average number of times people have vaginal or anal sex a year
Sexual Behavior - People having sex without condom (%)
Sexual Behavior - Average number of male sex partners in lifetime (females 18+)
Sexual Behavior - Average number of male vaginal sex partners in lifetime (females 18+)
Sexual Behavior - Average number of female sex partners in lifetime (females 18+)
Sexual Behavior - Circumcised males 18+ (%)
Sleep Disorders - Average hours sleeping at night
Sleep Disorders - People that has trouble sleeping (%)
Smoking-Cigarette Use - People smoking cigarettes (%)
Taste & Smell - People 40+ having problems with smell (%)
Taste & Smell - People 40+ having problems with taste (%)
Taste & Smell - People 40+ that ever had wisdom teeth removed (%)
Taste & Smell - People 40+ that ever had tonsils teeth removed (%)
Taste & Smell - People 40+ that ever had a loss of consciousness because of a head injury (%)
Taste & Smell - People 40+ that ever had a broken nose or other serious injury to face or skull (%)
Taste & Smell - People 40+ that ever had two or more sinus infections (%)
Weight - Average height (inches)
Weight - Average weight (pounds)
Weight - Average BMI
Weight - People that are obese (%)
Weight - People that ever were obese (%)
Weight - People trying to lose weight (%)
100%
urban population.
Estimated median house/condo value in 2022: $240,290
15229:
$240,290Pennsylvania:
$245,500
According to our research of Pennsylvania and other state lists, there were 7 registered sex offenders living in 15229 zip code as of April 27, 2024 . The ratio of all residents to sex offenders in zip code 15229 is 2,012 to 1.The ratio of registered sex offenders to all residents in this zip code is much lower than the state average.
Median resident age: This zip code:
38.6 yearsPennsylvania median age:
40.9 years
Average household size: This zip code:
2.4 peoplePennsylvania:
2.4 people
Averages for the 2020 tax year for zip code 15229, filed in 2021:
Average Adjusted Gross Income (AGI) in 2020: $67,970 (Individual Income Tax Returns) Here:
$67,970State:
$75,707
Salary/wage: $61,395 (reported on 82.5% of returns )Here:
$61,395State:
$62,806
(% of AGI for various income ranges: 1044.2% for AGIs below $25k , 3407.4% for AGIs $25k-50k , 6192.0% for AGIs $50k-75k , 9489.4% for AGIs $75k-100k , 16737.9% for AGIs $100k-200k , 54616.4% for AGIs over 200k ) Taxable interest for individuals: $1,000 (reported on 33.6% of returns )This zip code:
$1,000Pennsylvania:
$1,633
(% of AGI for various income ranges: 22.7% for AGIs below $25k , 19.2% for AGIs $25k-50k , 37.9% for AGIs $50k-75k , 53.6% for AGIs $75k-100k , 94.7% for AGIs $100k-200k , 434.5% for AGIs over 200k ) Ordinary dividends: $3,397 (reported on 23.8% of returns )(% of AGI for various income ranges: 41.1% for AGIs below $25k , 46.3% for AGIs $25k-50k , 76.4% for AGIs $50k-75k , 94.1% for AGIs $75k-100k , 191.5% for AGIs $100k-200k , 1837.3% for AGIs over 200k ) Net capital gain/loss in AGI: +$7,380 (reported on 19.2% of returns )Here:
+$7,380State:
+$23,522
(% of AGI for various income ranges: 13.8% for AGIs below $25k , 32.7% for AGIs $25k-50k , 67.0% for AGIs $50k-75k , 118.6% for AGIs $75k-100k , 362.6% for AGIs $100k-200k , 5277.3% for AGIs over 200k ) Profit/loss from business: +$13,153 (reported on 11.9% of returns )Here:
+$13,153State:
+$16,274
(% of AGI for various income ranges: 72.8% for AGIs below $25k , 160.7% for AGIs $25k-50k , 118.2% for AGIs $50k-75k , 194.3% for AGIs $75k-100k , 452.8% for AGIs $100k-200k , 2258.2% for AGIs over 200k ) Taxable individual retirement arrangement distribution: $15,737 (reported on 11.5% of returns )15229:
$15,737Pennsylvania:
$18,583
(% of AGI for various income ranges: 125.3% for AGIs below $25k , 122.6% for AGIs $25k-50k , 231.6% for AGIs $50k-75k , 241.4% for AGIs $75k-100k , 636.8% for AGIs $100k-200k , 1098.2% for AGIs over 200k ) Self-employed (Keogh) retirement plans: $19,067 (reported on 0.4% of returns )15229:
$19,067Pennsylvania:
$25,407
(% of AGI for various income ranges: 67.3% for AGIs $100k-200k ) Total itemized deductions: $27,600 (reported on 4.9% of returns )Here:
$27,600State:
$34,850
(% of AGI for various income ranges: 82.2% for AGIs $25k-50k , 128.9% for AGIs $50k-75k , 220.4% for AGIs $75k-100k , 336.8% for AGIs $100k-200k , 3220.0% for AGIs over 200k ) Charity contributions: $6,969 (reported on 3.7% of returns )(% of AGI for various income ranges: 8.6% for AGIs $25k-50k , 23.8% for AGIs $50k-75k , 42.8% for AGIs $75k-100k , 73.9% for AGIs $100k-200k , 655.5% for AGIs over 200k ) Taxes paid: $7,479 (reported on 4.9% of returns )(% of AGI for various income ranges: 13.1% for AGIs $25k-50k , 32.0% for AGIs $50k-75k , 78.0% for AGIs $75k-100k , 117.5% for AGIs $100k-200k , 706.4% for AGIs over 200k ) Earned income credit: $1,679 (reported on 7.9% of returns )(% of AGI for various income ranges: 38.9% for AGIs below $25k , 36.2% for AGIs $25k-50k ) Percentage of individuals using paid preparers for their 2020 taxes: 89.8%(% for various income ranges: 85.6% for AGIs below $25k , 90.8% for AGIs $25k-50k , 92.1% for AGIs $50k-75k , 90.6% for AGIs $75k-100k , 91.2% for AGIs $100k-200k , 92.6% for AGIs over 200k )
Averages for the 2012 tax year for zip code 15229, filed in 2013:
Average Adjusted Gross Income (AGI) in 2012: $52,300 (Individual Income Tax Returns) Here:
$52,300State:
$61,346
Salary/wage: $48,545 (reported on 84.4% of returns )Here:
$48,545State:
$51,902
(% of AGI for various income ranges: 67.4% for AGIs below $25k , 80.7% for AGIs $25k-50k , 81.2% for AGIs $50k-75k , 82.9% for AGIs $75k-100k , 83.0% for AGIs $100k-200k , 55.7% for AGIs over 200k ) Taxable interest for individuals: $973 (reported on 36.5% of returns )This zip code:
$973Pennsylvania:
$1,588
(% of AGI for various income ranges: 1.9% for AGIs below $25k , 0.5% for AGIs $25k-50k , 0.6% for AGIs $50k-75k , 0.5% for AGIs $75k-100k , 0.7% for AGIs $100k-200k , 0.8% for AGIs over 200k ) Ordinary dividends: $2,775 (reported on 23.7% of returns )(% of AGI for various income ranges: 2.1% for AGIs below $25k , 1.0% for AGIs $25k-50k , 1.1% for AGIs $50k-75k , 0.8% for AGIs $75k-100k , 1.2% for AGIs $100k-200k , 2.4% for AGIs over 200k ) Net capital gain/loss in AGI: +$2,605 (reported on 14.4% of returns )Here:
+$2,605State:
+$14,495
(% of AGI for various income ranges: 0.2% for AGIs $25k-50k , 0.2% for AGIs $50k-75k , 0.4% for AGIs $75k-100k , 1.0% for AGIs $100k-200k , 3.6% for AGIs over 200k ) Profit/loss from business: +$13,707 (reported on 9.9% of returns )Here:
+$13,707State:
+$16,268
(% of AGI for various income ranges: 4.9% for AGIs below $25k , 2.6% for AGIs $25k-50k , 2.0% for AGIs $50k-75k , 2.1% for AGIs $75k-100k , 2.2% for AGIs $100k-200k , 4.1% for AGIs over 200k ) Taxable individual retirement arrangement distribution: $10,535 (reported on 12.3% of returns )15229:
$10,535Pennsylvania:
$14,550
(% of AGI for various income ranges: 5.5% for AGIs below $25k , 2.4% for AGIs $25k-50k , 2.5% for AGIs $50k-75k , 2.5% for AGIs $75k-100k , 1.8% for AGIs $100k-200k , 1.8% for AGIs over 200k ) Self-employment retirement plans: $22,567 (reported on 0.4% of returns )15229:
$22,567Pennsylvania:
$20,922
Total itemized deductions: $16,341 (18% of AGI, reported on 29.9% of returns )Here:
$16,341State:
$23,538
Here:
17.8% of AGIState:
18.4% of AGI
(% of AGI for various income ranges: 6.8% for AGIs below $25k , 6.7% for AGIs $25k-50k , 9.1% for AGIs $50k-75k , 9.9% for AGIs $75k-100k , 11.3% for AGIs $100k-200k , 10.8% for AGIs over 200k ) Charity contributions: $2,430 (reported on 24.9% of returns )(% of AGI for various income ranges: 0.7% for AGIs below $25k , 0.7% for AGIs $25k-50k , 0.9% for AGIs $50k-75k , 1.2% for AGIs $75k-100k , 1.5% for AGIs $100k-200k , 2.0% for AGIs over 200k ) Taxes paid: $7,053 (reported on 29.9% of returns )(% of AGI for various income ranges: 1.6% for AGIs below $25k , 2.3% for AGIs $25k-50k , 3.8% for AGIs $50k-75k , 4.3% for AGIs $75k-100k , 5.6% for AGIs $100k-200k , 5.0% for AGIs over 200k ) Earned income credit: $1,716 (reported on 10.0% of returns )(% of AGI for various income ranges: 3.0% for AGIs below $25k , 0.6% for AGIs $25k-50k ) Percentage of individuals using paid preparers for their 2012 taxes: 40.4%(% for various income ranges: 38.1% for AGIs below $25k , 36.0% for AGIs $25k-50k , 43.7% for AGIs $50k-75k , 44.2% for AGIs $75k-100k , 45.5% for AGIs $100k-200k , 63.6% for AGIs over 200k )
Averages for the 2004 tax year for zip code 15229, filed in 2005:
Average Adjusted Gross Income (AGI) in 2004: $40,853 (Individual Income Tax Returns) Here:
$40,853State:
$48,049
Salary/wage: $38,972 (reported on 84.4% of returns )Here:
$38,972State:
$42,646
(% of AGI for various income ranges: 76.4% for AGIs below $10k , 67.9% for AGIs $10k-25k , 81.6% for AGIs $25k-50k , 85.9% for AGIs $50k-75k , 86.1% for AGIs $75k-100k , 73.7% for AGIs over 100k ) Taxable interest for individuals: $1,231 (reported on 52.7% of returns )This zip code:
$1,231Pennsylvania:
$1,657
(% of AGI for various income ranges: 5.1% for AGIs below $10k , 3.2% for AGIs $10k-25k , 1.6% for AGIs $25k-50k , 1.1% for AGIs $50k-75k , 1.2% for AGIs $75k-100k , 1.5% for AGIs over 100k ) Taxable dividends: $2,071 (reported on 28.2% of returns )(% of AGI for various income ranges: 3.3% for AGIs below $10k , 2.1% for AGIs $10k-25k , 1.2% for AGIs $25k-50k , 0.9% for AGIs $50k-75k , 1.1% for AGIs $75k-100k , 2.1% for AGIs over 100k ) Net capital gain/loss: +$2,879 (reported on 18.9% of returns )Here:
+$2,879State:
+$9,716
(% of AGI for various income ranges: -2.2% for AGIs below $10k , -0.6% for AGIs $10k-25k , 0.2% for AGIs $25k-50k , 0.5% for AGIs $50k-75k , 0.7% for AGIs $75k-100k , 5.4% for AGIs over 100k ) Profit/loss from business: +$12,436 (reported on 10.1% of returns )Here:
+$12,436State:
+$14,267
(% of AGI for various income ranges: 5.6% for AGIs below $10k , 4.9% for AGIs $10k-25k , 2.5% for AGIs $25k-50k , 2.2% for AGIs $50k-75k , 2.7% for AGIs $75k-100k , 3.9% for AGIs over 100k ) IRA payment deduction: $2,628 (reported on 3.3% of returns )15229:
$2,628Pennsylvania:
$2,903
(% of AGI for various income ranges: 0.4% for AGIs $10k-25k , 0.3% for AGIs $25k-50k , 0.2% for AGIs $50k-75k , 0.1% for AGIs $75k-100k , 0.1% for AGIs over 100k ) Self-employed pension: $11,222 (reported on 0.7% of returns )Here:
$11,222Pennsylvania:
$14,674
Total itemized deductions: $13,936 (20% of AGI, reported on 32.0% of returns )Here:
$13,936State:
$18,804
Here:
19.9% of AGIState:
19.5% of AGI
(% of AGI for various income ranges: 9.0% for AGIs below $10k , 7.2% for AGIs $10k-25k , 9.2% for AGIs $25k-50k , 12.2% for AGIs $50k-75k , 12.8% for AGIs $75k-100k , 11.7% for AGIs over 100k ) Charity contributions deductions: $2,129 (3% of AGI, reported on 29.2% of returns )Here:
3.0% of AGIState:
3.3% of AGI
(% of AGI for various income ranges: 0.4% for AGIs below $10k , 0.9% for AGIs $10k-25k , 1.1% for AGIs $25k-50k , 1.5% for AGIs $50k-75k , 1.8% for AGIs $75k-100k , 2.3% for AGIs over 100k ) Total tax: $5,367 (reported on 78.6% of returns )(% of AGI for various income ranges: 2.0% for AGIs below $10k , 4.7% for AGIs $10k-25k , 7.8% for AGIs $25k-50k , 9.2% for AGIs $50k-75k , 11.0% for AGIs $75k-100k , 17.6% for AGIs over 100k ) Earned income credit: $1,411 (reported on 8.3% of returns )Percentage of individuals using paid preparers for their 2004 taxes: 42.7%(% for various income ranges: 35.5% for AGIs below $10k , 42.9% for AGIs $10k-25k , 43.8% for AGIs $25k-50k , 45.3% for AGIs $50k-75k , 43.6% for AGIs $75k-100k , 54.3% for AGIs over 100k )
Estimated median household income in 2022: This zip code:
$78,484Pennsylvania:
$71,798
Nearest zip codes: 15237 ,
15202 ,
15214 ,
15233 ,
15290 ,
15204 .
West View Zip Code Map
Percentage of family households: This zip code:
46.9%Pennsylvania:
42.6%
Percentage of households with unmarried partners: This zip code:
5.3%Pennsylvania:
46.5%
Likely homosexual households (counted as self-reported same-sex unmarried-partner households)
Lesbian couples: 0.5% of all households Gay men: 0.1% of all households
Household received Food Stamps/SNAP in the past 12 months: 426Household did not receive Food Stamps/SNAP in the past 12 months: 5,918
Women who had a birth in the past 12 months: 457 (456 now married , 27 unmarried) Women who did not have a birth in the past 12 months: 3,262 (1,483 now married , 1,772 unmarried)
Housing units in zip code 15229 with a mortgage: 2,960 (239
second mortgage , 40
home equity loan , 155
both second mortgage and home equity loan )
Houses without a mortgage: 307
Median monthly owner costs for units with a mortgage: $1,505
Median monthly owner costs for units without a mortgage: $636
Residents with income below the poverty level in 2022:
This zip code:
9.1%Whole state:
11.8%
Residents with income below 50% of the poverty level in 2022:
This zip code:
6.0%Whole state:
6.1%
Median number of rooms in houses and condos: Median number of rooms in apartments: Notable locations in this zip code not listed on our city pages
Click to draw/clear zip code borders Notable locations in zip code 15229: (A) , Highcliff Elementary School Library (B) , Northgate Junior-Senior High School Library (C) , West View Borough Hall (D) , West View Elementary School Library (E) , West View Police Department (F) , West View Volunteer Fire Department Company 3 Substation (G) , Quaill District Firemens Association Station 249 (H) , Laurel Gardens Volunteer Fire Company Station 253 (I) , West View Volunteer Fire Department Company 1 Station 297 (J) , West View Volunteer Fire Department Company 2 Substation (K) . Display/hide their locations on the map
Churches in zip code 15229 include: (A) , Sisters of the Holy Spirit Church (B) , Hiland Church (C) , Ridgewood Assembly of God Church (D) , West View Church (E) , Martina Spiritual Renewal Center (F) , Christ Lutheran Church (G) , Mount Calvary Church (H) , Saint Johns Church (I) . Display/hide their locations on the map
Lake: (A) . Display/hide its location on the map
Park in zip code 15229: (1) . Display/hide its location on the map
Year house built (houses)
0 2020 or later630 2010 to 2019210 2000 to 2009128 1990 to 1999831 1980 to 1989527 1970 to 1979809 1960 to 19691,163 1950 to 1959722 1940 to 19491,697 1939 or earlier
Zip code 15229 household income distribution in 2022 216 Less than $10,000149 $10,000 to $14,999222 $15,000 to $19,999181 $20,000 to $24,999163 $25,000 to $29,999199 $30,000 to $34,999147 $35,000 to $39,999240 $40,000 to $44,999204 $45,000 to $49,999421 $50,000 to $59,999873 $60,000 to $74,999865 $75,000 to $99,999782 $100,000 to $124,999489 $125,000 to $149,999667 $150,000 to $199,999543 $200,000 or moreEstimate of home value of owner-occupied houses/condos in 2022 in zip code 15229 20 Less than $10,0006 $10,000 to $14,9994 $15,000 to $19,9997 $20,000 to $24,99924 $25,000 to $29,99911 $40,000 to $49,99917 $50,000 to $59,99961 $60,000 to $69,99926 $70,000 to $79,99956 $80,000 to $89,99980 $90,000 to $99,999178 $100,000 to $124,999342 $125,000 to $149,999496 $150,000 to $174,999437 $175,000 to $199,999758 $200,000 to $249,999693 $250,000 to $299,9991,003 $300,000 to $399,999190 $400,000 to $499,999131 $500,000 to $749,99928 $750,000 to $999,99922 $1,000,000 to $1,499,9993 $1,500,000 to $1,999,999Rent paid by renters in 2022 in zip code 15229 22 $200 to $24919 $300 to $34913 $350 to $39926 $450 to $49938 $500 to $54955 $550 to $59976 $600 to $649110 $650 to $699139 $700 to $74995 $750 to $799143 $800 to $899212 $900 to $999329 $1,000 to $1,24993 $1,250 to $1,49999 $1,500 to $1,99981 $2,000 to $2,49910 $2,500 to $2,99941 No cash rent
Median gross rent in 2022: $1,080.
Estimated median house (or condo) value in 2022 for: White Non-Hispanic householders: $240,563Black or African American householders: $335,206Two or more races householders: $204,560Hispanic or Latino householders: $168,830Estimated median house or condo value in 2022: $240,290
15229:
$240,290Pennsylvania:
$245,500
Lower value quartile - upper value quartile: $174,402 - $325,877
Mean price in 2022: Detached houses: $212,318Here:
$212,318State:
$317,202
Townhouses or other attached units: $285,385Here:
$285,385State:
$254,369
In 2-unit structures: $245,882Here:
$245,882State:
$249,182
In 5-or-more-unit structures: $167,012Here:
$167,012State:
$320,068
Housing units in structures:
One, detached: 4,570One, attached: 620Two: 6373 or 4: 1365 to 9: 13310 to 19: 26120 to 49: 16850 or more: 178Boats, RVs, vans, etc.: 7Unemployment : 3.4%
Means of transportation to work in zip code 15229 67.5% 5,611 Drove a car alone8.1% 676 Carpooled1.9% 160 Bus or trolley bus0.3% 22 Taxi1.6% 129 Walked0.3% 24 Other means22.1% 1,840 Worked at homeTravel time to work (commute) in zip code 15229 54 Less than 5 minutes592 5 to 9 minutes1,078 10 to 14 minutes1,068 15 to 19 minutes1,083 20 to 24 minutes538 25 to 29 minutes1,046 30 to 34 minutes301 35 to 39 minutes260 40 to 44 minutes364 45 to 59 minutes215 60 to 89 minutes18 90 or more minutes
Percentage of zip code residents living and working in this county: 93.4%
Household type by relationship:
Households: 15,387
Male householders: 3,041 (868 living alone ), Female householders: 3,336 (1,048 living alone )3,209 spouses (3,188 opposite-sex spouses ), 372 unmarried partners , (339 opposite-sex unmarried partners ), 4,194 children (4,035 natural , 105 adopted , 54 stepchildren ), 190 grandchildren , 299 brothers or sisters , 56 parents , 0 foster children , 231 other relatives , 307 non-relatives In group quarters: 143 (-1 institutionalized population )
Size of family households: 1,808 2-persons , 1,000 3-persons , 857 4-persons , 333 5-persons , 48 6-persons , 10 7-or-more-persons
Size of nonfamily households: 1,916 1-person , 355 2-persons , 24 3-persons , 4 5-persons
2,545 married couples with children. single-parent households (55 men , 383 women ).
93.3% of residents of 15229 zip code speak English at home. of residents speak Spanish at home (87% very well, 9% well, 4% not well ).of residents speak other Indo-European language at home (80% very well, 19% well, 1% not well ).of residents speak Asian or Pacific Island language at home (100% very well ).of residents speak other language at home (100% very well ).
Foreign born population: 632 (4.1%)
(40.9%
of them are naturalized citizens )
This zip code:
4.1%Whole state:
7.5%
17% Bolivia 14% Bhutan 10% El Salvador 7% St. Vincent and the Grenadines 5% Honduras 5% Cabo Verde 4% Liberia 19% German 12% Italian 10% Irish 7% Polish 6% English 5% European 3% American
Year of entry for the foreign-born population
285 2010 or later 197 2000 to 2009 64 1990 to 1999 120 Before 1990
Facilities with environmental interests located in this zip code:
ATLANTIC SVC STA (101 ROCHESTER RD in PITTSBURGH, PA)
STATE MASTER (Pennsylvania database) - RCRIS-PAD987329562, HAZARDOUS WASTE PROGRAM Conditionally Exempt Small Quantity Generators, less than 100 kg/month of hazardous waste (Resource Conservation and Recovery Act (tracking hazardous waste)) - notification Organizations: OPERNAME (CONTACT/OPERATOR)
, ATLANTIC REFINING & MARKETING (CONTACT/OWNER)
, ATLANTIC REFINING & MARKETING CORPORATION (CONTACT/OWNER)
BENEDICTINE SISTERS OF PITTSBURGH (4530 PERRYSVILLE AVENUE in PITTSBURGH, PA)
AIR MINOR (AIRS/AFS) Business SIC classification: ELEMENTARY AND SECONDARY SCHOOLSAlternative names: ST. BENEDICT ACADEMY
ARROW CLEANERS (465 PERRY HWY in PITTSBURGH, PA)
Small Quantity Generators, between 100 kg and 1000 kg of hazardous waste/month (Resource Conservation and Recovery Act (tracking hazardous waste)) - notification Organizations: OPERNAME (CONTACT/OPERATOR)
, GUIDEN, EMMA (CONTACT/OWNER)
Alternative names: ARROW CLNR SVC
AMOCO 1436 TANKS (411 PERRYVILLE AVE TANKS in PITTSBURGH, PA)
Small Quantity Generators, between 100 kg and 1000 kg of hazardous waste/month (Resource Conservation and Recovery Act (tracking hazardous waste)) - notification Organizations: AMOCO OIL COMPANY (CONTACT/OWNER)
Housing units lacking complete plumbing facilities: 1.2%
Housing units lacking complete kitchen facilities: 0.5%
84.5% Utility gas 13.8% Electricity 1.3% Bottled, tank, or LP gas
Population in 1990: 15,127.
Place of birth for U.S.-born residents:
This state: 12,419Northeast: 414Midwest: 814South: 653West: 373
70% of the 15229 zip code residents lived in the same house 5 years ago.
Out of people who lived in different houses, 79% lived in this county.
Out of people who lived in different counties, 50% lived in Pennsylvania.
91% of the 15229 zip code residents lived in the same house 1 year ago.
Out of people who lived in different houses, 58% moved from this county.
Out of people who lived in different houses, 22% moved from different county within same state.
Out of people who lived in different houses, 19% moved from different state.
Private vs. public school enrollment:
Students in private schools in grades 1 to 8 (elementary and middle school): 125
Here:
11.8%Pennsylvania:
15.7%
Students in private schools in grades 9 to 12 (high school): 18
Here:
4.3%Pennsylvania:
13.4%
Students in private undergraduate colleges: 132
Here:
27.5%Pennsylvania:
39.8%
Occupation by median earnings in the past 12 months ($)
112,745 Legal occupations 94,822 Architecture and engineering occupations 82,301 Life, physical, and social science occupations 81,198 Computer and mathematical occupations 71,533 Health diagnosing and treating practitioners and other technical occupations 69,435 Management occupations
Companies with federal contracts located in this zip code:
BOYLE CARPET SERVICE INC (5300 PERRYSVILLE RD in PITTSBURGH, PA; small business) in 2 contracts from 2002 to 2003
$13,694 with Army for Construction of Structures and Facilities -- Miscellaneous Buildings. Signed on 2002-07-11. Completion date: 2002-09-09.
with Army for Maintenance, Repair or Alteration of Real Property -- Other Administrative Facilities and Service Buildings. Signed on 2003-03-19. Completion date: 2003-05-30.
KAULE, MICHAEL J (18 HOMEKORT AVE in PITTSBURGH, PA; small business)
$8,565 with Army for Power and Hand Pumps. Taking place in WV. Signed on 2005-02-08. Completion date: 2005-02-18.
Top industries in this zip code by the number of employees in 2005:
Accommodation and Food Services: Limited-Service Restaurants (50-99 employees: 1 establishment, 20-49 employees: 2 establishments, 10-19 employees: 3 establishments, 5-9 employees: 2 establishments, 1-4 employees: 2 establishments)Construction: Masonry Contractors (100-249: 1, 10-19: 1, 1-4: 1)Other Services (except Public Administration): Religious Organizations (20-49: 4, 10-19: 1, 5-9: 3, 1-4: 6)Professional, Scientific, and Technical Services: All Other Professional, Scientific, and Technical Services (100-249: 1)Health Care and Social Assistance: Child and Youth Services (50-99: 1)Arts, Entertainment, and Recreation: Golf Courses and Country Clubs (50-99: 1)
People in group quarters in 2010:
65 people in other noninstitutional facilities
33 people in emergency and transitional shelters (with sleeping facilities) for people experiencing homelessness
5 people in group homes intended for adults
People in group quarters in 2000:
155 people in religious group quarters
42 people in nursing homes
31 people in other nonhousehold living situations
8 people in homes for the mentally retarded
5 people in homes or halfway houses for drug/alcohol abuse
Fatal accident statistics in 2011:
Fatal accident count: 1Vehicles involved in fatal accidents: 2Fatal accidents caused by drunken drivers: 0Fatalities: 1Persons involved in fatal accidents: 2Pedestrians involved in fatal accidents: 0
Home Mortgage Disclosure Act Aggregated Statistics For Year 2009(Based on 3 full and 10 partial tracts) A) FHA, FSA/RHS & VA B) Conventional C) Refinancings D) Home Improvement Loans E) Loans on Dwellings For 5+ Families F) Non-occupant Loans on Number Average Value Number Average Value Number Average Value Number Average Value Number Average Value Number Average Value
LOANS ORIGINATED 171 $123,623 119 $114,348 369 $109,313 65 $38,825 5 $934,470 18 $86,558 APPLICATIONS APPROVED, NOT ACCEPTED 7 $117,246 4 $84,800 36 $98,721 5 $77,872 0 $0 0 $0 APPLICATIONS DENIED 9 $112,619 10 $91,153 139 $112,744 34 $26,359 0 $0 12 $66,336 APPLICATIONS WITHDRAWN 11 $135,055 9 $115,903 107 $126,988 10 $58,306 0 $0 1 $73,490 FILES CLOSED FOR INCOMPLETENESS 0 $0 0 $0 12 $142,070 0 $0 0 $0 0 $0
Aggregated Statistics For Year 2008(Based on 3 full and 10 partial tracts) A) FHA, FSA/RHS & VA B) Conventional C) Refinancings D) Home Improvement Loans F) Non-occupant Loans on Number Average Value Number Average Value Number Average Value Number Average Value Number Average Value
LOANS ORIGINATED 106 $128,312 197 $117,467 205 $96,842 73 $39,149 32 $86,957 APPLICATIONS APPROVED, NOT ACCEPTED 5 $163,744 13 $106,481 24 $87,470 5 $29,218 2 $108,665 APPLICATIONS DENIED 13 $116,318 15 $100,357 217 $118,356 60 $44,964 14 $87,311 APPLICATIONS WITHDRAWN 17 $115,183 23 $103,736 49 $124,524 5 $91,072 6 $106,177 FILES CLOSED FOR INCOMPLETENESS 0 $0 5 $104,966 11 $119,712 1 $50,000 1 $51,730
Aggregated Statistics For Year 2007(Based on 3 full and 10 partial tracts) A) FHA, FSA/RHS & VA B) Conventional C) Refinancings D) Home Improvement Loans E) Loans on Dwellings For 5+ Families F) Non-occupant Loans on G) Loans On Manufactured Number Average Value Number Average Value Number Average Value Number Average Value Number Average Value Number Average Value Number Average Value
LOANS ORIGINATED 58 $113,412 343 $101,433 291 $94,854 109 $33,937 2 $100,475 39 $78,576 1 $69,830 APPLICATIONS APPROVED, NOT ACCEPTED 2 $155,120 41 $118,676 51 $89,741 15 $27,950 0 $0 5 $167,886 1 $107,000 APPLICATIONS DENIED 2 $118,210 28 $98,483 288 $108,619 73 $36,492 1 $148,770 21 $88,266 1 $16,660 APPLICATIONS WITHDRAWN 2 $174,095 25 $112,142 97 $102,615 8 $25,329 0 $0 1 $71,790 0 $0 FILES CLOSED FOR INCOMPLETENESS 0 $0 7 $85,690 22 $121,720 0 $0 0 $0 0 $0 0 $0
Aggregated Statistics For Year 2006(Based on 3 full and 10 partial tracts) A) FHA, FSA/RHS & VA B) Conventional C) Refinancings D) Home Improvement Loans E) Loans on Dwellings For 5+ Families F) Non-occupant Loans on G) Loans On Manufactured Number Average Value Number Average Value Number Average Value Number Average Value Number Average Value Number Average Value Number Average Value
LOANS ORIGINATED 55 $110,879 364 $90,674 365 $82,370 136 $33,868 2 $210,230 46 $85,201 0 $0 APPLICATIONS APPROVED, NOT ACCEPTED 0 $0 28 $86,956 58 $95,946 10 $34,605 0 $0 1 $103,460 0 $0 APPLICATIONS DENIED 3 $61,977 48 $79,983 286 $101,057 93 $40,019 0 $0 17 $79,618 1 $80,180 APPLICATIONS WITHDRAWN 7 $111,544 37 $91,515 139 $101,867 12 $73,062 0 $0 11 $80,902 0 $0 FILES CLOSED FOR INCOMPLETENESS 0 $0 5 $101,808 53 $119,787 3 $47,680 0 $0 2 $90,000 0 $0
Aggregated Statistics For Year 2005(Based on 3 full and 10 partial tracts) A) FHA, FSA/RHS & VA B) Conventional C) Refinancings D) Home Improvement Loans E) Loans on Dwellings For 5+ Families F) Non-occupant Loans on G) Loans On Manufactured Number Average Value Number Average Value Number Average Value Number Average Value Number Average Value Number Average Value Number Average Value
LOANS ORIGINATED 46 $113,733 388 $89,457 398 $85,365 87 $39,442 6 $326,192 71 $67,641 2 $62,500 APPLICATIONS APPROVED, NOT ACCEPTED 0 $0 26 $76,883 82 $101,932 13 $43,771 0 $0 7 $48,173 0 $0 APPLICATIONS DENIED 2 $90,815 32 $77,186 318 $105,481 95 $31,001 0 $0 28 $38,114 1 $19,270 APPLICATIONS WITHDRAWN 5 $109,850 28 $83,782 194 $113,240 23 $84,390 0 $0 9 $87,298 0 $0 FILES CLOSED FOR INCOMPLETENESS 0 $0 17 $98,484 34 $113,644 9 $50,448 0 $0 0 $0 0 $0
Aggregated Statistics For Year 2004(Based on 3 full and 10 partial tracts) A) FHA, FSA/RHS & VA B) Conventional C) Refinancings D) Home Improvement Loans E) Loans on Dwellings For 5+ Families F) Non-occupant Loans on G) Loans On Manufactured Number Average Value Number Average Value Number Average Value Number Average Value Number Average Value Number Average Value Number Average Value
LOANS ORIGINATED 39 $106,567 354 $92,135 585 $83,646 156 $34,789 0 $0 56 $58,693 1 $1,130 APPLICATIONS APPROVED, NOT ACCEPTED 0 $0 25 $101,685 101 $90,764 23 $24,430 0 $0 6 $78,603 1 $62,460 APPLICATIONS DENIED 0 $0 41 $87,846 312 $101,578 73 $40,105 1 $1,939,800 32 $65,796 4 $15,880 APPLICATIONS WITHDRAWN 5 $89,406 21 $87,040 166 $93,612 14 $43,837 0 $0 10 $77,316 0 $0 FILES CLOSED FOR INCOMPLETENESS 0 $0 1 $89,910 128 $103,647 7 $56,974 0 $0 3 $60,170 0 $0
Aggregated Statistics For Year 2003(Based on 3 full and 10 partial tracts) A) FHA, FSA/RHS & VA B) Conventional C) Refinancings D) Home Improvement Loans E) Loans on Dwellings For 5+ Families F) Non-occupant Loans on Number Average Value Number Average Value Number Average Value Number Average Value Number Average Value Number Average Value
LOANS ORIGINATED 48 $102,279 344 $92,346 1,269 $86,917 125 $33,537 3 $55,590 67 $86,376 APPLICATIONS APPROVED, NOT ACCEPTED 0 $0 27 $93,705 214 $86,520 38 $32,148 0 $0 7 $50,736 APPLICATIONS DENIED 3 $110,757 31 $94,288 468 $93,115 58 $22,532 0 $0 26 $64,432 APPLICATIONS WITHDRAWN 6 $80,260 32 $90,215 206 $85,691 11 $23,648 0 $0 12 $69,195 FILES CLOSED FOR INCOMPLETENESS 4 $63,782 8 $103,098 39 $86,801 4 $16,895 0 $0 7 $68,209
Aggregated Statistics For Year 2002(Based on 3 full and 6 partial tracts) A) FHA, FSA/RHS & VA B) Conventional C) Refinancings D) Home Improvement Loans E) Loans on Dwellings For 5+ Families F) Non-occupant Loans on Number Average Value Number Average Value Number Average Value Number Average Value Number Average Value Number Average Value
LOANS ORIGINATED 59 $90,118 307 $85,464 742 $83,686 102 $27,009 3 $433,093 49 $72,752 APPLICATIONS APPROVED, NOT ACCEPTED 0 $0 16 $97,781 155 $82,950 25 $33,672 0 $0 2 $89,940 APPLICATIONS DENIED 8 $102,124 27 $75,907 316 $81,987 48 $17,519 0 $0 12 $82,344 APPLICATIONS WITHDRAWN 3 $68,147 19 $80,454 177 $88,302 9 $48,901 0 $0 6 $59,118 FILES CLOSED FOR INCOMPLETENESS 3 $82,257 10 $82,863 110 $92,073 1 $22,560 0 $0 3 $94,293
Aggregated Statistics For Year 2001(Based on 3 full and 6 partial tracts) A) FHA, FSA/RHS & VA B) Conventional C) Refinancings D) Home Improvement Loans E) Loans on Dwellings For 5+ Families F) Non-occupant Loans on Number Average Value Number Average Value Number Average Value Number Average Value Number Average Value Number Average Value
LOANS ORIGINATED 61 $87,648 250 $87,946 547 $77,167 128 $23,868 2 $99,660 32 $62,347 APPLICATIONS APPROVED, NOT ACCEPTED 2 $70,760 28 $64,914 128 $67,210 27 $28,808 0 $0 4 $127,685 APPLICATIONS DENIED 3 $83,527 30 $72,410 282 $73,219 75 $23,599 0 $0 4 $67,100 APPLICATIONS WITHDRAWN 5 $81,074 18 $66,432 175 $84,353 18 $27,071 0 $0 5 $74,168 FILES CLOSED FOR INCOMPLETENESS 0 $0 4 $71,242 63 $87,547 3 $37,593 0 $0 4 $75,000
Aggregated Statistics For Year 2000(Based on 3 full and 6 partial tracts) A) FHA, FSA/RHS & VA B) Conventional C) Refinancings D) Home Improvement Loans E) Loans on Dwellings For 5+ Families F) Non-occupant Loans on Number Average Value Number Average Value Number Average Value Number Average Value Number Average Value Number Average Value
LOANS ORIGINATED 62 $81,411 263 $76,795 247 $65,987 94 $18,803 1 $464,650 33 $58,815 APPLICATIONS APPROVED, NOT ACCEPTED 3 $67,177 28 $54,189 78 $72,988 31 $17,838 0 $0 5 $37,398 APPLICATIONS DENIED 0 $0 35 $68,077 212 $65,957 59 $25,318 0 $0 9 $51,739 APPLICATIONS WITHDRAWN 4 $91,935 18 $64,069 91 $70,077 17 $24,443 0 $0 6 $30,760 FILES CLOSED FOR INCOMPLETENESS 2 $71,755 17 $74,030 45 $80,595 2 $12,970 0 $0 0 $0
Aggregated Statistics For Year 1999(Based on 2 full and 5 partial tracts) A) FHA, FSA/RHS & VA B) Conventional C) Refinancings D) Home Improvement Loans F) Non-occupant Loans on Number Average Value Number Average Value Number Average Value Number Average Value Number Average Value
LOANS ORIGINATED 50 $81,799 166 $77,808 244 $66,442 85 $23,263 31 $69,424 APPLICATIONS APPROVED, NOT ACCEPTED 0 $0 19 $63,406 81 $70,568 13 $14,131 4 $45,858 APPLICATIONS DENIED 2 $70,115 20 $52,958 132 $60,346 49 $24,737 5 $57,296 APPLICATIONS WITHDRAWN 4 $94,048 9 $83,687 75 $69,972 16 $56,377 4 $75,000 FILES CLOSED FOR INCOMPLETENESS 1 $68,950 2 $94,770 29 $63,898 0 $0 1 $66,000
Private Mortgage Insurance Companies Aggregated Statistics For Year 2009(Based on 3 full and 10 partial tracts) A) Conventional B) Refinancings Number Average Value Number Average Value
LOANS ORIGINATED 41 $124,248 16 $123,811 APPLICATIONS APPROVED, NOT ACCEPTED 7 $118,070 4 $166,142 APPLICATIONS DENIED 1 $99,100 1 $142,100 APPLICATIONS WITHDRAWN 0 $0 0 $0 FILES CLOSED FOR INCOMPLETENESS 1 $104,000 0 $0
Aggregated Statistics For Year 2008(Based on 3 full and 10 partial tracts) A) Conventional B) Refinancings C) Non-occupant Loans on D) Loans On Manufactured Number Average Value Number Average Value Number Average Value Number Average Value
LOANS ORIGINATED 82 $120,867 25 $123,551 3 $77,123 1 $66,540 APPLICATIONS APPROVED, NOT ACCEPTED 16 $114,325 7 $105,804 0 $0 0 $0 APPLICATIONS DENIED 2 $113,545 0 $0 0 $0 0 $0 APPLICATIONS WITHDRAWN 1 $85,780 0 $0 0 $0 0 $0 FILES CLOSED FOR INCOMPLETENESS 5 $100,478 1 $89,940 0 $0 0 $0
Aggregated Statistics For Year 2007(Based on 3 full and 10 partial tracts) A) Conventional B) Refinancings C) Non-occupant Loans on D) Loans On Manufactured Number Average Value Number Average Value Number Average Value Number Average Value
LOANS ORIGINATED 90 $112,092 31 $139,074 7 $89,277 1 $121,800 APPLICATIONS APPROVED, NOT ACCEPTED 13 $108,571 10 $123,935 1 $86,000 1 $107,000 APPLICATIONS DENIED 2 $138,720 0 $0 1 $121,800 0 $0 APPLICATIONS WITHDRAWN 4 $100,592 4 $142,658 1 $39,140 0 $0 FILES CLOSED FOR INCOMPLETENESS 1 $105,000 0 $0 0 $0 0 $0
Aggregated Statistics For Year 2006(Based on 3 full and 10 partial tracts) A) Conventional B) Refinancings C) Non-occupant Loans on Number Average Value Number Average Value Number Average Value
LOANS ORIGINATED 59 $106,109 10 $112,418 5 $82,260 APPLICATIONS APPROVED, NOT ACCEPTED 4 $113,242 5 $108,944 1 $39,140 APPLICATIONS DENIED 0 $0 1 $99,000 0 $0 APPLICATIONS WITHDRAWN 1 $217,700 0 $0 0 $0 FILES CLOSED FOR INCOMPLETENESS 0 $0 0 $0 0 $0
Aggregated Statistics For Year 2005(Based on 3 full and 10 partial tracts) A) Conventional B) Refinancings C) Non-occupant Loans on Number Average Value Number Average Value Number Average Value
LOANS ORIGINATED 79 $99,556 23 $114,463 8 $84,342 APPLICATIONS APPROVED, NOT ACCEPTED 10 $101,588 4 $93,972 3 $47,480 APPLICATIONS DENIED 1 $109,100 0 $0 0 $0 APPLICATIONS WITHDRAWN 4 $82,702 6 $122,698 1 $58,300 FILES CLOSED FOR INCOMPLETENESS 1 $80,820 0 $0 0 $0
Aggregated Statistics For Year 2004(Based on 3 full and 10 partial tracts) A) Conventional B) Refinancings C) Non-occupant Loans on Number Average Value Number Average Value Number Average Value
LOANS ORIGINATED 53 $105,786 37 $110,135 1 $99,790 APPLICATIONS APPROVED, NOT ACCEPTED 11 $81,905 15 $119,885 0 $0 APPLICATIONS DENIED 0 $0 0 $0 0 $0 APPLICATIONS WITHDRAWN 2 $262,340 8 $97,408 0 $0 FILES CLOSED FOR INCOMPLETENESS 1 $162,400 0 $0 0 $0
Aggregated Statistics For Year 2003(Based on 3 full and 10 partial tracts) A) Conventional B) Refinancings C) Non-occupant Loans on Number Average Value Number Average Value Number Average Value
LOANS ORIGINATED 95 $96,435 107 $105,806 4 $131,110 APPLICATIONS APPROVED, NOT ACCEPTED 11 $74,210 23 $102,900 3 $72,493 APPLICATIONS DENIED 2 $114,610 9 $112,214 2 $75,740 APPLICATIONS WITHDRAWN 5 $127,690 5 $120,582 1 $174,580 FILES CLOSED FOR INCOMPLETENESS 2 $92,685 1 $115,280 0 $0
Aggregated Statistics For Year 2002(Based on 3 full and 6 partial tracts) A) Conventional B) Refinancings C) Non-occupant Loans on Number Average Value Number Average Value Number Average Value
LOANS ORIGINATED 102 $94,527 93 $106,264 14 $59,560 APPLICATIONS APPROVED, NOT ACCEPTED 9 $99,477 18 $108,990 0 $0 APPLICATIONS DENIED 2 $101,440 1 $100,000 1 $63,290 APPLICATIONS WITHDRAWN 7 $116,077 4 $115,588 1 $81,000 FILES CLOSED FOR INCOMPLETENESS 0 $0 2 $84,710 0 $0
Aggregated Statistics For Year 2001(Based on 3 full and 6 partial tracts) A) Conventional B) Refinancings C) Non-occupant Loans on Number Average Value Number Average Value Number Average Value
LOANS ORIGINATED 99 $94,747 59 $104,561 4 $42,665 APPLICATIONS APPROVED, NOT ACCEPTED 10 $77,043 11 $90,328 0 $0 APPLICATIONS DENIED 0 $0 1 $92,440 1 $92,440 APPLICATIONS WITHDRAWN 1 $52,470 3 $75,043 1 $52,470 FILES CLOSED FOR INCOMPLETENESS 0 $0 0 $0 0 $0
Aggregated Statistics For Year 2000(Based on 3 full and 6 partial tracts) A) Conventional B) Refinancings C) Non-occupant Loans on Number Average Value Number Average Value Number Average Value
LOANS ORIGINATED 86 $92,560 10 $107,143 3 $76,520 APPLICATIONS APPROVED, NOT ACCEPTED 6 $75,390 3 $106,730 0 $0 APPLICATIONS DENIED 0 $0 0 $0 0 $0 APPLICATIONS WITHDRAWN 1 $62,070 0 $0 0 $0 FILES CLOSED FOR INCOMPLETENESS 2 $47,470 0 $0 0 $0
Aggregated Statistics For Year 1999(Based on 2 full and 5 partial tracts) A) Conventional B) Refinancings C) Non-occupant Loans on Number Average Value Number Average Value Number Average Value
LOANS ORIGINATED 73 $87,919 21 $94,139 1 $72,780 APPLICATIONS APPROVED, NOT ACCEPTED 4 $81,615 3 $104,877 0 $0 APPLICATIONS DENIED 2 $40,670 0 $0 0 $0 APPLICATIONS WITHDRAWN 1 $94,240 1 $131,000 0 $0 FILES CLOSED FOR INCOMPLETENESS 1 $47,000 0 $0 0 $0
2004 - 2018 National Fire Incident Reporting System (NFIRS) incidents See full 2006 National Fire Incident Reporting System statistics for zip code 15229, Pennsylvania
Most common first names in zip code 15229 among deceased individuals Name Count Lived (average)
John 231 74.8 years Mary 207 81.2 years William 182 74.6 years Joseph 151 76.3 years Margaret 119 80.6 years Anna 116 83.5 years Robert 110 72.4 years George 109 76.1 years Edward 103 74.7 years James 102 73.5 years
Most common last names in zip code 15229 among deceased individuals Last name Count Lived (average)
Miller 31 78.1 years Smith 31 76.1 years Martin 21 76.6 years Williams 17 76.4 years Kennedy 17 83.4 years Keller 15 75.7 years Jones 15 75.6 years Wagner 15 75.7 years Lang 14 79.7 years King 14 79.6 years
Businesses in zip code 15229
Name Count Name Count
7-Eleven 1 Little Caesars Pizza 1 Cricket Wireless 1 Long John Silver's 1 Dunkin Donuts 1 McDonald's 1 Fashion Bug 1 Rite Aid 1 FedEx 1 Sears 1 GNC 1 Subway 1 H&R Block 1 UPS 1 KFC 1 Wendy's 1 Kmart 1
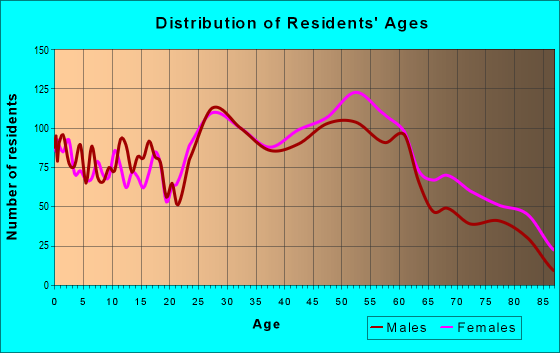
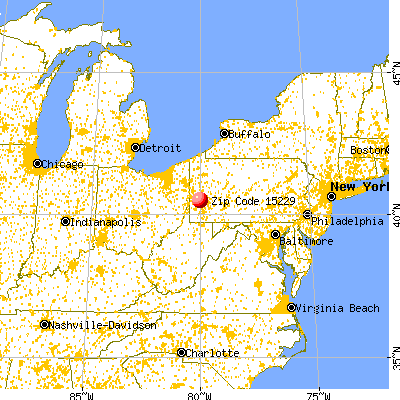


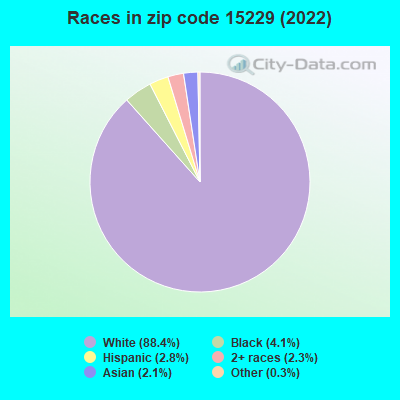


 Nearest zip codes: 15237, 15202, 15214, 15233, 15290, 15204.
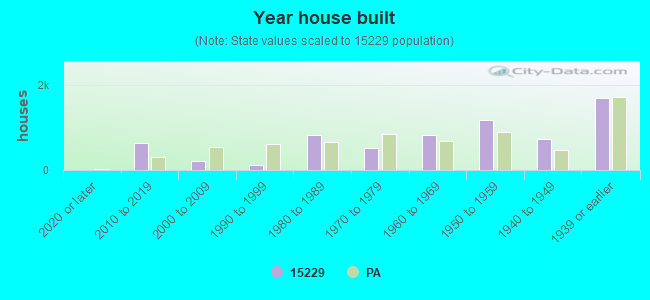

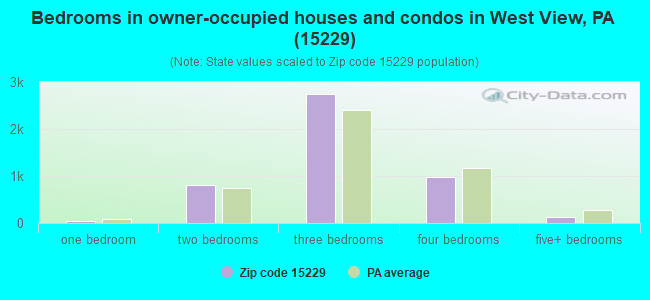
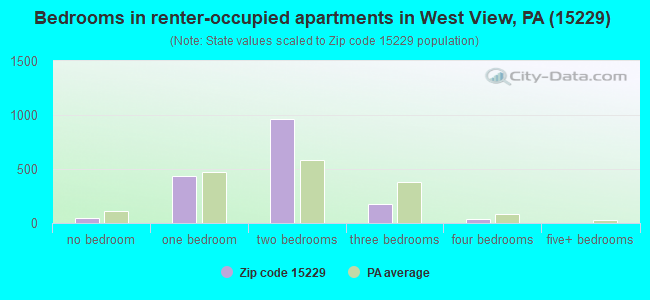
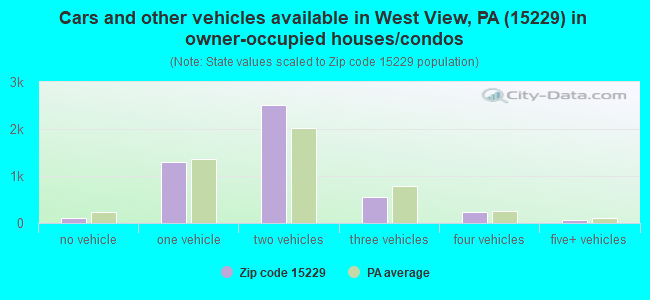
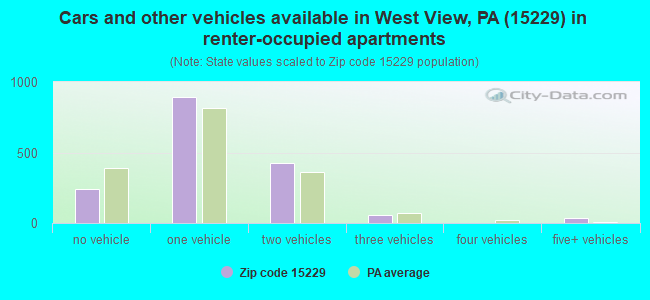


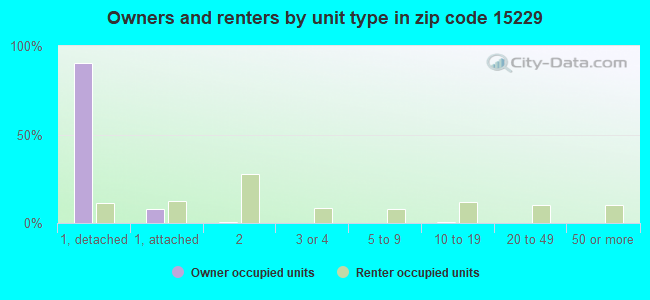
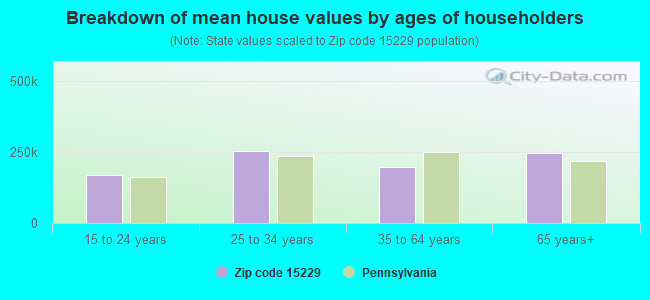


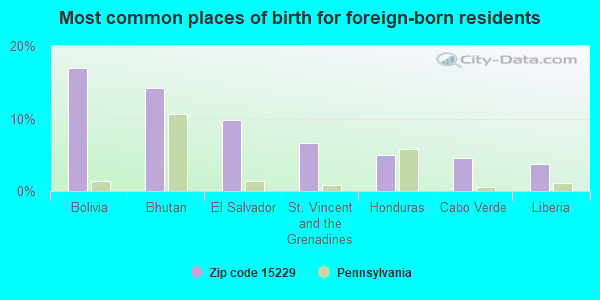
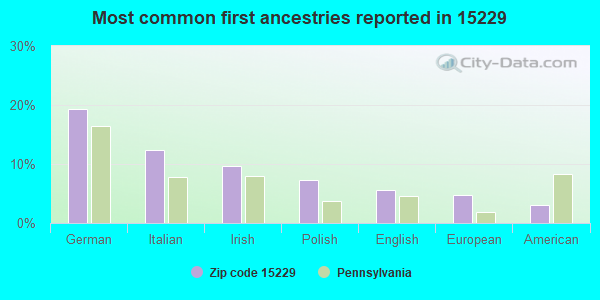
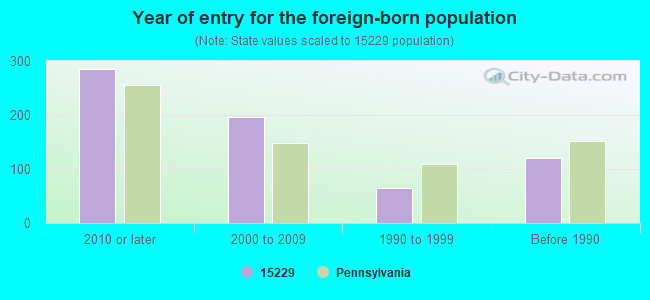


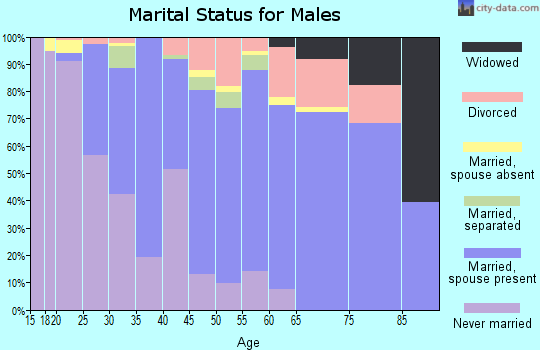
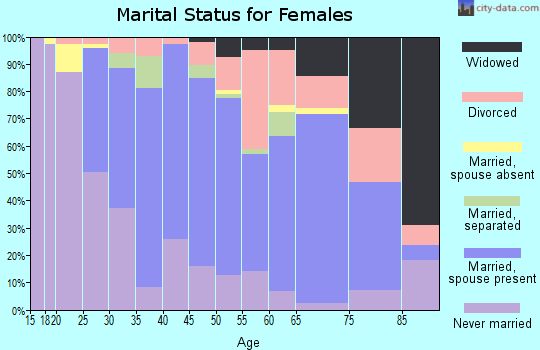
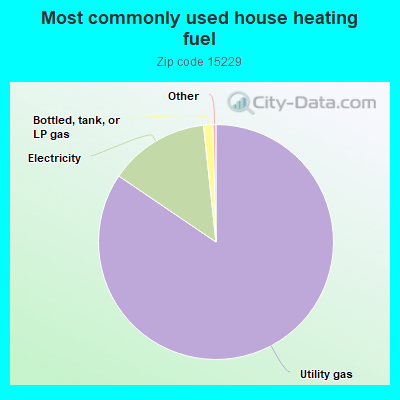
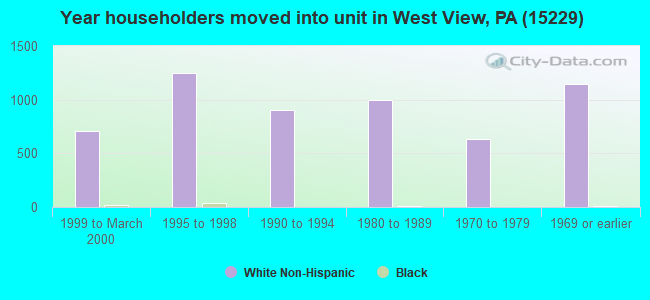
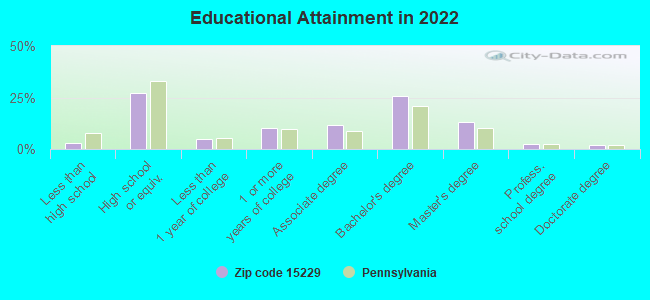
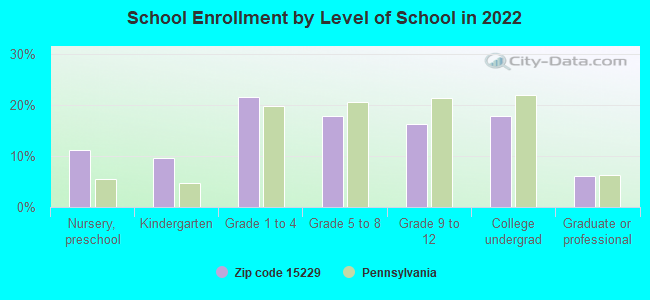
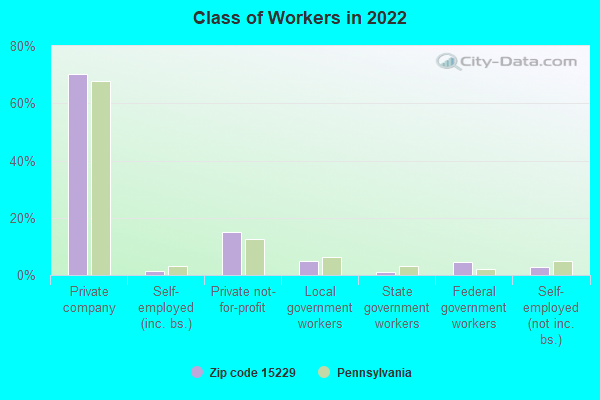
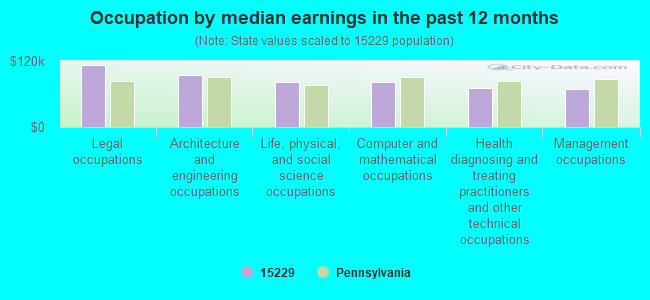
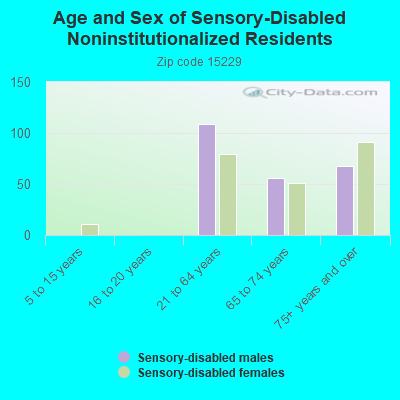
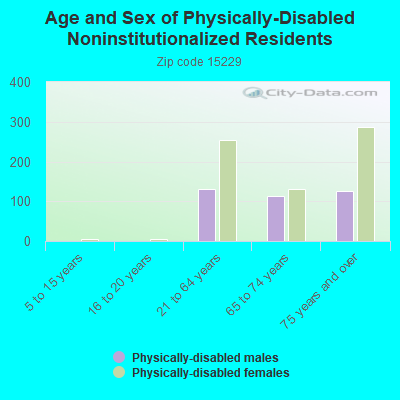
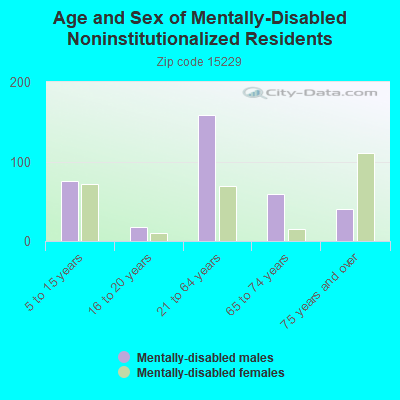
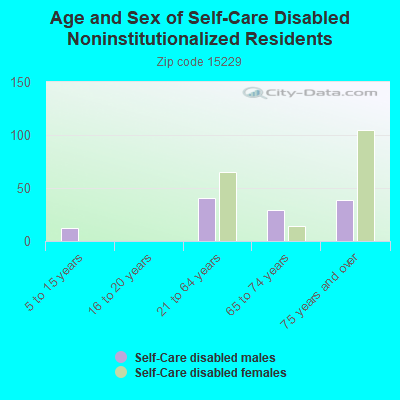
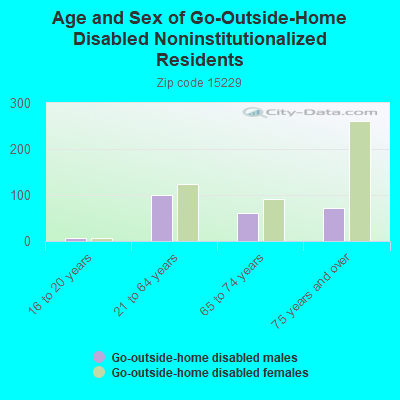
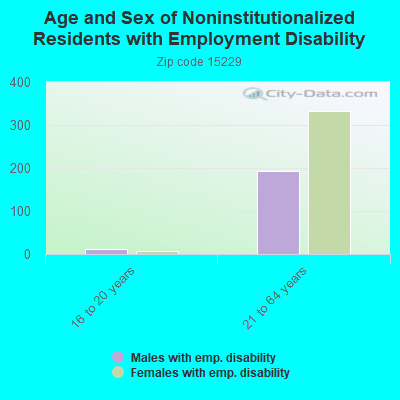
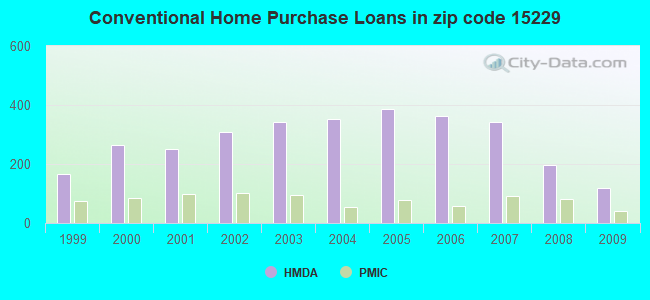
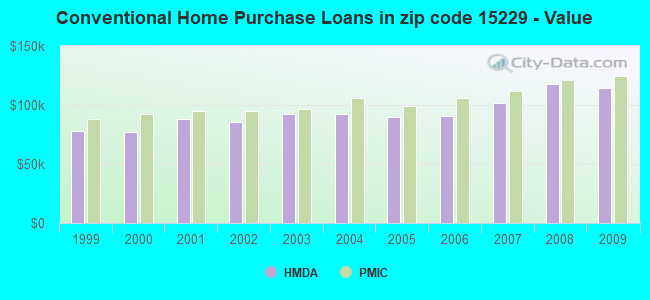
 Based on the data from the years 2004 - 2018 the average number of fire incidents per year is 23. The highest number of fire incidents - 59 took place in 2018, and the least - 0 in 2005. The data has a rising trend.
 When looking into fire subcategories, the most incidents belonged to: Structure Fires (64.0%), and Other (14.0%).