Estimated median house/condo value in 2022: $166,163
15661:
$166,163
Pennsylvania:
$245,500
According to our research of Pennsylvania and other state lists, there were 2 registered sex offenders living in 15661 zip code as of April 26, 2024. The ratio of all residents to sex offenders in zip code 15661 is 330 to 1.
Median resident age:
This zip code:
42.0 years
Pennsylvania median age:
40.9 years
Average household size:
This zip code:
2.6 people
Pennsylvania:
2.4 people
Averages for the 2020 tax year for zip code 15661, filed in 2021:
Average Adjusted Gross Income (AGI) in 2020: $41,393 (Individual Income Tax Returns)
Here:
$41,393
State:
$75,707
Salary/wage: $38,183 (reported on 76.7% of returns)
Here:
$38,183
State:
$62,806
(% of AGI for various income ranges: 951.2% for AGIs below $25k, 3671.7% for AGIs $25k-50k, 4798.0% for AGIs $50k-75k, 8547.5% for AGIs $75k-100k)
Taxable interest for individuals: $411 (reported on 30.0% of returns)
This zip code:
$411
Pennsylvania:
$1,633
(% of AGI for various income ranges: 30.0% for AGIs below $25k, 8.3% for AGIs $25k-50k, 16.0% for AGIs $50k-75k)
Ordinary dividends: $633 (reported on 10.0% of returns)
Here:
$633
State:
$7,382
(% of AGI for various income ranges: 31.7% for AGIs $25k-50k)
Profit/loss from business: +$11,000 (reported on 6.7% of returns)
Here:
+$11,000
State:
+$16,274
(% of AGI for various income ranges: 275.0% for AGIs below $25k)
Taxable individual retirement arrangement distribution: $7,650 (reported on 6.7% of returns)
15661:
$7,650
Pennsylvania:
$18,583
(% of AGI for various income ranges: 191.2% for AGIs below $25k)
Earned income credit: $1,850 (reported on 13.3% of returns)
Here:
$1,850
State:
$2,100
(% of AGI for various income ranges: 92.5% for AGIs below $25k)
Percentage of individuals using paid preparers for their 2020 taxes: 90.0%
Here:
90%
State:
92%
(% for various income ranges: 90.9% for AGIs below $25k, 100.0% for AGIs $25k-50k, 83.3% for AGIs $50k-75k, 80.0% for AGIs $75k-100k)
Averages for the 2012 tax year for zip code 15661, filed in 2013:
Average Adjusted Gross Income (AGI) in 2012: $36,409 (Individual Income Tax Returns)
Here:
$36,409
State:
$61,346
Salary/wage: $32,996 (reported on 81.8% of returns)
Here:
$32,996
State:
$51,902
(% of AGI for various income ranges: 61.9% for AGIs below $25k, 79.9% for AGIs $25k-50k, 80.2% for AGIs $50k-75k, 69.7% for AGIs $75k-100k)
Taxable interest for individuals: $940 (reported on 30.3% of returns)
This zip code:
$940
Pennsylvania:
$1,588
(% of AGI for various income ranges: 1.0% for AGIs below $25k, 0.2% for AGIs $50k-75k, 1.8% for AGIs $75k-100k)
Ordinary dividends: $1,320 (reported on 15.2% of returns)
Here:
$1,320
State:
$5,827
(% of AGI for various income ranges: 1.0% for AGIs below $25k, 1.4% for AGIs $50k-75k)
Profit/loss from business: +$8,950 (reported on 12.1% of returns)
Here:
+$8,950
State:
+$16,268
Taxable individual retirement arrangement distribution: $4,600 (reported on 9.1% of returns)
15661:
$4,600
Pennsylvania:
$14,550
Earned income credit: $2,300 (reported on 15.2% of returns)
Here:
$2,300
State:
$2,106
(% of AGI for various income ranges: 6.5% for AGIs below $25k)
Percentage of individuals using paid preparers for their 2012 taxes: 51.5%
Here:
52%
State:
53%
(% for various income ranges: 50.0% for AGIs below $25k, 55.6% for AGIs $25k-50k, 50.0% for AGIs $50k-75k, 50.0% for AGIs $75k-100k)
Averages for the 2004 tax year for zip code 15661, filed in 2005:
Average Adjusted Gross Income (AGI) in 2004: $29,645 (Individual Income Tax Returns)
Here:
$29,645
State:
$48,049
Salary/wage: $28,446 (reported on 82.4% of returns)
Here:
$28,446
State:
$42,646
(% of AGI for various income ranges: 78.7% for AGIs below $10k, 65.6% for AGIs $10k-25k, 82.3% for AGIs $25k-50k, 106.7% for AGIs $50k-75k)
Taxable interest for individuals: $979 (reported on 46.0% of returns)
This zip code:
$979
Pennsylvania:
$1,657
(% of AGI for various income ranges: 4.3% for AGIs below $10k, 4.2% for AGIs $10k-25k, 1.1% for AGIs $25k-50k, 0.6% for AGIs $50k-75k)
Taxable dividends: $354 (reported on 15.3% of returns)
Here:
$354
State:
$3,566
Profit/loss from business: +$7,622 (reported on 11.8% of returns)
Here:
+$7,622
State:
+$14,267
Total itemized deductions: $11,400 (25% of AGI, reported on 8.0% of returns)
Here:
$11,400
State:
$18,804
Here:
25.1% of AGI
State:
19.5% of AGI
Charity contributions deductions: $632 (1% of AGI, reported on 6.1% of returns)
Here:
$632
State:
$3,337
Here:
1.4% of AGI
State:
3.3% of AGI
Total tax: $2,921 (reported on 77.0% of returns)
15661:
$2,921
State:
$8,008
(% of AGI for various income ranges: 3.1% for AGIs below $10k, 5.0% for AGIs $10k-25k, 7.2% for AGIs $25k-50k, 9.0% for AGIs $50k-75k, 11.4% for AGIs $75k-100k)
Earned income credit: $1,787 (reported on 15.0% of returns)
Here:
$1,787
State:
$1,643
Percentage of individuals using paid preparers for their 2004 taxes: 51.4%
Here:
51%
State:
56%
(% for various income ranges: 50.0% for AGIs below $10k, 54.9% for AGIs $10k-25k, 54.3% for AGIs $25k-50k, 51.1% for AGIs $50k-75k)
Household received Food Stamps/SNAP in the past 12 months: 38 Household did not receive Food Stamps/SNAP in the past 12 months: 347
Women who did not have a birth in the past 12 months: 318 (122 now married, 195 unmarried)
Housing units in zip code 15661 with a mortgage: 148 (16 second mortgage, 16 both second mortgage and home equity loan) Median monthly owner costs for units with a mortgage: $1,033 Median monthly owner costs for units without a mortgage: $553
Residents with income below the poverty level in 2022:
This zip code:
8.7%
Whole state:
11.8%
Residents with income below 50% of the poverty level in 2022:
This zip code:
3.3%
Whole state:
6.1%
Median number of rooms in houses and condos:
Here:
6.3
State:
6.8
Median number of rooms in apartments:
Here:
5.5
State:
4.3
Notable locations in this zip code not listed on our city pages
Size of family households: 130 2-persons, 134 4-persons, 14 5-persons
Size of nonfamily households: 59 1-person, 47 2-persons
177 married couples with children.
14 single-parent households (14 men).
99.1% of residents of 15661 zip code speak English at home.
Foreign born population: 0 (0.0%)
:
0.0%
Whole state:
7.5%
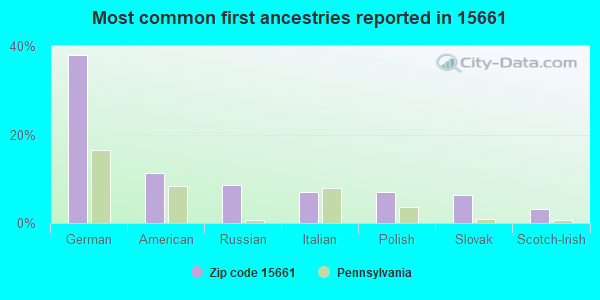
38%German
11%American
9%Russian
7%Italian
7%Polish
6%Slovak
3%Scotch-Irish
Facilities with environmental interests located in this zip code:
AIRO DIE CASTING WEST PLT (450 NEW LATROBE DERRY ROAD in LOYALHANNA, PA)
CRITERIA AND HAZARDOUS AIR POLLUTANT INVENTORY (Inventory of air pollution sources) STATE MASTER (Pennsylvania database) - AFS-71-0416822-1, AIR PROGRAM, PCS-PAR116115, National Pollutant Discharge Elimination System Permit, PCS-PAR206134, RCRIS-PAR000018028, HAZARDOUS WASTE PROGRAM STATE MASTER (Pennsylvania database) - RCRIS-PAD987350527, HAZARDOUS WASTE PROGRAM, AFS-71-0416822-2, AIR PROGRAM National Pollutant Discharge Elimination System NON-MAJOR (Tracking pollutant discharge elimination systems) - permit National Pollutant Discharge Elimination System NON-MAJOR (Tracking pollutant discharge elimination systems) - permit Conditionally Exempt Small Quantity Generators, less than 100 kg/month of hazardous waste (Resource Conservation and Recovery Act (tracking hazardous waste)) Conditionally Exempt Small Quantity Generators, less than 100 kg/month of hazardous waste (Resource Conservation and Recovery Act (tracking hazardous waste)) TRI REPORTER (Tracking of toxic chemicals releasing facilities) Business SIC classification: ALUMINUM DIE-CASTINGS; MISCELLANEOUS STRUCTURAL METALWORK; COATING, ENGRAVING, AND ALLIED SERVICES Business NAICS classification: ALUMINUM DIE-CASTING FOUNDRIES.; ALUMINUM DIE-CASTING FOUNDRIES.; ALL OTHER MISCELLANEOUS MANUFACTURING. Organizations: OPERNAME (CONTACT/OPERATOR)
, AIRO DIE CASTING INC (CONTACT/OPERATOR)
, LATROBE PLASTIC CO INC (CONTACT/OWNER)
, LATROBE PLASTIC CO (CONTACT/OWNER)
, PACE INDUSTRIES INC (CONTACT/OWNER)
, PACE INDUSTRIES, INC. (CONTACT/OWNER)
Alternative names: AIRO DIE CASTING INC, AIRO DIE CASTING INC (WEST), AIRO DIE CASTING MAIN PLT, AIRO DIE CASTINGs INCORPORATED, LATROBE PLASTIC CO INC
Housing units lacking complete kitchen facilities: 6.8%
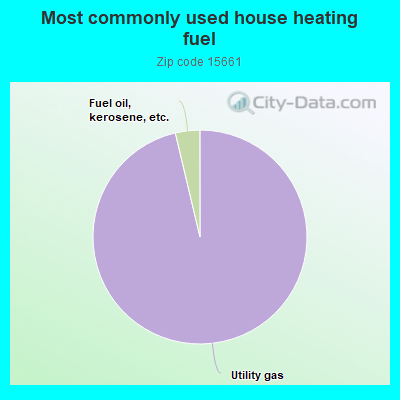
96.4%Utility gas
3.7%Fuel oil, kerosene, etc.
Population in 1990: 564. Population change in the 1990s: +93 (+16.5%).
Place of birth for U.S.-born residents:
This state: 903
South: 70
West: 23
77% of the 15661 zip code residents lived in the same house 5 years ago. Out of people who lived in different houses, 100% lived in this county.
101% of the 15661 zip code residents lived in the same house 1 year ago.
Private vs. public school enrollment:
Students in private schools in grades 1 to 8 (elementary and middle school):
Here:
0.0%
Pennsylvania:
15.7%
Students in private schools in grades 9 to 12 (high school):
Here:
0.0%
Pennsylvania:
13.4%
Students in private undergraduate colleges:
Here:
0.0%
Pennsylvania:
39.8%
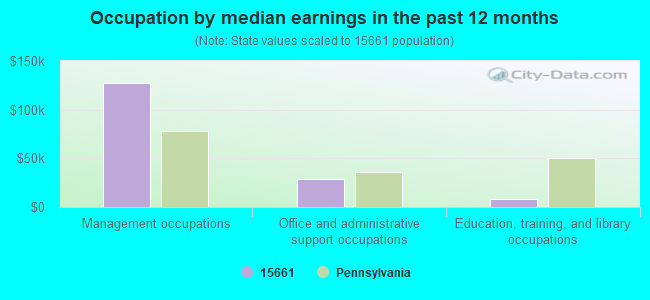
Occupation by median earnings in the past 12 months ($)
127,016Management occupations
28,432Office and administrative support occupations
8,726Education, training, and library occupations
Top industries in this zip code by the number of employees in 2005:
Administrative and Support and Waste Management and Remediation Services: Janitorial Services (50-99 employees: 1 establishment)
Construction: Drywall and Insulation Contractors (50-99: 1)
Construction: Plumbing, Heating, and Air-Conditioning Contractors (5-9: 1, 1-4: 1)
People in group quarters in 2000:
8 people in other noninstitutional group quarters
Home Mortgage Disclosure Act Aggregated Statistics For Year 2009 (Based on 2 partial tracts)
A) FHA, FSA/RHS & VA Home Purchase Loans
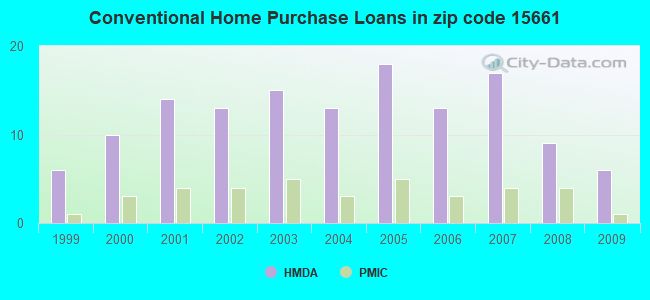
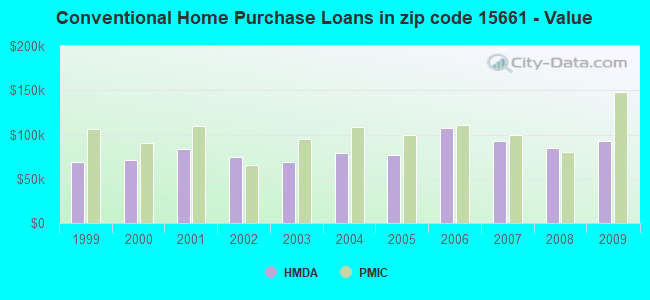
B) Conventional Home Purchase Loans
C) Refinancings
D) Home Improvement Loans
F) Non-occupant Loans on < 5 Family Dwellings (A B C & D)
Number
Average Value
Number
Average Value
Number
Average Value
Number
Average Value
Number
Average Value
LOANS ORIGINATED
6
$110,467
6
$92,878
10
$103,217
4
$40,648
1
$147,580
APPLICATIONS APPROVED, NOT ACCEPTED
0
$0
0
$0
1
$60,490
0
$0
0
$0
APPLICATIONS DENIED
1
$146,290
1
$118,400
9
$82,988
0
$0
0
$0
APPLICATIONS WITHDRAWN
0
$0
0
$0
4
$91,805
0
$0
0
$0
FILES CLOSED FOR INCOMPLETENESS
0
$0
0
$0
1
$113,690
0
$0
0
$0
Aggregated Statistics For Year 2008 (Based on 2 partial tracts)
A) FHA, FSA/RHS & VA Home Purchase Loans
B) Conventional Home Purchase Loans
C) Refinancings
D) Home Improvement Loans
F) Non-occupant Loans on < 5 Family Dwellings (A B C & D)
G) Loans On Manufactured Home Dwelling (A B C & D)
Number
Average Value
Number
Average Value
Number
Average Value
Number
Average Value
Number
Average Value
Number
Average Value
LOANS ORIGINATED
3
$131,990
9
$84,751
12
$80,759
7
$32,727
2
$70,140
1
$95,670
APPLICATIONS APPROVED, NOT ACCEPTED
0
$0
0
$0
2
$58,985
1
$4,720
0
$0
0
$0
APPLICATIONS DENIED
2
$66,280
1
$46,330
10
$119,391
3
$42,613
0
$0
2
$75,935
APPLICATIONS WITHDRAWN
0
$0
3
$92,807
5
$84,598
1
$19,730
1
$45,470
0
$0
FILES CLOSED FOR INCOMPLETENESS
0
$0
0
$0
2
$108,535
0
$0
0
$0
0
$0
Aggregated Statistics For Year 2007 (Based on 2 partial tracts)
A) FHA, FSA/RHS & VA Home Purchase Loans
B) Conventional Home Purchase Loans
C) Refinancings
D) Home Improvement Loans
F) Non-occupant Loans on < 5 Family Dwellings (A B C & D)
Number
Average Value
Number
Average Value
Number
Average Value
Number
Average Value
Number
Average Value
LOANS ORIGINATED
3
$84,657
17
$92,967
17
$84,866
6
$34,892
2
$73,575
APPLICATIONS APPROVED, NOT ACCEPTED
0
$0
2
$80,010
4
$163,450
0
$0
0
$0
APPLICATIONS DENIED
0
$0
3
$65,207
18
$118,928
4
$24,668
1
$108,970
APPLICATIONS WITHDRAWN
0
$0
3
$71,357
7
$98,547
1
$51,910
2
$69,925
FILES CLOSED FOR INCOMPLETENESS
0
$0
1
$127,840
1
$152,290
0
$0
0
$0
Aggregated Statistics For Year 2006 (Based on 2 partial tracts)
A) FHA, FSA/RHS & VA Home Purchase Loans
B) Conventional Home Purchase Loans
C) Refinancings
D) Home Improvement Loans
F) Non-occupant Loans on < 5 Family Dwellings (A B C & D)
G) Loans On Manufactured Home Dwelling (A B C & D)
Number
Average Value
Number
Average Value
Number
Average Value
Number
Average Value
Number
Average Value
Number
Average Value
LOANS ORIGINATED
2
$107,680
13
$107,448
15
$67,353
6
$27,313
2
$51,265
1
$78,510
APPLICATIONS APPROVED, NOT ACCEPTED
0
$0
3
$87,660
5
$86,400
1
$53,630
0
$0
0
$0
APPLICATIONS DENIED
0
$0
1
$95,670
26
$94,562
5
$24,454
0
$0
0
$0
APPLICATIONS WITHDRAWN
0
$0
1
$123,550
12
$93,665
2
$37,750
1
$68,210
0
$0
FILES CLOSED FOR INCOMPLETENESS
0
$0
0
$0
4
$118,082
0
$0
0
$0
0
$0
Aggregated Statistics For Year 2005 (Based on 2 partial tracts)
A) FHA, FSA/RHS & VA Home Purchase Loans
B) Conventional Home Purchase Loans
C) Refinancings
D) Home Improvement Loans
F) Non-occupant Loans on < 5 Family Dwellings (A B C & D)
Number
Average Value
Number
Average Value
Number
Average Value
Number
Average Value
Number
Average Value
LOANS ORIGINATED
2
$99,315
18
$76,862
25
$71,883
10
$34,063
4
$44,402
APPLICATIONS APPROVED, NOT ACCEPTED
0
$0
2
$56,415
6
$82,797
1
$6,430
1
$4,290
APPLICATIONS DENIED
0
$0
2
$72,715
27
$77,156
6
$10,438
0
$0
APPLICATIONS WITHDRAWN
0
$0
3
$49,907
10
$116,431
2
$44,185
1
$71,640
FILES CLOSED FOR INCOMPLETENESS
0
$0
0
$0
2
$90,520
0
$0
0
$0
Aggregated Statistics For Year 2004 (Based on 2 partial tracts)
A) FHA, FSA/RHS & VA Home Purchase Loans
B) Conventional Home Purchase Loans
C) Refinancings
D) Home Improvement Loans
F) Non-occupant Loans on < 5 Family Dwellings (A B C & D)
G) Loans On Manufactured Home Dwelling (A B C & D)
Number
Average Value
Number
Average Value
Number
Average Value
Number
Average Value
Number
Average Value
Number
Average Value
LOANS ORIGINATED
3
$88,087
13
$78,540
25
$84,564
13
$38,907
1
$94,810
0
$0
APPLICATIONS APPROVED, NOT ACCEPTED
0
$0
2
$116,260
4
$105,535
4
$27,670
0
$0
0
$0
APPLICATIONS DENIED
0
$0
4
$71,642
18
$91,210
5
$45,818
1
$42,470
1
$64,350
APPLICATIONS WITHDRAWN
0
$0
2
$76,360
16
$91,994
2
$52,555
0
$0
0
$0
FILES CLOSED FOR INCOMPLETENESS
0
$0
1
$68,640
3
$154,297
0
$0
0
$0
0
$0
Aggregated Statistics For Year 2003 (Based on 2 partial tracts)
A) FHA, FSA/RHS & VA Home Purchase Loans
B) Conventional Home Purchase Loans
C) Refinancings
D) Home Improvement Loans
F) Non-occupant Loans on < 5 Family Dwellings (A B C & D)
Number
Average Value
Number
Average Value
Number
Average Value
Number
Average Value
Number
Average Value
LOANS ORIGINATED
1
$70,780
15
$68,497
59
$76,377
8
$30,674
3
$66,493
APPLICATIONS APPROVED, NOT ACCEPTED
0
$0
1
$147,580
9
$75,933
2
$19,090
0
$0
APPLICATIONS DENIED
0
$0
2
$65,210
18
$89,399
5
$30,202
2
$62,205
APPLICATIONS WITHDRAWN
0
$0
1
$190,050
10
$99,657
1
$33,030
0
$0
FILES CLOSED FOR INCOMPLETENESS
0
$0
0
$0
0
$0
0
$0
0
$0
Aggregated Statistics For Year 2002 (Based on 2 partial tracts)
A) FHA, FSA/RHS & VA Home Purchase Loans
B) Conventional Home Purchase Loans
C) Refinancings
D) Home Improvement Loans
F) Non-occupant Loans on < 5 Family Dwellings (A B C & D)
Number
Average Value
Number
Average Value
Number
Average Value
Number
Average Value
Number
Average Value
LOANS ORIGINATED
3
$53,053
13
$75,141
37
$74,681
6
$20,950
3
$55,627
APPLICATIONS APPROVED, NOT ACCEPTED
0
$0
1
$62,630
12
$98,884
1
$41,180
0
$0
APPLICATIONS DENIED
0
$0
3
$62,490
28
$76,883
3
$10,583
1
$48,910
APPLICATIONS WITHDRAWN
0
$0
1
$71,210
15
$82,397
1
$5,150
0
$0
FILES CLOSED FOR INCOMPLETENESS
0
$0
0
$0
4
$90,198
0
$0
0
$0
Aggregated Statistics For Year 2001 (Based on 2 partial tracts)
A) FHA, FSA/RHS & VA Home Purchase Loans
B) Conventional Home Purchase Loans
C) Refinancings
D) Home Improvement Loans
F) Non-occupant Loans on < 5 Family Dwellings (A B C & D)
Number
Average Value
Number
Average Value
Number
Average Value
Number
Average Value
Number
Average Value
LOANS ORIGINATED
3
$65,350
14
$83,655
32
$77,019
12
$21,808
1
$51,480
APPLICATIONS APPROVED, NOT ACCEPTED
0
$0
0
$0
12
$78,149
2
$8,150
0
$0
APPLICATIONS DENIED
1
$55,340
1
$26,600
20
$66,088
10
$13,085
0
$0
APPLICATIONS WITHDRAWN
0
$0
0
$0
16
$66,709
3
$11,440
0
$0
FILES CLOSED FOR INCOMPLETENESS
0
$0
0
$0
3
$51,480
0
$0
0
$0
Aggregated Statistics For Year 2000 (Based on 2 partial tracts)
A) FHA, FSA/RHS & VA Home Purchase Loans
B) Conventional Home Purchase Loans
C) Refinancings
D) Home Improvement Loans
F) Non-occupant Loans on < 5 Family Dwellings (A B C & D)
Number
Average Value
Number
Average Value
Number
Average Value
Number
Average Value
Number
Average Value
LOANS ORIGINATED
1
$88,800
10
$70,914
13
$81,246
7
$23,840
1
$111,110
APPLICATIONS APPROVED, NOT ACCEPTED
0
$0
1
$36,460
6
$93,593
2
$21,880
0
$0
APPLICATIONS DENIED
0
$0
2
$23,165
16
$63,117
5
$27,886
1
$57,910
APPLICATIONS WITHDRAWN
0
$0
3
$86,087
8
$61,508
2
$23,595
0
$0
FILES CLOSED FOR INCOMPLETENESS
0
$0
0
$0
1
$87,090
0
$0
0
$0
Aggregated Statistics For Year 1999 (Based on 1 partial tract)

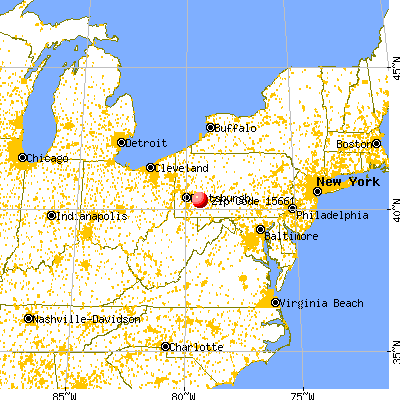


 Nearest zip codes: 15620, 15696, 15671, 15650, 15627, 15638.