Estimated zip code population in 2022: 2,497 Zip code population in 2010: 3,343 Zip code population in 2000: 3,230
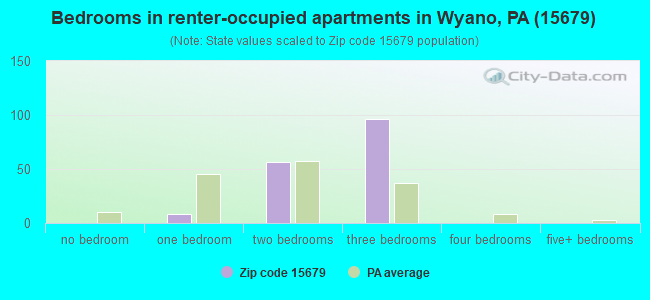
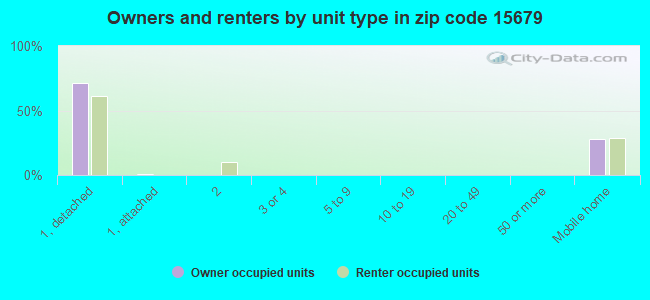
Houses and condos: 1,422 Renter-occupied apartments: 165
% of renters here:
12%
State:
31%
March 2022 cost of living index in zip code 15679: 88.7 (less than average, U.S. average is 100)
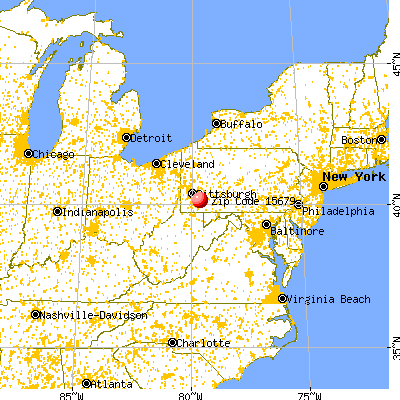
Land area: 23.5 sq. mi. Water area: 0.0 sq. mi.
Population density: 106 people per square mile
(very low).
OSM Map
General Map
Google Map
MSN Map
OSM Map
General Map
Google Map
MSN Map
OSM Map
General Map
Google Map
MSN Map
OSM Map
General Map
Google Map
MSN Map
Please wait while loading the map...
Real estate property taxes paid for housing units in 2022:
This zip code:
1.0% ($1,746)
Pennsylvania:
1.3% ($3,094)
Median real estate property taxes paid for housing units with mortgages in 2022: $2,384 (0.9%) Median real estate property taxes paid for housing units with no mortgage in 2022: $1,336 (1.0%)
Business Search- 14 Million verified businesses
Males: 1,523
(61.0%)
Females: 974
(39.0%)
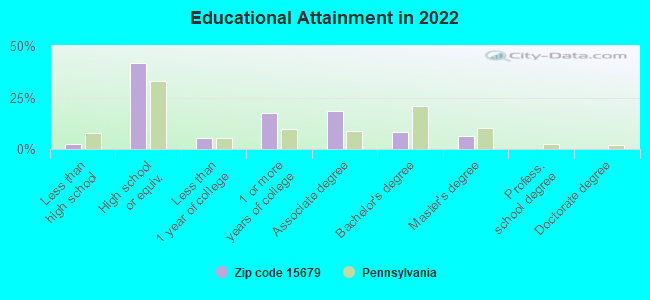
For population 25 years and over in 15679:
High school or higher: 97.1%
Bachelor's degree or higher: 14.6%
Graduate or professional degree: 6.3%
Unemployed: 5.8%
Mean travel time to work (commute): 25.9 minutes
For population 15 years and over in 15679:
Never married: 21.9%
Now married: 48.1%
Separated: 1.3%
Widowed: 6.1%
Divorced: 22.5%
Zip code 15679 compared to state average:
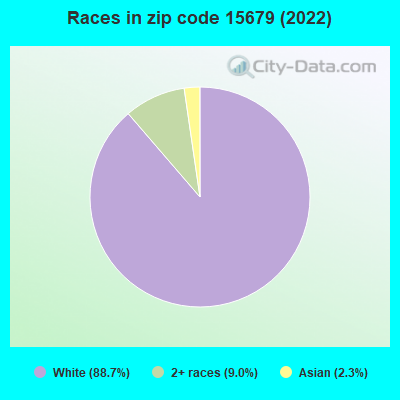
Black race population percentage significantly below state average.
Hispanic race population percentage significantly below state average.
Median age significantly above state average.
Foreign-born population percentage significantly below state average.
Renting percentage significantly below state average.
Length of stay since moving in significantly above state average.
Number of college students significantly below state average.
Percentage of population with a bachelor's degree or higher below state average.
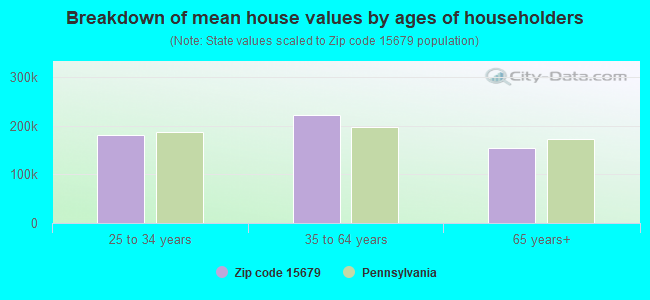
Estimated median house/condo value in 2022: $176,148
15679:
$176,148
Pennsylvania:
$245,500
According to our research of Pennsylvania and other state lists, there was 1 registered sex offender living in 15679 zip code as of April 27, 2024. The ratio of all residents to sex offenders in zip code 15679 is 2,805 to 1. The ratio of registered sex offenders to all residents in this zip code is much lower than the state average.
Median resident age:
This zip code:
57.2 years
Pennsylvania median age:
40.9 years
Average household size:
This zip code:
1.9 people
Pennsylvania:
2.4 people
Averages for the 2020 tax year for zip code 15679, filed in 2021:
Average Adjusted Gross Income (AGI) in 2020: $62,499 (Individual Income Tax Returns)
Here:
$62,499
State:
$75,707
Salary/wage: $50,214 (reported on 79.6% of returns)
Here:
$50,214
State:
$62,806
(% of AGI for various income ranges: 1083.0% for AGIs below $25k, 3387.5% for AGIs $25k-50k, 6467.4% for AGIs $50k-75k, 8963.8% for AGIs $75k-100k, 15481.5% for AGIs $100k-200k)
Taxable interest for individuals: $860 (reported on 31.8% of returns)
This zip code:
$860
Pennsylvania:
$1,633
(% of AGI for various income ranges: 20.0% for AGIs below $25k, 40.4% for AGIs $25k-50k, 23.7% for AGIs $50k-75k, 23.1% for AGIs $75k-100k, 96.9% for AGIs $100k-200k)
Ordinary dividends: $3,057 (reported on 19.1% of returns)
Here:
$3,057
State:
$7,382
(% of AGI for various income ranges: 20.9% for AGIs below $25k, 37.5% for AGIs $25k-50k, 60.5% for AGIs $50k-75k, 27.7% for AGIs $75k-100k, 455.4% for AGIs $100k-200k)
Net capital gain/loss in AGI: +$10,319 (reported on 13.4% of returns)
Here:
+$10,319
State:
+$23,522
(% of AGI for various income ranges: 10.6% for AGIs below $25k, 22.1% for AGIs $25k-50k, 96.3% for AGIs $50k-75k, 152.3% for AGIs $75k-100k, 1299.2% for AGIs $100k-200k)
Profit/loss from business: +$11,239 (reported on 11.5% of returns)
Here:
+$11,239
State:
+$16,274
(% of AGI for various income ranges: 88.2% for AGIs below $25k, 138.2% for AGIs $25k-50k, 171.1% for AGIs $50k-75k, 373.1% for AGIs $75k-100k, 411.5% for AGIs $100k-200k)
Taxable individual retirement arrangement distribution: $13,843 (reported on 13.4% of returns)
15679:
$13,843
Pennsylvania:
$18,583
(% of AGI for various income ranges: 99.1% for AGIs below $25k, 152.9% for AGIs $25k-50k, 506.8% for AGIs $50k-75k, 914.6% for AGIs $100k-200k)
Total itemized deductions: $27,220 (reported on 3.2% of returns)
Here:
$27,220
State:
$34,850
(% of AGI for various income ranges: 161.8% for AGIs $25k-50k, 698.5% for AGIs $100k-200k)
Charity contributions: $6,450 (reported on 2.5% of returns)
Here:
$6,450
State:
$12,392
(% of AGI for various income ranges: 198.5% for AGIs $75k-100k)
Taxes paid: $7,925 (reported on 2.5% of returns)
15679:
$7,925
State:
$8,200
(% of AGI for various income ranges: 243.8% for AGIs $100k-200k)
Earned income credit: $1,569 (reported on 10.2% of returns)
Here:
$1,569
State:
$2,100
(% of AGI for various income ranges: 40.9% for AGIs below $25k, 41.4% for AGIs $25k-50k)
Percentage of individuals using paid preparers for their 2020 taxes: 91.1%
Here:
91%
State:
92%
(% for various income ranges: 88.0% for AGIs below $25k, 91.9% for AGIs $25k-50k, 88.9% for AGIs $50k-75k, 94.4% for AGIs $75k-100k, 95.2% for AGIs $100k-200k, 100.0% for AGIs over 200k)
Averages for the 2012 tax year for zip code 15679, filed in 2013:
Average Adjusted Gross Income (AGI) in 2012: $53,563 (Individual Income Tax Returns)
Here:
$53,563
State:
$61,346
Salary/wage: $43,632 (reported on 83.4% of returns)
Here:
$43,632
State:
$51,902
(% of AGI for various income ranges: 68.5% for AGIs below $25k, 75.5% for AGIs $25k-50k, 81.5% for AGIs $50k-75k, 80.9% for AGIs $75k-100k, 75.8% for AGIs $100k-200k, 26.1% for AGIs over 200k)
Taxable interest for individuals: $844 (reported on 33.7% of returns)
This zip code:
$844
Pennsylvania:
$1,588
(% of AGI for various income ranges: 1.4% for AGIs below $25k, 0.5% for AGIs $25k-50k, 0.6% for AGIs $50k-75k, 0.6% for AGIs $75k-100k, 0.5% for AGIs $100k-200k)
Ordinary dividends: $1,567 (reported on 20.2% of returns)
Here:
$1,567
State:
$5,827
(% of AGI for various income ranges: 0.8% for AGIs below $25k, 0.9% for AGIs $25k-50k, 0.4% for AGIs $50k-75k, 0.7% for AGIs $75k-100k, 0.9% for AGIs $100k-200k)
Net capital gain/loss in AGI: +$1,206 (reported on 11.0% of returns)
Here:
+$1,206
State:
+$14,495
(% of AGI for various income ranges: 0.1% for AGIs $50k-75k, 0.3% for AGIs $75k-100k, 0.8% for AGIs $100k-200k)
Profit/loss from business: +$10,625 (reported on 12.3% of returns)
Here:
+$10,625
State:
+$16,268
(% of AGI for various income ranges: 4.6% for AGIs below $25k, 4.7% for AGIs $25k-50k, 2.1% for AGIs $50k-75k, 1.9% for AGIs $75k-100k, 2.8% for AGIs $100k-200k)
Taxable individual retirement arrangement distribution: $9,444 (reported on 11.0% of returns)
15679:
$9,444
Pennsylvania:
$14,550
(% of AGI for various income ranges: 4.3% for AGIs below $25k, 2.4% for AGIs $25k-50k, 1.6% for AGIs $50k-75k, 1.1% for AGIs $75k-100k, 3.4% for AGIs $100k-200k)
Total itemized deductions: $18,953 (16% of AGI, reported on 20.9% of returns)
Here:
$18,953
State:
$23,538
Here:
15.6% of AGI
State:
18.4% of AGI
(% of AGI for various income ranges: 3.2% for AGIs below $25k, 4.8% for AGIs $25k-50k, 8.2% for AGIs $50k-75k, 8.4% for AGIs $75k-100k, 10.5% for AGIs $100k-200k, 6.3% for AGIs over 200k)
Charity contributions: $3,356 (reported on 15.3% of returns)
Here:
$3,356
State:
$4,025
(% of AGI for various income ranges: 0.6% for AGIs $25k-50k, 0.7% for AGIs $50k-75k, 1.3% for AGIs $75k-100k, 1.7% for AGIs $100k-200k, 0.8% for AGIs over 200k)
Taxes paid: $7,297 (reported on 20.9% of returns)
15679:
$7,297
State:
$9,982
(% of AGI for various income ranges: 0.6% for AGIs below $25k, 1.3% for AGIs $25k-50k, 2.4% for AGIs $50k-75k, 2.7% for AGIs $75k-100k, 4.3% for AGIs $100k-200k, 4.1% for AGIs over 200k)
Earned income credit: $1,870 (reported on 14.1% of returns)
Here:
$1,870
State:
$2,106
(% of AGI for various income ranges: 4.1% for AGIs below $25k, 0.9% for AGIs $25k-50k)
Percentage of individuals using paid preparers for their 2012 taxes: 55.8%
Here:
56%
State:
53%
(% for various income ranges: 47.7% for AGIs below $25k, 56.8% for AGIs $25k-50k, 61.5% for AGIs $50k-75k, 63.2% for AGIs $75k-100k, 78.6% for AGIs $100k-200k)
Averages for the 2004 tax year for zip code 15679, filed in 2005:
Average Adjusted Gross Income (AGI) in 2004: $35,232 (Individual Income Tax Returns)
Here:
$35,232
State:
$48,049
Salary/wage: $33,031 (reported on 86.2% of returns)
Here:
$33,031
State:
$42,646
(% of AGI for various income ranges: 99.3% for AGIs below $10k, 71.6% for AGIs $10k-25k, 83.7% for AGIs $25k-50k, 87.3% for AGIs $50k-75k, 85.4% for AGIs $75k-100k, 65.5% for AGIs over 100k)
Taxable interest for individuals: $1,047 (reported on 46.0% of returns)
This zip code:
$1,047
Pennsylvania:
$1,657
(% of AGI for various income ranges: 4.5% for AGIs below $10k, 2.9% for AGIs $10k-25k, 1.5% for AGIs $25k-50k, 0.7% for AGIs $50k-75k, 0.9% for AGIs $75k-100k, 1.0% for AGIs over 100k)
Taxable dividends: $888 (reported on 24.6% of returns)
Here:
$888
State:
$3,566
(% of AGI for various income ranges: 2.5% for AGIs below $10k, 0.8% for AGIs $10k-25k, 0.5% for AGIs $25k-50k, 0.2% for AGIs $50k-75k, 0.9% for AGIs $75k-100k, 0.9% for AGIs over 100k)
Net capital gain/loss: +$871 (reported on 13.3% of returns)
Here:
+$871
State:
+$9,716
(% of AGI for various income ranges: 1.9% for AGIs below $10k, -0.1% for AGIs $10k-25k, 0.2% for AGIs $25k-50k, -0.1% for AGIs $50k-75k, 0.7% for AGIs $75k-100k, 0.9% for AGIs over 100k)
Profit/loss from business: +$6,522 (reported on 12.3% of returns)
Here:
+$6,522
State:
+$14,267
(% of AGI for various income ranges: -7.6% for AGIs below $10k, 3.6% for AGIs $10k-25k, 3.8% for AGIs $25k-50k, 0.9% for AGIs $50k-75k, -0.1% for AGIs $75k-100k, 4.2% for AGIs over 100k)
IRA payment deduction: $2,898 (reported on 3.0% of returns)
15679:
$2,898
Pennsylvania:
$2,903
Total itemized deductions: $15,066 (22% of AGI, reported on 18.5% of returns)
Here:
$15,066
State:
$18,804
Here:
21.5% of AGI
State:
19.5% of AGI
(% of AGI for various income ranges: 5.7% for AGIs $10k-25k, 5.2% for AGIs $25k-50k, 8.5% for AGIs $50k-75k, 10.6% for AGIs $75k-100k, 12.2% for AGIs over 100k)
Charity contributions deductions: $2,343 (3% of AGI, reported on 15.4% of returns)
Here:
$2,343
State:
$3,337
Here:
3.2% of AGI
State:
3.3% of AGI
(% of AGI for various income ranges: 0.6% for AGIs $10k-25k, 0.5% for AGIs $25k-50k, 1.1% for AGIs $50k-75k, 1.9% for AGIs $75k-100k, 1.4% for AGIs over 100k)
Total tax: $4,258 (reported on 75.6% of returns)
15679:
$4,258
State:
$8,008
(% of AGI for various income ranges: 3.2% for AGIs below $10k, 4.3% for AGIs $10k-25k, 7.2% for AGIs $25k-50k, 8.1% for AGIs $50k-75k, 10.8% for AGIs $75k-100k, 17.3% for AGIs over 100k)
Earned income credit: $1,386 (reported on 14.4% of returns)
Here:
$1,386
State:
$1,643
Percentage of individuals using paid preparers for their 2004 taxes: 58.8%
Here:
59%
State:
56%
(% for various income ranges: 52.7% for AGIs below $10k, 58.7% for AGIs $10k-25k, 61.2% for AGIs $25k-50k, 59.9% for AGIs $50k-75k, 60.2% for AGIs $75k-100k, 70.0% for AGIs over 100k)
Household received Food Stamps/SNAP in the past 12 months: 345 Household did not receive Food Stamps/SNAP in the past 12 months: 992
Women who had a birth in the past 12 months: 12 (13 now married, 0 unmarried) Women who did not have a birth in the past 12 months: 331 (128 now married, 202 unmarried)
Housing units in zip code 15679 with a mortgage: 345 (50 second mortgage, 37 both second mortgage and home equity loan) Houses without a mortgage: 135
Median monthly owner costs for units with a mortgage: $1,281 Median monthly owner costs for units without a mortgage: $598
Residents with income below the poverty level in 2022:
This zip code:
6.5%
Whole state:
11.8%
Residents with income below 50% of the poverty level in 2022:
This zip code:
5.6%
Whole state:
6.1%
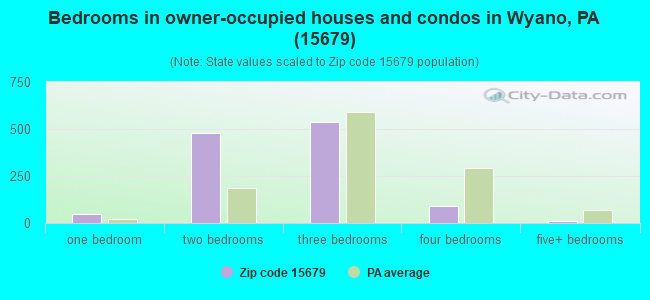
Median number of rooms in houses and condos:
Here:
5.8
State:
6.8
Median number of rooms in apartments:
Here:
5.5
State:
4.3
Notable locations in this zip code not listed on our city pages
In group quarters: 8 (-1 institutionalized population)
Size of family households: 405 2-persons, 166 3-persons, 45 4-persons, 19 5-persons, 9 6-persons
Size of nonfamily households: 587 1-person, 104 2-persons
100 married couples with children.
64 single-parent households (30 men, 34 women).
98.3% of residents of 15679 zip code speak English at home.
0.2% of residents speak Spanish at home (100% very well).
0.2% of residents speak other Indo-European language at home (100% very well).
1.5% of residents speak Asian or Pacific Island language at home (100% very well).
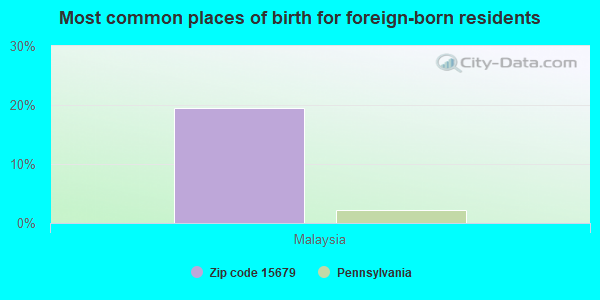
Foreign born population: 46 (1.8%) (20.7% of them are naturalized citizens)
This zip code:
1.8%
Whole state:
7.5%
20%Malaysia
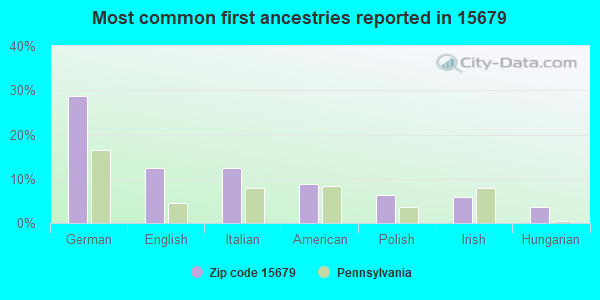
29%German
12%English
12%Italian
9%American
6%Polish
6%Irish
4%Hungarian
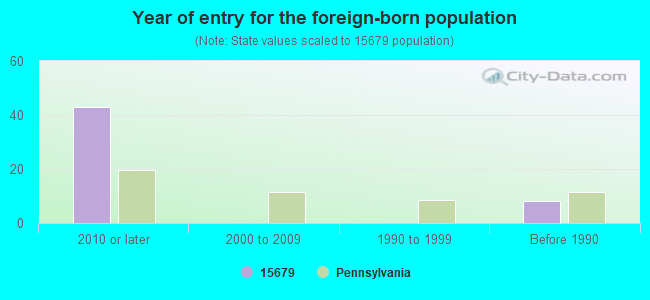
Year of entry for the foreign-born population
432010 or later
02000 to 2009
01990 to 1999
8Before 1990
Public elementary/middle schools in in zip code 15679 not listed on the city page:
MENDON EL SCH(Students: 305, Location: 164 ROUTE 31, Grades: KG-4)
Facilities with environmental interests located in this zip code:
BURNS W F TRUCKING (RD #2 in RUFFS DALE, PA)
STATE MASTER (Pennsylvania database) - RCRIS-PAD049679632, HAZARDOUS WASTE PROGRAM Small Quantity Generators, between 100 kg and 1000 kg of hazardous waste/month (Resource Conservation and Recovery Act (tracking hazardous waste)) - notification Organizations: OPERNAME (CONTACT/OPERATOR)
, BURNS, WILMER (CONTACT/OWNER)
Housing units lacking complete kitchen facilities: 3.0%
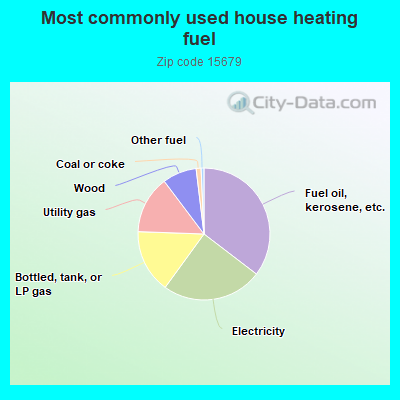
35.5%Fuel oil, kerosene, etc.
24.7%Electricity
15.6%Bottled, tank, or LP gas
14.2%Utility gas
8.4%Wood
1.2%Coal or coke
0.7%Other fuel
Population in 1990: 6,385.
Place of birth for U.S.-born residents:
This state: 2,242
Northeast: 11
Midwest: 100
South: 65
West: 11
80% of the 15679 zip code residents lived in the same house 5 years ago. Out of people who lived in different houses, 80% lived in this county. Out of people who lived in different counties, 50% lived in Pennsylvania.
97% of the 15679 zip code residents lived in the same house 1 year ago. Out of people who lived in different houses, 55% moved from this county. Out of people who lived in different houses, 55% moved from different county within same state.
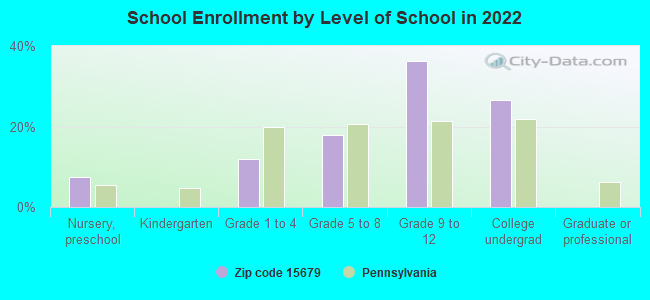
Private vs. public school enrollment:
Students in private schools in grades 1 to 8 (elementary and middle school):
Here:
0.0%
Pennsylvania:
15.7%
Students in private schools in grades 9 to 12 (high school):
Here:
0.0%
Pennsylvania:
13.4%
Students in private undergraduate colleges: 29
Here:
80.9%
Pennsylvania:
39.8%
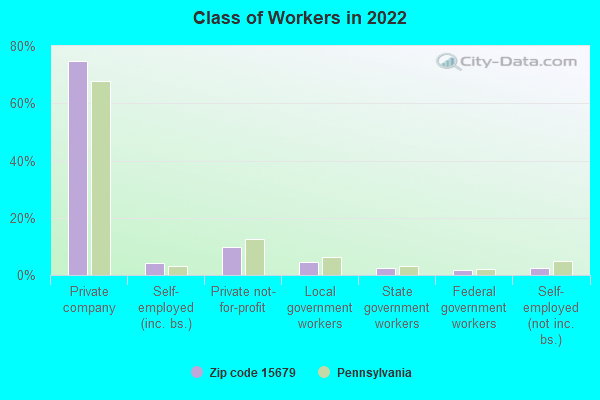
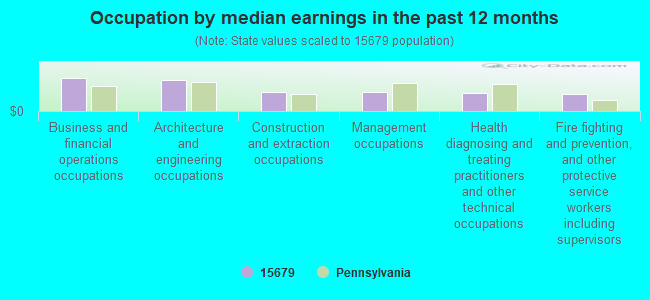
Occupation by median earnings in the past 12 months ($)
122,300Business and financial operations occupations
112,291Architecture and engineering occupations
70,247Construction and extraction occupations
69,157Management occupations
67,756Health diagnosing and treating practitioners and other technical occupations
60,788Fire fighting and prevention, and other protective service workers including supervisors
Top industries in this zip code by the number of employees in 2005:
Other Services (except Public Administration): General Automotive Repair (20-49 employees: 1 establishment, 1-4 employees: 1 establishment)
Health Care and Social Assistance: Residential Mental Retardation Facilities (10-19: 1)
Construction: Electrical Contractors (5-9: 1)
Other Services (except Public Administration): Commercial and Industrial Machinery and Equipment (except Automotive and Electronic) Repair and Maintenance (5-9: 1)
People in group quarters in 2010:
6 people in group homes intended for adults
People in group quarters in 2000:
6 people in other group homes
4 people in homes for the mentally retarded
4 people in other noninstitutional group quarters
Fatal accident statistics in 2014:
Fatal accident count: 1
Vehicles involved in fatal accidents: 2
Fatal accidents caused by drunken drivers: 0
Fatalities: 2
Persons involved in fatal accidents: 3
Pedestrians involved in fatal accidents: 0
Fatal accident statistics in 2013:
Fatal accident count: 1
Vehicles involved in fatal accidents: 1
Fatal accidents caused by drunken drivers: 1
Fatalities: 1
Persons involved in fatal accidents: 1
Pedestrians involved in fatal accidents: 0
Home Mortgage Disclosure Act Aggregated Statistics For Year 2009 (Based on 8 partial tracts)
A) FHA, FSA/RHS & VA Home Purchase Loans
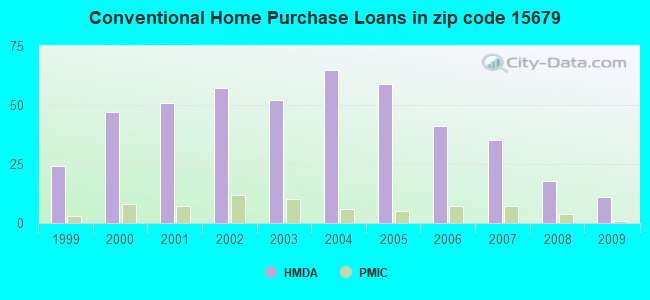
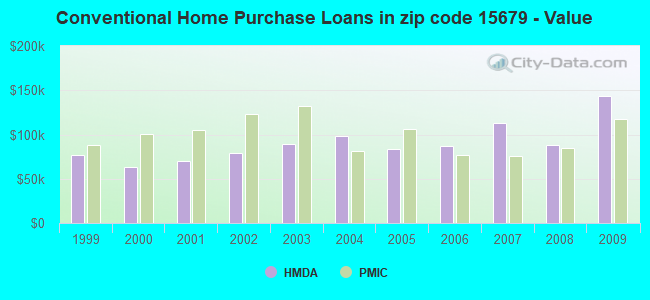
B) Conventional Home Purchase Loans
C) Refinancings
D) Home Improvement Loans
F) Non-occupant Loans on < 5 Family Dwellings (A B C & D)
G) Loans On Manufactured Home Dwelling (A B C & D)
Number
Average Value
Number
Average Value
Number
Average Value
Number
Average Value
Number
Average Value
Number
Average Value
LOANS ORIGINATED
16
$92,323
11
$143,135
50
$136,708
13
$29,745
3
$42,773
4
$65,608
APPLICATIONS APPROVED, NOT ACCEPTED
1
$44,630
1
$74,390
8
$125,575
2
$13,005
1
$54,810
0
$0
APPLICATIONS DENIED
1
$41,280
8
$73,124
38
$122,957
11
$19,923
2
$28,020
5
$71,612
APPLICATIONS WITHDRAWN
0
$0
3
$94,933
15
$134,803
1
$42,690
0
$0
0
$0
FILES CLOSED FOR INCOMPLETENESS
0
$0
0
$0
4
$111,538
0
$0
0
$0
0
$0
Aggregated Statistics For Year 2008 (Based on 8 partial tracts)
A) FHA, FSA/RHS & VA Home Purchase Loans
B) Conventional Home Purchase Loans
C) Refinancings
D) Home Improvement Loans
F) Non-occupant Loans on < 5 Family Dwellings (A B C & D)
G) Loans On Manufactured Home Dwelling (A B C & D)
Number
Average Value
Number
Average Value
Number
Average Value
Number
Average Value
Number
Average Value
Number
Average Value
LOANS ORIGINATED
14
$91,138
18
$87,695
47
$105,431
19
$51,807
3
$65,790
5
$89,098
APPLICATIONS APPROVED, NOT ACCEPTED
0
$0
2
$142,605
10
$112,432
2
$60,055
1
$39,150
2
$90,555
APPLICATIONS DENIED
1
$86,800
13
$74,611
55
$97,191
18
$49,586
2
$30,525
11
$70,659
APPLICATIONS WITHDRAWN
1
$58,480
1
$250,420
15
$115,044
3
$11,533
1
$23,010
2
$67,315
FILES CLOSED FOR INCOMPLETENESS
0
$0
1
$44,630
1
$140,350
1
$57,310
0
$0
0
$0
Aggregated Statistics For Year 2007 (Based on 8 partial tracts)
A) FHA, FSA/RHS & VA Home Purchase Loans
B) Conventional Home Purchase Loans
C) Refinancings
D) Home Improvement Loans
E) Loans on Dwellings For 5+ Families
F) Non-occupant Loans on < 5 Family Dwellings (A B C & D)
G) Loans On Manufactured Home Dwelling (A B C & D)
Number
Average Value
Number
Average Value
Number
Average Value
Number
Average Value
Number
Average Value
Number
Average Value
Number
Average Value
LOANS ORIGINATED
6
$94,777
35
$113,116
61
$86,497
32
$38,715
1
$138,870
3
$51,997
11
$60,409
APPLICATIONS APPROVED, NOT ACCEPTED
1
$52,110
7
$72,390
17
$119,690
7
$37,431
0
$0
1
$68,930
4
$68,398
APPLICATIONS DENIED
0
$0
12
$87,686
102
$109,820
16
$27,791
0
$0
2
$59,065
9
$61,928
APPLICATIONS WITHDRAWN
1
$37,430
5
$106,608
30
$93,075
4
$53,268
0
$0
1
$35,190
0
$0
FILES CLOSED FOR INCOMPLETENESS
0
$0
1
$151,460
7
$110,836
1
$97,560
0
$0
0
$0
1
$68,900
Aggregated Statistics For Year 2006 (Based on 8 partial tracts)
A) FHA, FSA/RHS & VA Home Purchase Loans
B) Conventional Home Purchase Loans
C) Refinancings
D) Home Improvement Loans
F) Non-occupant Loans on < 5 Family Dwellings (A B C & D)
G) Loans On Manufactured Home Dwelling (A B C & D)
Number
Average Value
Number
Average Value
Number
Average Value
Number
Average Value
Number
Average Value
Number
Average Value
LOANS ORIGINATED
7
$105,776
41
$86,967
99
$104,087
24
$35,132
8
$247,379
6
$62,650
APPLICATIONS APPROVED, NOT ACCEPTED
1
$87,790
8
$63,059
18
$91,598
6
$21,042
1
$10,150
2
$58,725
APPLICATIONS DENIED
3
$57,347
27
$66,313
102
$85,651
32
$37,056
3
$29,430
21
$49,315
APPLICATIONS WITHDRAWN
0
$0
3
$113,637
39
$83,219
4
$61,375
0
$0
0
$0
FILES CLOSED FOR INCOMPLETENESS
1
$55,500
0
$0
11
$138,817
0
$0
0
$0
0
$0
Aggregated Statistics For Year 2005 (Based on 8 partial tracts)
A) FHA, FSA/RHS & VA Home Purchase Loans
B) Conventional Home Purchase Loans
C) Refinancings
D) Home Improvement Loans
F) Non-occupant Loans on < 5 Family Dwellings (A B C & D)
G) Loans On Manufactured Home Dwelling (A B C & D)
Number
Average Value
Number
Average Value
Number
Average Value
Number
Average Value
Number
Average Value
Number
Average Value
LOANS ORIGINATED
3
$67,300
59
$83,956
108
$84,779
36
$29,242
3
$174,853
13
$44,198
APPLICATIONS APPROVED, NOT ACCEPTED
0
$0
6
$88,092
14
$82,716
7
$34,294
1
$100,220
3
$80,650
APPLICATIONS DENIED
0
$0
18
$60,116
103
$83,660
33
$30,469
8
$22,259
15
$57,163
APPLICATIONS WITHDRAWN
0
$0
8
$60,001
31
$107,939
6
$103,220
0
$0
1
$46,200
FILES CLOSED FOR INCOMPLETENESS
0
$0
2
$48,830
9
$90,553
3
$47,070
0
$0
0
$0
Aggregated Statistics For Year 2004 (Based on 8 partial tracts)
A) FHA, FSA/RHS & VA Home Purchase Loans
B) Conventional Home Purchase Loans
C) Refinancings
D) Home Improvement Loans
F) Non-occupant Loans on < 5 Family Dwellings (A B C & D)
G) Loans On Manufactured Home Dwelling (A B C & D)
Number
Average Value
Number
Average Value
Number
Average Value
Number
Average Value
Number
Average Value
Number
Average Value
LOANS ORIGINATED
4
$100,908
65
$98,409
121
$84,358
28
$31,226
12
$81,234
11
$60,284
APPLICATIONS APPROVED, NOT ACCEPTED
1
$57,160
9
$87,176
28
$91,494
7
$40,724
2
$42,650
6
$46,813
APPLICATIONS DENIED
0
$0
25
$63,002
102
$84,371
26
$30,868
9
$45,424
25
$51,472
APPLICATIONS WITHDRAWN
1
$143,630
8
$111,806
48
$104,071
6
$55,345
2
$47,675
3
$44,457
FILES CLOSED FOR INCOMPLETENESS
0
$0
1
$35,190
11
$87,188
3
$42,860
0
$0
1
$34,500
Aggregated Statistics For Year 2003 (Based on 8 partial tracts)
A) FHA, FSA/RHS & VA Home Purchase Loans
B) Conventional Home Purchase Loans
C) Refinancings
D) Home Improvement Loans
F) Non-occupant Loans on < 5 Family Dwellings (A B C & D)
Number
Average Value
Number
Average Value
Number
Average Value
Number
Average Value
Number
Average Value
LOANS ORIGINATED
5
$68,272
52
$89,279
225
$79,986
42
$32,494
5
$37,156
APPLICATIONS APPROVED, NOT ACCEPTED
0
$0
10
$70,446
51
$85,862
8
$38,564
3
$46,067
APPLICATIONS DENIED
0
$0
28
$49,611
136
$79,612
22
$27,027
8
$65,668
APPLICATIONS WITHDRAWN
1
$111,300
6
$91,255
72
$83,428
6
$30,550
2
$73,120
FILES CLOSED FOR INCOMPLETENESS
0
$0
0
$0
9
$93,039
2
$67,980
0
$0
Aggregated Statistics For Year 2002 (Based on 8 partial tracts)
A) FHA, FSA/RHS & VA Home Purchase Loans
B) Conventional Home Purchase Loans
C) Refinancings
D) Home Improvement Loans
F) Non-occupant Loans on < 5 Family Dwellings (A B C & D)
Number
Average Value
Number
Average Value
Number
Average Value
Number
Average Value
Number
Average Value
LOANS ORIGINATED
7
$87,949
57
$78,991
184
$83,774
45
$28,030
9
$46,187
APPLICATIONS APPROVED, NOT ACCEPTED
0
$0
9
$77,084
51
$84,958
11
$18,498
1
$6,090
APPLICATIONS DENIED
2
$79,865
21
$59,127
115
$75,134
21
$16,343
2
$108,280
APPLICATIONS WITHDRAWN
0
$0
5
$59,618
60
$76,025
5
$46,448
1
$31,320
FILES CLOSED FOR INCOMPLETENESS
1
$93,960
2
$88,535
8
$92,955
0
$0
1
$108,720
Aggregated Statistics For Year 2001 (Based on 8 partial tracts)
A) FHA, FSA/RHS & VA Home Purchase Loans
B) Conventional Home Purchase Loans
C) Refinancings
D) Home Improvement Loans
F) Non-occupant Loans on < 5 Family Dwellings (A B C & D)
Number
Average Value
Number
Average Value
Number
Average Value
Number
Average Value
Number
Average Value
LOANS ORIGINATED
7
$65,054
51
$70,280
183
$65,898
46
$25,579
5
$44,368
APPLICATIONS APPROVED, NOT ACCEPTED
0
$0
13
$51,548
55
$64,797
10
$29,743
2
$76,735
APPLICATIONS DENIED
0
$0
34
$43,927
110
$64,194
24
$21,400
3
$68,120
APPLICATIONS WITHDRAWN
1
$119,800
3
$98,597
50
$65,452
9
$26,557
1
$42,280
FILES CLOSED FOR INCOMPLETENESS
1
$54,030
1
$78,300
15
$82,875
2
$5,875
1
$117,140
Aggregated Statistics For Year 2000 (Based on 8 partial tracts)
A) FHA, FSA/RHS & VA Home Purchase Loans
B) Conventional Home Purchase Loans
C) Refinancings
D) Home Improvement Loans
F) Non-occupant Loans on < 5 Family Dwellings (A B C & D)
Number
Average Value
Number
Average Value
Number
Average Value
Number
Average Value
Number
Average Value
LOANS ORIGINATED
4
$63,750
47
$62,866
62
$59,064
27
$23,572
3
$26,807
APPLICATIONS APPROVED, NOT ACCEPTED
1
$52,790
9
$52,626
25
$55,973
8
$20,691
0
$0
APPLICATIONS DENIED
0
$0
49
$41,633
51
$65,495
19
$16,546
1
$26,410
APPLICATIONS WITHDRAWN
0
$0
5
$97,954
26
$55,553
3
$7,743
1
$53,310
FILES CLOSED FOR INCOMPLETENESS
0
$0
2
$59,675
10
$77,557
0
$0
0
$0
Aggregated Statistics For Year 1999 (Based on 4 partial tracts)
A) FHA, FSA/RHS & VA Home Purchase Loans
B) Conventional Home Purchase Loans
C) Refinancings
D) Home Improvement Loans
F) Non-occupant Loans on < 5 Family Dwellings (A B C & D)
2005 - 2018 National Fire Incident Reporting System (NFIRS) incidents
According to the data from the years 2005 - 2018 the average number of fire incidents per year is 14. The highest number of fire incidents - 33 took place in 2014, and the least - 0 in 2013. The data has a rising trend.
When looking into fire subcategories, the most incidents belonged to: Structure Fires (45.8%), and Outside Fires (33.2%).
Fire incident types reported to NFIRS in Zip Code 15679


 Nearest zip codes: 15695, 15698, 15479, 15639, 15612, 15688.


 (Students: 786, Location: 171 ROUTE 31, Grades: 5-8)

 According to the data from the years 2005 - 2018 the average number of fire incidents per year is 14. The highest number of fire incidents - 33 took place in 2014, and the least - 0 in 2013. The data has a rising trend.
 When looking into fire subcategories, the most incidents belonged to: Structure Fires (45.8%), and Outside Fires (33.2%).