Estimated zip code population in 2022: 2,387 Zip code population in 2010: 2,432 Zip code population in 2000: 3,098
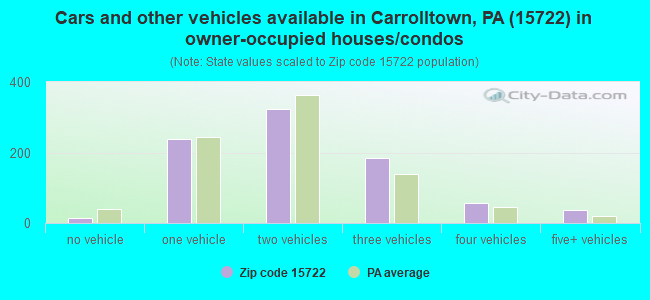
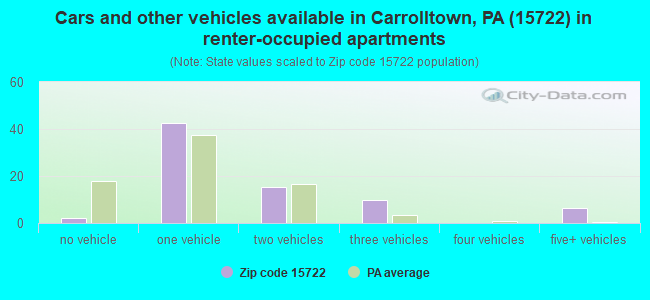
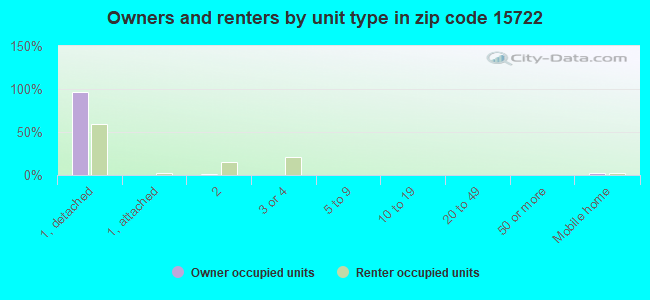
Houses and condos: 1,024 Renter-occupied apartments: 74
% of renters here:
8%
State:
31%
March 2022 cost of living index in zip code 15722: 90.4 (less than average, U.S. average is 100)
Land area: 20.4 sq. mi. Water area: 0.0 sq. mi.
Population density: 117 people per square mile
(very low).
OSM Map
General Map
Google Map
MSN Map
OSM Map
General Map
Google Map
MSN Map
OSM Map
General Map
Google Map
MSN Map
OSM Map
General Map
Google Map
MSN Map
Please wait while loading the map...
Real estate property taxes paid for housing units in 2022:
This zip code:
1.0% ($1,344)
Pennsylvania:
1.3% ($3,094)
Median real estate property taxes paid for housing units with mortgages in 2022: $1,598 (1.0%) Median real estate property taxes paid for housing units with no mortgage in 2022: $1,207 (1.0%)
Business Search- 14 Million verified businesses
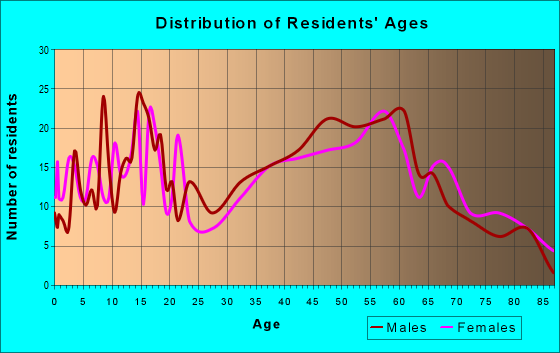
Males: 1,277
(53.5%)
Females: 1,109
(46.5%)
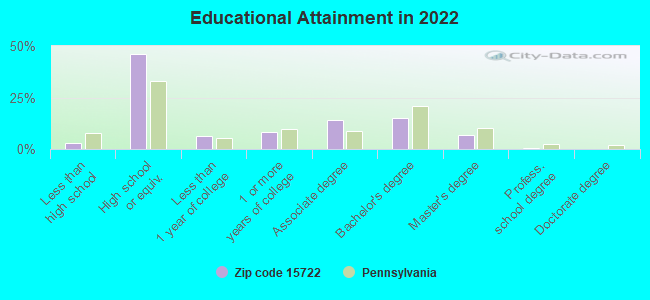
For population 25 years and over in 15722:
High school or higher: 96.7%
Bachelor's degree or higher: 22.8%
Graduate or professional degree: 7.7%
Unemployed: 2.2%
Mean travel time to work (commute): 24.2 minutes
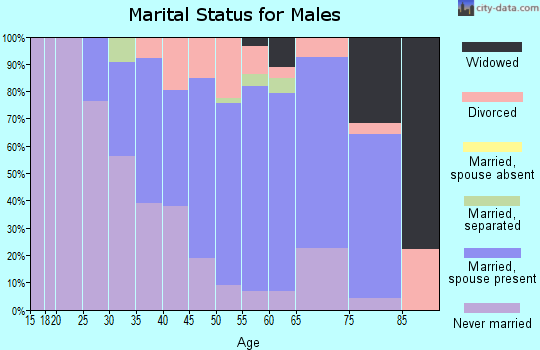
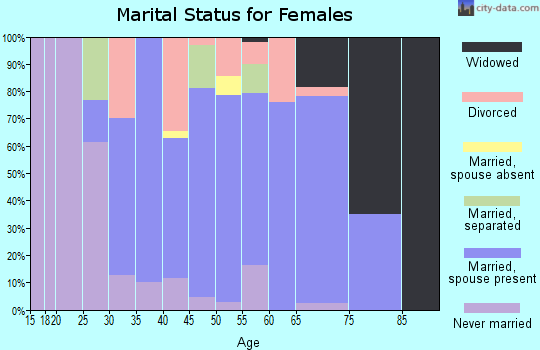
For population 15 years and over in 15722:
Never married: 28.3%
Now married: 53.7%
Separated: 0.5%
Widowed: 7.6%
Divorced: 9.9%
Zip code 15722 compared to state average:
Median house value below state average.
Unemployed percentage below state average.
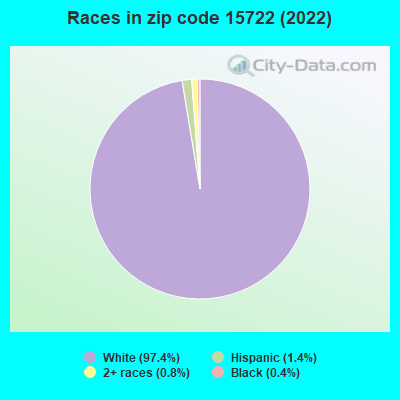
Black race population percentage significantly below state average.
Hispanic race population percentage significantly below state average.
Foreign-born population percentage significantly below state average.
Renting percentage significantly below state average.
Length of stay since moving in significantly above state average.
Percentage of population with a bachelor's degree or higher below state average.
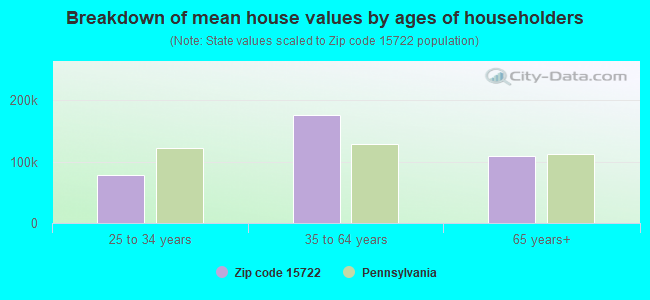
Estimated median house/condo value in 2022: $139,573
15722:
$139,573
Pennsylvania:
$245,500
According to our research of Pennsylvania and other state lists, there was 1 registered sex offender living in 15722 zip code as of April 26, 2024. The ratio of all residents to sex offenders in zip code 15722 is 2,367 to 1. The ratio of registered sex offenders to all residents in this zip code is much lower than the state average.
Median resident age:
This zip code:
43.1 years
Pennsylvania median age:
40.9 years
Average household size:
This zip code:
2.5 people
Pennsylvania:
2.4 people
Averages for the 2020 tax year for zip code 15722, filed in 2021:
Average Adjusted Gross Income (AGI) in 2020: $52,342 (Individual Income Tax Returns)
Here:
$52,342
State:
$75,707
Salary/wage: $48,441 (reported on 75.2% of returns)
Here:
$48,441
State:
$62,806
(% of AGI for various income ranges: 1011.7% for AGIs below $25k, 3394.5% for AGIs $25k-50k, 6090.8% for AGIs $50k-75k, 8953.0% for AGIs $75k-100k, 15118.0% for AGIs $100k-200k)
Taxable interest for individuals: $791 (reported on 39.8% of returns)
This zip code:
$791
Pennsylvania:
$1,633
(% of AGI for various income ranges: 33.0% for AGIs below $25k, 31.8% for AGIs $25k-50k, 58.3% for AGIs $50k-75k, 21.0% for AGIs $75k-100k, 119.0% for AGIs $100k-200k)
Ordinary dividends: $1,833 (reported on 21.2% of returns)
Here:
$1,833
State:
$7,382
(% of AGI for various income ranges: 41.7% for AGIs below $25k, 42.3% for AGIs $25k-50k, 25.0% for AGIs $50k-75k, 27.0% for AGIs $75k-100k, 194.0% for AGIs $100k-200k)
Net capital gain/loss in AGI: +$5,033 (reported on 15.9% of returns)
Here:
+$5,033
State:
+$23,522
(% of AGI for various income ranges: 17.4% for AGIs below $25k, 11.8% for AGIs $25k-50k, 121.7% for AGIs $50k-75k, 55.0% for AGIs $75k-100k, 639.0% for AGIs $100k-200k)
Profit/loss from business: +$13,800 (reported on 8.8% of returns)
Here:
+$13,800
State:
+$16,274
(% of AGI for various income ranges: 29.1% for AGIs below $25k, 122.7% for AGIs $25k-50k, 55.0% for AGIs $75k-100k, 988.0% for AGIs $100k-200k)
Taxable individual retirement arrangement distribution: $11,424 (reported on 15.0% of returns)
15722:
$11,424
Pennsylvania:
$18,583
(% of AGI for various income ranges: 173.5% for AGIs below $25k, 113.2% for AGIs $25k-50k, 647.5% for AGIs $50k-75k, 517.0% for AGIs $100k-200k)
Earned income credit: $2,080 (reported on 8.8% of returns)
Here:
$2,080
State:
$2,100
(% of AGI for various income ranges: 40.0% for AGIs below $25k, 52.7% for AGIs $25k-50k)
Percentage of individuals using paid preparers for their 2020 taxes: 95.6%
Here:
96%
State:
92%
(% for various income ranges: 92.5% for AGIs below $25k, 96.4% for AGIs $25k-50k, 94.1% for AGIs $50k-75k, 100.0% for AGIs $75k-100k, 100.0% for AGIs $100k-200k)
Averages for the 2012 tax year for zip code 15722, filed in 2013:
Average Adjusted Gross Income (AGI) in 2012: $43,483 (Individual Income Tax Returns)
Here:
$43,483
State:
$61,346
Salary/wage: $38,265 (reported on 81.4% of returns)
Here:
$38,265
State:
$51,902
(% of AGI for various income ranges: 66.5% for AGIs below $25k, 78.6% for AGIs $25k-50k, 78.8% for AGIs $50k-75k, 77.4% for AGIs $75k-100k, 58.7% for AGIs $100k-200k)
Taxable interest for individuals: $1,023 (reported on 38.9% of returns)
This zip code:
$1,023
Pennsylvania:
$1,588
(% of AGI for various income ranges: 2.1% for AGIs below $25k, 0.9% for AGIs $25k-50k, 0.5% for AGIs $50k-75k, 0.6% for AGIs $75k-100k, 1.0% for AGIs $100k-200k)
Ordinary dividends: $1,927 (reported on 19.5% of returns)
Here:
$1,927
State:
$5,827
(% of AGI for various income ranges: 1.3% for AGIs below $25k, 1.3% for AGIs $25k-50k, 1.0% for AGIs $50k-75k, 0.8% for AGIs $75k-100k, 0.3% for AGIs $100k-200k)
Net capital gain/loss in AGI: +$4,686 (reported on 12.4% of returns)
Here:
+$4,686
State:
+$14,495
(% of AGI for various income ranges: 0.6% for AGIs below $25k, 0.1% for AGIs $25k-50k, 0.2% for AGIs $50k-75k, 4.2% for AGIs $100k-200k)
Profit/loss from business: +$16,667 (reported on 10.6% of returns)
Here:
+$16,667
State:
+$16,268
(% of AGI for various income ranges: 4.1% for AGIs below $25k, 5.5% for AGIs $50k-75k, 8.4% for AGIs $100k-200k)
Taxable individual retirement arrangement distribution: $10,821 (reported on 12.4% of returns)
15722:
$10,821
Pennsylvania:
$14,550
(% of AGI for various income ranges: 3.9% for AGIs below $25k, 2.6% for AGIs $25k-50k, 2.7% for AGIs $50k-75k, 9.4% for AGIs $75k-100k)
Total itemized deductions: $18,500 (21% of AGI, reported on 13.3% of returns)
Here:
$18,500
State:
$23,538
Here:
21.4% of AGI
State:
18.4% of AGI
(% of AGI for various income ranges: 4.7% for AGIs $25k-50k, 4.6% for AGIs $50k-75k, 4.2% for AGIs $75k-100k, 10.1% for AGIs $100k-200k)
Charity contributions: $2,922 (reported on 8.0% of returns)
Here:
$2,922
State:
$4,025
Taxes paid: $6,253 (reported on 13.3% of returns)
15722:
$6,253
State:
$9,982
(% of AGI for various income ranges: 1.1% for AGIs $25k-50k, 1.4% for AGIs $50k-75k, 1.5% for AGIs $75k-100k, 3.9% for AGIs $100k-200k)
Earned income credit: $1,793 (reported on 12.4% of returns)
Here:
$1,793
State:
$2,106
(% of AGI for various income ranges: 3.6% for AGIs below $25k, 0.7% for AGIs $25k-50k)
Percentage of individuals using paid preparers for their 2012 taxes: 61.9%
Here:
62%
State:
53%
(% for various income ranges: 60.0% for AGIs below $25k, 60.0% for AGIs $25k-50k, 63.2% for AGIs $50k-75k, 66.7% for AGIs $75k-100k, 70.0% for AGIs $100k-200k)
Averages for the 2004 tax year for zip code 15722, filed in 2005:
Average Adjusted Gross Income (AGI) in 2004: $40,840 (Individual Income Tax Returns)
Here:
$40,840
State:
$48,049
Salary/wage: $35,650 (reported on 86.5% of returns)
Here:
$35,650
State:
$42,646
(% of AGI for various income ranges: 72.2% for AGIs $10k-25k, 80.1% for AGIs $25k-50k, 82.2% for AGIs $50k-75k, 88.6% for AGIs $75k-100k, 41.3% for AGIs over 100k)
Taxable interest for individuals: $1,421 (reported on 52.1% of returns)
This zip code:
$1,421
Pennsylvania:
$1,657
(% of AGI for various income ranges: 3.5% for AGIs $10k-25k, 1.7% for AGIs $25k-50k, 1.5% for AGIs $50k-75k, 0.8% for AGIs $75k-100k, 1.7% for AGIs over 100k)
Taxable dividends: $1,375 (reported on 25.9% of returns)
Here:
$1,375
State:
$3,566
(% of AGI for various income ranges: 1.6% for AGIs $10k-25k, 1.0% for AGIs $25k-50k, 0.9% for AGIs $50k-75k, 0.3% for AGIs $75k-100k, 0.2% for AGIs over 100k)
Net capital gain/loss: +$1,701 (reported on 18.2% of returns)
Here:
+$1,701
State:
+$9,716
(% of AGI for various income ranges: 0.0% for AGIs $10k-25k, 0.5% for AGIs $25k-50k, 2.0% for AGIs $50k-75k, 0.0% for AGIs $75k-100k, 0.4% for AGIs over 100k)
Profit/loss from business: +$12,643 (reported on 13.3% of returns)
Here:
+$12,643
State:
+$14,267
(% of AGI for various income ranges: 4.7% for AGIs $10k-25k, 2.3% for AGIs $25k-50k, 3.4% for AGIs $50k-75k, 15.3% for AGIs $75k-100k)
Profit/loss from farming: +$2,400 (reported on 1.2% of returns)
Here:
+$2,400
State:
+$274
IRA payment deduction: $2,615 (reported on 7.5% of returns)
15722:
$2,615
Pennsylvania:
$2,903
Total itemized deductions: $15,174 (23% of AGI, reported on 15.3% of returns)
Here:
$15,174
State:
$18,804
Here:
22.5% of AGI
State:
19.5% of AGI
(% of AGI for various income ranges: 2.4% for AGIs $10k-25k, 4.4% for AGIs $25k-50k, 6.0% for AGIs $50k-75k, 7.0% for AGIs $75k-100k, 10.7% for AGIs over 100k)
Charity contributions deductions: $3,165 (4% of AGI, reported on 11.9% of returns)
Here:
$3,165
State:
$3,337
Here:
4.5% of AGI
State:
3.3% of AGI
(% of AGI for various income ranges: 0.8% for AGIs $25k-50k, 0.9% for AGIs $50k-75k, 0.3% for AGIs $75k-100k, 3.0% for AGIs over 100k)
Total tax: $4,127 (reported on 86.4% of returns)
15722:
$4,127
State:
$8,008
(% of AGI for various income ranges: 4.5% for AGIs $10k-25k, 6.6% for AGIs $25k-50k, 8.3% for AGIs $50k-75k, 9.2% for AGIs $75k-100k, 19.5% for AGIs over 100k)
Earned income credit: $1,772 (reported on 10.6% of returns)
Here:
$1,772
State:
$1,643
Percentage of individuals using paid preparers for their 2004 taxes: 72.4%
Here:
72%
State:
56%
(% for various income ranges: 66.1% for AGIs $10k-25k, 72.9% for AGIs $25k-50k, 77.8% for AGIs $50k-75k, 78.7% for AGIs $75k-100k, 92.6% for AGIs over 100k)
Household received Food Stamps/SNAP in the past 12 months: 74 Household did not receive Food Stamps/SNAP in the past 12 months: 852
Women who had a birth in the past 12 months: 12 (12 now married, 0 unmarried) Women who did not have a birth in the past 12 months: 377 (194 now married, 180 unmarried)
Housing units in zip code 15722 with a mortgage: 414 (43 second mortgage, 40 both second mortgage and home equity loan) Houses without a mortgage: 26
Median monthly owner costs for units with a mortgage: $1,056 Median monthly owner costs for units without a mortgage: $471
Residents with income below the poverty level in 2022:
This zip code:
7.9%
Whole state:
11.8%
Residents with income below 50% of the poverty level in 2022:
This zip code:
6.4%
Whole state:
6.1%
Median number of rooms in houses and condos:
Here:
6.4
State:
6.8
Median number of rooms in apartments:
Here:
5.2
State:
4.3
Notable locations in this zip code not listed on our city pages
In group quarters: 22 (-1 institutionalized population)
Size of family households: 283 2-persons, 113 3-persons, 74 4-persons, 79 5-persons, 35 6-persons, 13 7-or-more-persons
Size of nonfamily households: 272 1-person, 58 2-persons
449 married couples with children.
55 single-parent households (55 women).
98.6% of residents of 15722 zip code speak English at home.
0.7% of residents speak Spanish at home (18% very well, 24% well, 59% not well).
0.2% of residents speak other Indo-European language at home (100% well).
Foreign born population: 4 (0.2%) (100.0% of them are naturalized citizens)
This zip code:
0.2%
Whole state:
7.5%
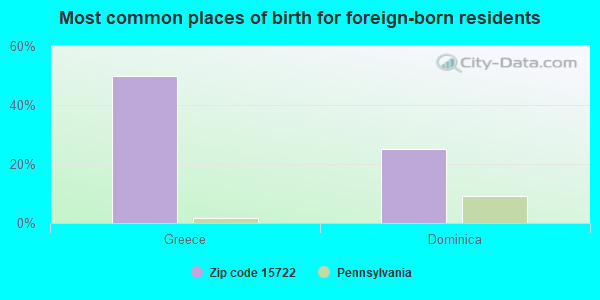
50%Greece
25%Dominica
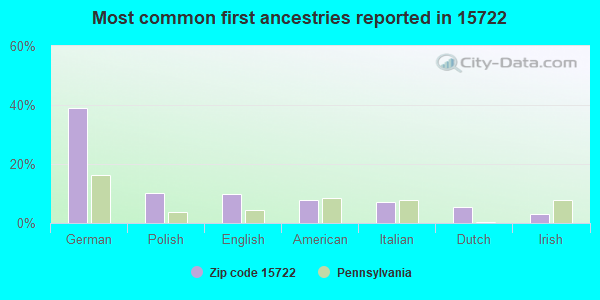
39%German
10%Polish
10%English
8%American
7%Italian
6%Dutch
3%Irish
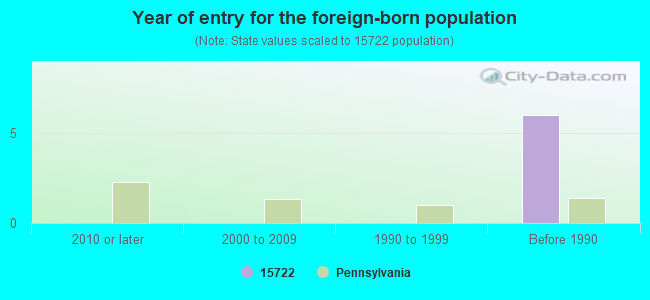
Year of entry for the foreign-born population
02010 or later
02000 to 2009
01990 to 1999
6Before 1990
Facilities with environmental interests located in this zip code:
B & B CONST STP (RR 1 ROUTE 219 in CARROLLTOWN, PA)
National Pollutant Discharge Elimination System NON-MAJOR (Tracking pollutant discharge elimination systems) - permit Business SIC classification: SEWERAGE SYSTEMS Alternative names: BESHARA, JAMES, JAMES BESHARA
Housing units lacking complete plumbing facilities: 2.1% Housing units lacking complete kitchen facilities: 2.3%
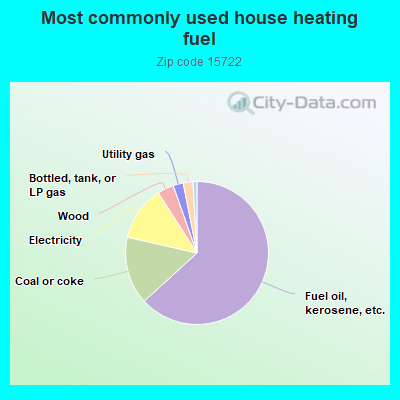
63.4%Fuel oil, kerosene, etc.
15.4%Coal or coke
12.4%Electricity
3.7%Wood
2.3%Utility gas
2.2%Bottled, tank, or LP gas
0.9%Other fuel
Population in 1990: 2,644. Population change in the 1990s: +454 (+17.2%).
Place of birth for U.S.-born residents:
This state: 2,235
Northeast: 47
Midwest: 20
South: 49
West: 5
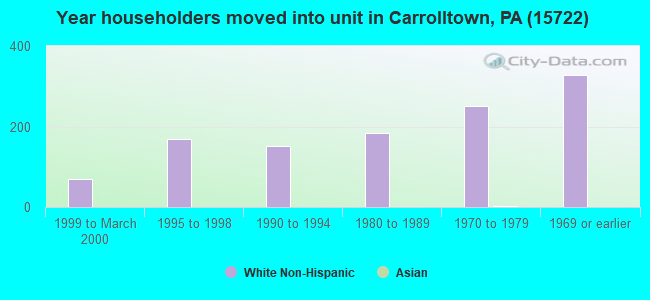
79% of the 15722 zip code residents lived in the same house 5 years ago. Out of people who lived in different houses, 78% lived in this county. Out of people who lived in different counties, 50% lived in Pennsylvania.
96% of the 15722 zip code residents lived in the same house 1 year ago. Out of people who lived in different houses, 87% moved from this county. Out of people who lived in different houses, 11% moved from different county within same state. Out of people who lived in different houses, 5% moved from different state.
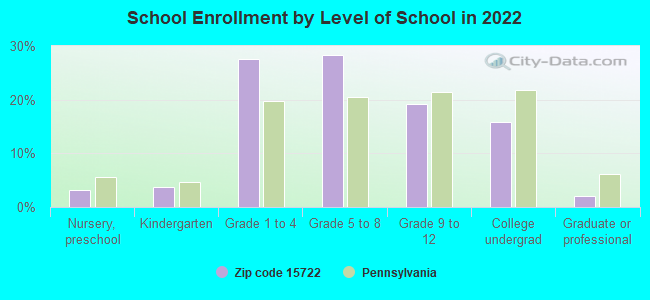
Private vs. public school enrollment:
Students in private schools in grades 1 to 8 (elementary and middle school): 80
Here:
25.9%
Pennsylvania:
15.7%
Students in private schools in grades 9 to 12 (high school): 18
Here:
17.2%
Pennsylvania:
13.4%
Students in private undergraduate colleges: 37
Here:
41.7%
Pennsylvania:
39.8%
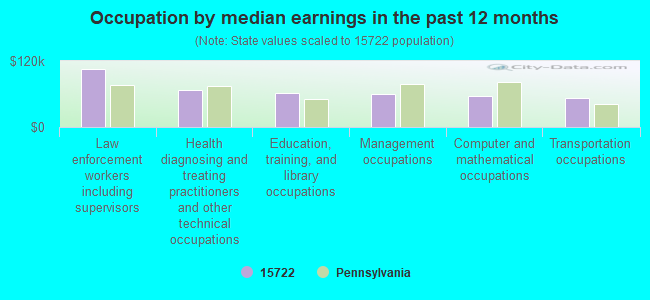
Occupation by median earnings in the past 12 months ($)
105,609Law enforcement workers including supervisors
67,293Health diagnosing and treating practitioners and other technical occupations
61,487Education, training, and library occupations
59,823Management occupations
56,735Computer and mathematical occupations
52,924Transportation occupations
Top industries in this zip code by the number of employees in 2005:
Information: Cable and Other Program Distribution (20-49 employees: 1 establishment)
Mining: Bituminous Coal and Lignite Surface Mining (20-49: 1)
Finance and Insurance: Insurance Agencies and Brokerages (10-19: 1, 5-9: 1, 1-4: 2)
Health Care and Social Assistance: Ambulance Services (10-19: 1)
Mining: Dimension Stone Mining and Quarrying (10-19: 1)
People in group quarters in 2010:
3 people in group homes intended for adults
People in group quarters in 2000:
20 people in other noninstitutional group quarters
6 people in homes for the mentally retarded
2 people in religious group quarters
Fatal accident statistics in 2012:
Fatal accident count: 1
Vehicles involved in fatal accidents: 2
Fatal accidents caused by drunken drivers: 1
Fatalities: 1
Persons involved in fatal accidents: 4
Pedestrians involved in fatal accidents: 0
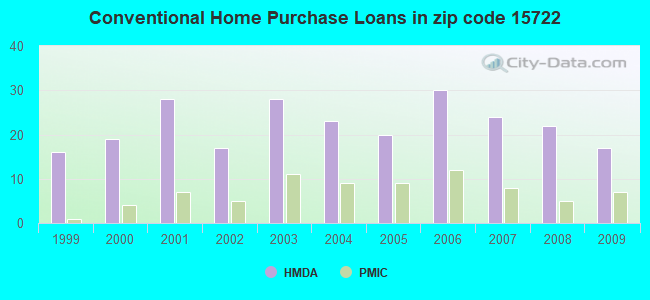
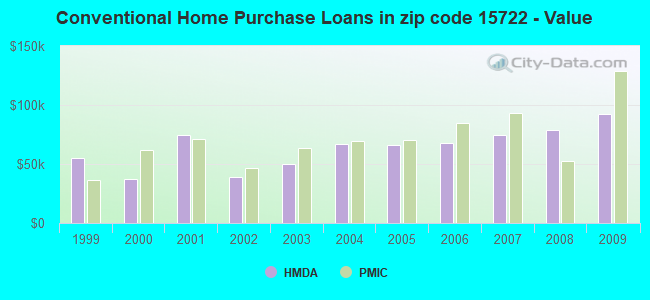
Home Mortgage Disclosure Act Aggregated Statistics For Year 2009 (Based on 2 partial tracts)
A) FHA, FSA/RHS & VA Home Purchase Loans
B) Conventional Home Purchase Loans
C) Refinancings
D) Home Improvement Loans
F) Non-occupant Loans on < 5 Family Dwellings (A B C & D)
G) Loans On Manufactured Home Dwelling (A B C & D)
Number
Average Value
Number
Average Value
Number
Average Value
Number
Average Value
Number
Average Value
Number
Average Value
LOANS ORIGINATED
3
$65,577
17
$92,027
41
$92,446
20
$34,568
2
$44,030
6
$37,160
APPLICATIONS APPROVED, NOT ACCEPTED
0
$0
0
$0
5
$77,754
3
$19,360
0
$0
0
$0
APPLICATIONS DENIED
1
$55,270
4
$67,918
19
$85,002
7
$12,446
3
$16,863
4
$83,610
APPLICATIONS WITHDRAWN
1
$44,030
5
$99,114
7
$84,311
1
$71,200
0
$0
1
$33,720
FILES CLOSED FOR INCOMPLETENESS
0
$0
0
$0
1
$30,910
1
$56,210
0
$0
1
$56,210
Aggregated Statistics For Year 2008 (Based on 2 partial tracts)
A) FHA, FSA/RHS & VA Home Purchase Loans
B) Conventional Home Purchase Loans
C) Refinancings
D) Home Improvement Loans
F) Non-occupant Loans on < 5 Family Dwellings (A B C & D)
G) Loans On Manufactured Home Dwelling (A B C & D)
Number
Average Value
Number
Average Value
Number
Average Value
Number
Average Value
Number
Average Value
Number
Average Value
LOANS ORIGINATED
7
$119,107
22
$78,734
22
$94,319
28
$24,223
1
$73,070
5
$55,458
APPLICATIONS APPROVED, NOT ACCEPTED
0
$0
1
$139,580
6
$79,315
4
$40,750
0
$0
3
$72,133
APPLICATIONS DENIED
1
$99,300
7
$97,293
27
$103,430
14
$34,193
4
$51,055
1
$29,980
APPLICATIONS WITHDRAWN
0
$0
2
$82,440
7
$102,647
1
$23,420
0
$0
1
$75,880
FILES CLOSED FOR INCOMPLETENESS
0
$0
0
$0
6
$82,438
0
$0
0
$0
0
$0
Aggregated Statistics For Year 2007 (Based on 2 partial tracts)
A) FHA, FSA/RHS & VA Home Purchase Loans
B) Conventional Home Purchase Loans
C) Refinancings
D) Home Improvement Loans
E) Loans on Dwellings For 5+ Families
F) Non-occupant Loans on < 5 Family Dwellings (A B C & D)
G) Loans On Manufactured Home Dwelling (A B C & D)
Number
Average Value
Number
Average Value
Number
Average Value
Number
Average Value
Number
Average Value
Number
Average Value
Number
Average Value
LOANS ORIGINATED
5
$62,578
24
$74,320
38
$71,197
42
$31,963
1
$250,130
4
$17,800
7
$65,844
APPLICATIONS APPROVED, NOT ACCEPTED
0
$0
7
$40,951
7
$96,759
4
$34,192
0
$0
1
$168,620
3
$38,720
APPLICATIONS DENIED
1
$73,070
12
$45,669
44
$90,082
20
$31,945
0
$0
1
$70,260
7
$53,531
APPLICATIONS WITHDRAWN
0
$0
1
$60,890
17
$103,489
0
$0
0
$0
0
$0
0
$0
FILES CLOSED FOR INCOMPLETENESS
0
$0
0
$0
7
$126,334
0
$0
0
$0
0
$0
0
$0
Aggregated Statistics For Year 2006 (Based on 2 partial tracts)
B) Conventional Home Purchase Loans
C) Refinancings
D) Home Improvement Loans
F) Non-occupant Loans on < 5 Family Dwellings (A B C & D)
G) Loans On Manufactured Home Dwelling (A B C & D)
Number
Average Value
Number
Average Value
Number
Average Value
Number
Average Value
Number
Average Value
LOANS ORIGINATED
30
$68,043
50
$65,332
26
$24,213
5
$46,652
4
$27,635
APPLICATIONS APPROVED, NOT ACCEPTED
2
$29,040
13
$64,063
3
$31,227
1
$70,260
2
$40,750
APPLICATIONS DENIED
8
$78,222
45
$68,490
20
$48,152
0
$0
3
$24,670
APPLICATIONS WITHDRAWN
5
$105,484
15
$73,008
1
$5,620
2
$70,260
0
$0
FILES CLOSED FOR INCOMPLETENESS
1
$151,760
3
$70,260
0
$0
0
$0
0
$0
Aggregated Statistics For Year 2005 (Based on 2 partial tracts)
A) FHA, FSA/RHS & VA Home Purchase Loans
B) Conventional Home Purchase Loans
C) Refinancings
D) Home Improvement Loans
F) Non-occupant Loans on < 5 Family Dwellings (A B C & D)
G) Loans On Manufactured Home Dwelling (A B C & D)
Number
Average Value
Number
Average Value
Number
Average Value
Number
Average Value
Number
Average Value
Number
Average Value
LOANS ORIGINATED
2
$53,400
20
$65,950
52
$61,991
37
$21,876
3
$22,170
8
$44,264
APPLICATIONS APPROVED, NOT ACCEPTED
1
$50,590
4
$59,955
13
$54,911
5
$39,346
0
$0
3
$35,287
APPLICATIONS DENIED
1
$50,590
10
$43,374
48
$57,086
12
$30,680
5
$31,476
11
$54,079
APPLICATIONS WITHDRAWN
0
$0
2
$133,025
22
$78,223
2
$14,050
0
$0
1
$44,970
FILES CLOSED FOR INCOMPLETENESS
0
$0
0
$0
2
$70,730
0
$0
0
$0
0
$0
Aggregated Statistics For Year 2004 (Based on 2 partial tracts)
A) FHA, FSA/RHS & VA Home Purchase Loans
B) Conventional Home Purchase Loans
C) Refinancings
D) Home Improvement Loans
F) Non-occupant Loans on < 5 Family Dwellings (A B C & D)
G) Loans On Manufactured Home Dwelling (A B C & D)
Number
Average Value
Number
Average Value
Number
Average Value
Number
Average Value
Number
Average Value
Number
Average Value
LOANS ORIGINATED
2
$85,250
23
$67,124
66
$63,177
44
$25,038
3
$50,273
7
$35,197
APPLICATIONS APPROVED, NOT ACCEPTED
0
$0
6
$69,635
9
$68,490
1
$18,740
1
$30,910
2
$72,135
APPLICATIONS DENIED
0
$0
10
$44,966
31
$101,779
13
$17,727
2
$68,385
8
$44,030
APPLICATIONS WITHDRAWN
0
$0
3
$43,717
24
$72,797
4
$46,372
1
$71,200
1
$56,210
FILES CLOSED FOR INCOMPLETENESS
0
$0
1
$17,800
8
$116,046
0
$0
0
$0
0
$0
Aggregated Statistics For Year 2003 (Based on 2 partial tracts)
A) FHA, FSA/RHS & VA Home Purchase Loans
B) Conventional Home Purchase Loans
C) Refinancings
D) Home Improvement Loans
F) Non-occupant Loans on < 5 Family Dwellings (A B C & D)
Number
Average Value
Number
Average Value
Number
Average Value
Number
Average Value
Number
Average Value
LOANS ORIGINATED
1
$118,970
28
$49,885
93
$62,020
48
$26,152
5
$46,466
APPLICATIONS APPROVED, NOT ACCEPTED
0
$0
5
$41,406
8
$76,584
4
$15,925
0
$0
APPLICATIONS DENIED
0
$0
5
$56,396
29
$44,676
8
$15,106
0
$0
APPLICATIONS WITHDRAWN
0
$0
3
$59,020
15
$85,249
3
$38,410
1
$112,420
FILES CLOSED FOR INCOMPLETENESS
0
$0
0
$0
5
$80,940
0
$0
0
$0
Aggregated Statistics For Year 2002 (Based on 2 partial tracts)
A) FHA, FSA/RHS & VA Home Purchase Loans
B) Conventional Home Purchase Loans
C) Refinancings
D) Home Improvement Loans
F) Non-occupant Loans on < 5 Family Dwellings (A B C & D)
Number
Average Value
Number
Average Value
Number
Average Value
Number
Average Value
Number
Average Value
LOANS ORIGINATED
2
$69,325
17
$39,180
62
$52,884
41
$17,160
2
$43,095
APPLICATIONS APPROVED, NOT ACCEPTED
1
$24,360
1
$15,930
10
$58,456
3
$12,490
0
$0
APPLICATIONS DENIED
0
$0
10
$45,903
38
$52,190
10
$23,795
3
$69,947
APPLICATIONS WITHDRAWN
0
$0
3
$44,653
13
$67,882
1
$79,630
0
$0
FILES CLOSED FOR INCOMPLETENESS
0
$0
1
$21,550
5
$57,332
0
$0
0
$0
Aggregated Statistics For Year 2001 (Based on 2 partial tracts)
A) FHA, FSA/RHS & VA Home Purchase Loans
B) Conventional Home Purchase Loans
C) Refinancings
D) Home Improvement Loans
F) Non-occupant Loans on < 5 Family Dwellings (A B C & D)
Number
Average Value
Number
Average Value
Number
Average Value
Number
Average Value
Number
Average Value
LOANS ORIGINATED
5
$57,332
28
$74,710
56
$55,137
41
$18,668
2
$39,345
APPLICATIONS APPROVED, NOT ACCEPTED
0
$0
3
$63,077
9
$73,694
2
$22,485
0
$0
APPLICATIONS DENIED
0
$0
8
$41,336
22
$53,653
13
$12,106
3
$39,033
APPLICATIONS WITHDRAWN
0
$0
2
$34,195
9
$45,174
4
$21,312
0
$0
FILES CLOSED FOR INCOMPLETENESS
0
$0
0
$0
4
$45,902
0
$0
0
$0
Aggregated Statistics For Year 2000 (Based on 2 partial tracts)
A) FHA, FSA/RHS & VA Home Purchase Loans
B) Conventional Home Purchase Loans
C) Refinancings
D) Home Improvement Loans
F) Non-occupant Loans on < 5 Family Dwellings (A B C & D)
Number
Average Value
Number
Average Value
Number
Average Value
Number
Average Value
Number
Average Value
LOANS ORIGINATED
1
$37,470
19
$37,324
20
$38,596
45
$11,720
2
$7,025
APPLICATIONS APPROVED, NOT ACCEPTED
0
$0
3
$33,100
7
$64,506
1
$12,180
0
$0
APPLICATIONS DENIED
0
$0
15
$30,852
14
$46,639
9
$16,446
1
$11,240
APPLICATIONS WITHDRAWN
0
$0
1
$5,620
7
$63,434
2
$32,790
0
$0
FILES CLOSED FOR INCOMPLETENESS
0
$0
1
$72,130
2
$38,875
0
$0
0
$0
Aggregated Statistics For Year 1999 (Based on 1 partial tract)
A) FHA, FSA/RHS & VA Home Purchase Loans
B) Conventional Home Purchase Loans
C) Refinancings
D) Home Improvement Loans
F) Non-occupant Loans on < 5 Family Dwellings (A B C & D)


 Nearest zip codes: 15773, 15737, 15775, 15927, 15760, 16646.