Estimated zip code population in 2022: 18,747 Zip code population in 2010: 14,396 Zip code population in 2000: 9,786
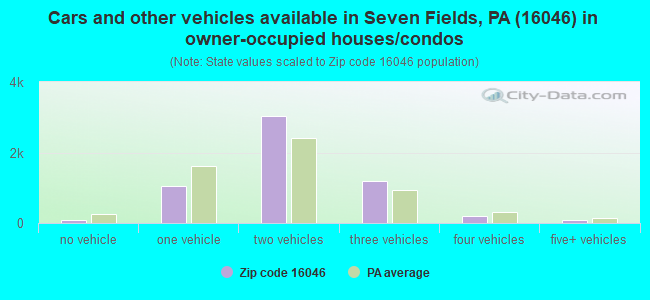
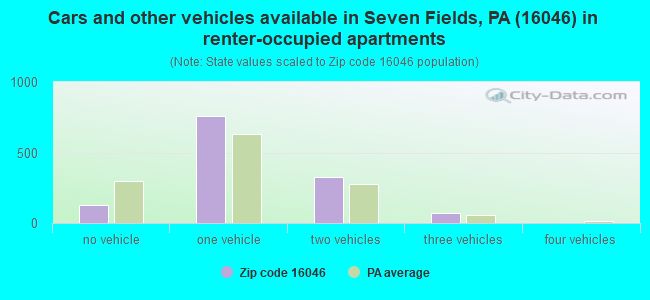
Houses and condos: 7,360 Renter-occupied apartments: 1,279
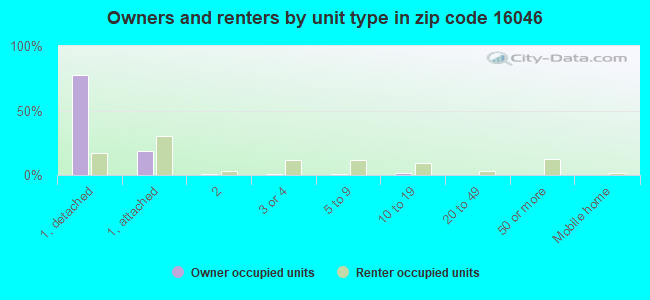
% of renters here:
18%
State:
31%
March 2022 cost of living index in zip code 16046: 92.9 (less than average, U.S. average is 100)
Land area: 22.7 sq. mi. Water area: 0.0 sq. mi.
Population density: 824 people per square mile
(low).
OSM Map
General Map
Google Map
MSN Map
OSM Map
General Map
Google Map
MSN Map
OSM Map
General Map
Google Map
MSN Map
OSM Map
General Map
Google Map
MSN Map
Please wait while loading the map...
Real estate property taxes paid for housing units in 2022:
This zip code:
0.9% ($4,482)
Pennsylvania:
1.3% ($3,094)
Median real estate property taxes paid for housing units with mortgages in 2022: $4,609 (0.9%) Median real estate property taxes paid for housing units with no mortgage in 2022: $4,040 (0.9%)
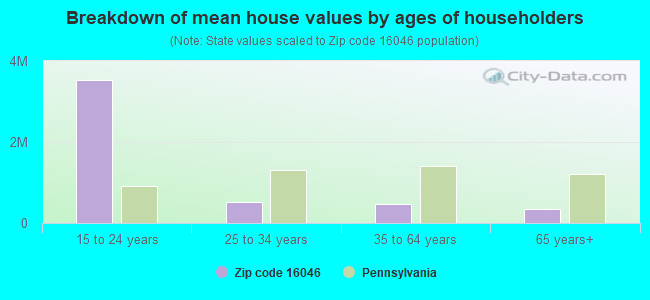
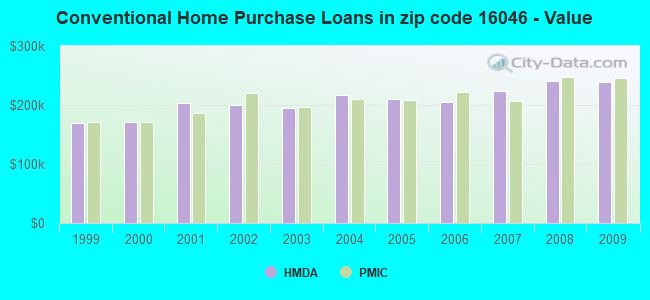
Estimated median house/condo value in 2022: $492,954
16046:
$492,954
Pennsylvania:
$245,500
According to our research of Pennsylvania and other state lists, there were 9 registered sex offenders living in 16046 zip code as of April 27, 2024. The ratio of all residents to sex offenders in zip code 16046 is 1,761 to 1. The ratio of registered sex offenders to all residents in this zip code is much lower than the state average.
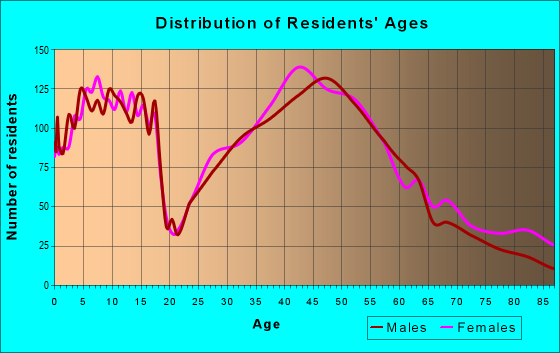
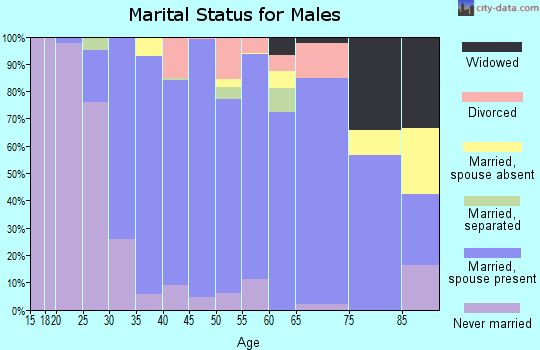
Median resident age:
This zip code:
40.3 years
Pennsylvania median age:
40.9 years
Average household size:
This zip code:
2.7 people
Pennsylvania:
2.4 people
Averages for the 2020 tax year for zip code 16046, filed in 2021:
Average Adjusted Gross Income (AGI) in 2020: $148,610 (Individual Income Tax Returns)
Here:
$148,610
State:
$75,707
Salary/wage: $129,282 (reported on 83.3% of returns)
Here:
$129,282
State:
$62,806
(% of AGI for various income ranges: 1110.5% for AGIs below $25k, 3493.2% for AGIs $25k-50k, 6137.0% for AGIs $50k-75k, 9072.4% for AGIs $75k-100k, 18149.0% for AGIs $100k-200k, 89049.4% for AGIs over 200k)
Taxable interest for individuals: $1,844 (reported on 48.4% of returns)
This zip code:
$1,844
Pennsylvania:
$1,633
(% of AGI for various income ranges: 26.9% for AGIs below $25k, 33.6% for AGIs $25k-50k, 69.1% for AGIs $50k-75k, 103.7% for AGIs $75k-100k, 165.7% for AGIs $100k-200k, 634.5% for AGIs over 200k)
Ordinary dividends: $6,477 (reported on 41.8% of returns)
Here:
$6,477
State:
$7,382
(% of AGI for various income ranges: 76.4% for AGIs below $25k, 101.8% for AGIs $25k-50k, 177.2% for AGIs $50k-75k, 202.9% for AGIs $75k-100k, 400.4% for AGIs $100k-200k, 2251.5% for AGIs over 200k)
Net capital gain/loss in AGI: +$16,978 (reported on 38.0% of returns)
Here:
+$16,978
State:
+$23,522
(% of AGI for various income ranges: 37.6% for AGIs below $25k, 104.2% for AGIs $25k-50k, 129.1% for AGIs $50k-75k, 293.9% for AGIs $75k-100k, 507.9% for AGIs $100k-200k, 7042.8% for AGIs over 200k)
Profit/loss from business: +$26,176 (reported on 16.1% of returns)
Here:
+$26,176
State:
+$16,274
(% of AGI for various income ranges: 126.4% for AGIs below $25k, 226.1% for AGIs $25k-50k, 297.1% for AGIs $50k-75k, 463.2% for AGIs $75k-100k, 681.0% for AGIs $100k-200k, 3164.2% for AGIs over 200k)
Taxable individual retirement arrangement distribution: $27,119 (reported on 12.6% of returns)
16046:
$27,119
Pennsylvania:
$18,583
(% of AGI for various income ranges: 106.9% for AGIs below $25k, 241.7% for AGIs $25k-50k, 426.4% for AGIs $50k-75k, 621.4% for AGIs $75k-100k, 888.1% for AGIs $100k-200k, 1468.0% for AGIs over 200k)
Self-employed (Keogh) retirement plans: $27,486 (reported on 1.5% of returns)
16046:
$27,486
Pennsylvania:
$25,407
(% of AGI for various income ranges: 45.5% for AGIs $100k-200k, 456.1% for AGIs over 200k)
Total itemized deductions: $35,394 (reported on 18.2% of returns)
Here:
$35,394
State:
$34,850
(% of AGI for various income ranges: 99.1% for AGIs below $25k, 180.3% for AGIs $25k-50k, 254.3% for AGIs $50k-75k, 565.1% for AGIs $75k-100k, 993.1% for AGIs $100k-200k, 5552.8% for AGIs over 200k)
Charity contributions: $10,353 (reported on 15.0% of returns)
Here:
$10,353
State:
$12,392
(% of AGI for various income ranges: 5.6% for AGIs below $25k, 20.2% for AGIs $25k-50k, 30.3% for AGIs $50k-75k, 81.9% for AGIs $75k-100k, 172.9% for AGIs $100k-200k, 1598.0% for AGIs over 200k)
Taxes paid: $8,972 (reported on 18.2% of returns)
16046:
$8,972
State:
$8,200
(% of AGI for various income ranges: 16.9% for AGIs below $25k, 29.8% for AGIs $25k-50k, 74.5% for AGIs $50k-75k, 163.7% for AGIs $75k-100k, 316.9% for AGIs $100k-200k, 1290.7% for AGIs over 200k)
Earned income credit: $1,607 (reported on 3.2% of returns)
Here:
$1,607
State:
$2,100
(% of AGI for various income ranges: 23.6% for AGIs below $25k, 25.0% for AGIs $25k-50k)
Percentage of individuals using paid preparers for their 2020 taxes: 91.7%
Here:
92%
State:
92%
(% for various income ranges: 88.2% for AGIs below $25k, 90.3% for AGIs $25k-50k, 91.9% for AGIs $50k-75k, 92.0% for AGIs $75k-100k, 92.8% for AGIs $100k-200k, 94.9% for AGIs over 200k)
Averages for the 2012 tax year for zip code 16046, filed in 2013:
Average Adjusted Gross Income (AGI) in 2012: $116,593 (Individual Income Tax Returns)
Here:
$116,593
State:
$61,346
Salary/wage: $99,844 (reported on 86.5% of returns)
Here:
$99,844
State:
$51,902
(% of AGI for various income ranges: 71.8% for AGIs below $25k, 74.5% for AGIs $25k-50k, 77.2% for AGIs $50k-75k, 79.6% for AGIs $75k-100k, 84.0% for AGIs $100k-200k, 67.3% for AGIs over 200k)
Taxable interest for individuals: $1,735 (reported on 49.6% of returns)
This zip code:
$1,735
Pennsylvania:
$1,588
(% of AGI for various income ranges: 1.7% for AGIs below $25k, 0.9% for AGIs $25k-50k, 0.7% for AGIs $50k-75k, 0.5% for AGIs $75k-100k, 0.5% for AGIs $100k-200k, 0.9% for AGIs over 200k)
Ordinary dividends: $5,341 (reported on 38.3% of returns)
Here:
$5,341
State:
$5,827
(% of AGI for various income ranges: 3.1% for AGIs below $25k, 2.1% for AGIs $25k-50k, 1.5% for AGIs $50k-75k, 1.2% for AGIs $75k-100k, 1.2% for AGIs $100k-200k, 2.1% for AGIs over 200k)
Net capital gain/loss in AGI: +$13,642 (reported on 29.7% of returns)
Here:
+$13,642
State:
+$14,495
(% of AGI for various income ranges: 0.7% for AGIs $25k-50k, 0.4% for AGIs $50k-75k, 1.0% for AGIs $75k-100k, 1.0% for AGIs $100k-200k, 6.1% for AGIs over 200k)
Profit/loss from business: +$25,041 (reported on 15.3% of returns)
Here:
+$25,041
State:
+$16,268
(% of AGI for various income ranges: 5.4% for AGIs below $25k, 5.5% for AGIs $25k-50k, 3.6% for AGIs $50k-75k, 3.7% for AGIs $75k-100k, 3.6% for AGIs $100k-200k, 2.7% for AGIs over 200k)
Taxable individual retirement arrangement distribution: $20,262 (reported on 12.4% of returns)
16046:
$20,262
Pennsylvania:
$14,550
(% of AGI for various income ranges: 5.2% for AGIs below $25k, 3.6% for AGIs $25k-50k, 3.4% for AGIs $50k-75k, 3.7% for AGIs $75k-100k, 2.2% for AGIs $100k-200k, 1.5% for AGIs over 200k)
Self-employment retirement plans: $18,555 (reported on 1.5% of returns)
16046:
$18,555
Pennsylvania:
$20,922
(% of AGI for various income ranges: 0.4% for AGIs $25k-50k, 0.2% for AGIs $100k-200k, 0.3% for AGIs over 200k)
Total itemized deductions: $27,817 (15% of AGI, reported on 51.5% of returns)
Here:
$27,817
State:
$23,538
Here:
14.5% of AGI
State:
18.4% of AGI
(% of AGI for various income ranges: 12.8% for AGIs below $25k, 9.9% for AGIs $25k-50k, 12.4% for AGIs $50k-75k, 14.6% for AGIs $75k-100k, 14.9% for AGIs $100k-200k, 10.7% for AGIs over 200k)
Charity contributions: $4,478 (reported on 44.3% of returns)
Here:
$4,478
State:
$4,025
(% of AGI for various income ranges: 0.8% for AGIs below $25k, 0.8% for AGIs $25k-50k, 1.3% for AGIs $50k-75k, 1.6% for AGIs $75k-100k, 1.7% for AGIs $100k-200k, 1.9% for AGIs over 200k)
Taxes paid: $12,856 (reported on 51.4% of returns)
16046:
$12,856
State:
$9,982
(% of AGI for various income ranges: 2.7% for AGIs below $25k, 2.9% for AGIs $25k-50k, 4.4% for AGIs $50k-75k, 5.7% for AGIs $75k-100k, 6.6% for AGIs $100k-200k, 5.6% for AGIs over 200k)
Earned income credit: $1,711 (reported on 4.9% of returns)
Here:
$1,711
State:
$2,106
(% of AGI for various income ranges: 2.5% for AGIs below $25k, 0.4% for AGIs $25k-50k)
Percentage of individuals using paid preparers for their 2012 taxes: 51.5%
Here:
52%
State:
53%
(% for various income ranges: 43.0% for AGIs below $25k, 51.5% for AGIs $25k-50k, 52.8% for AGIs $50k-75k, 52.6% for AGIs $75k-100k, 52.0% for AGIs $100k-200k, 66.0% for AGIs over 200k)
Averages for the 2004 tax year for zip code 16046, filed in 2005:
Average Adjusted Gross Income (AGI) in 2004: $79,864 (Individual Income Tax Returns)
Here:
$79,864
State:
$48,049
Salary/wage: $73,818 (reported on 85.1% of returns)
Here:
$73,818
State:
$42,646
(% of AGI for various income ranges: 79.7% for AGIs below $10k, 69.1% for AGIs $10k-25k, 77.7% for AGIs $25k-50k, 82.8% for AGIs $50k-75k, 85.9% for AGIs $75k-100k, 76.9% for AGIs over 100k)
Taxable interest for individuals: $1,492 (reported on 64.4% of returns)
This zip code:
$1,492
Pennsylvania:
$1,657
(% of AGI for various income ranges: 4.9% for AGIs below $10k, 4.0% for AGIs $10k-25k, 1.4% for AGIs $25k-50k, 1.2% for AGIs $50k-75k, 1.3% for AGIs $75k-100k, 1.0% for AGIs over 100k)
Taxable dividends: $2,716 (reported on 42.1% of returns)
Here:
$2,716
State:
$3,566
(% of AGI for various income ranges: 5.8% for AGIs below $10k, 3.1% for AGIs $10k-25k, 1.5% for AGIs $25k-50k, 1.4% for AGIs $50k-75k, 1.1% for AGIs $75k-100k, 1.4% for AGIs over 100k)
Net capital gain/loss: +$5,653 (reported on 32.9% of returns)
Here:
+$5,653
State:
+$9,716
(% of AGI for various income ranges: -2.2% for AGIs below $10k, 0.1% for AGIs $10k-25k, 0.1% for AGIs $25k-50k, 0.4% for AGIs $50k-75k, 1.2% for AGIs $75k-100k, 3.3% for AGIs over 100k)
Profit/loss from business: +$18,492 (reported on 16.4% of returns)
Here:
+$18,492
State:
+$14,267
(% of AGI for various income ranges: 6.0% for AGIs below $10k, 5.8% for AGIs $10k-25k, 5.4% for AGIs $25k-50k, 4.0% for AGIs $50k-75k, 2.9% for AGIs $75k-100k, 3.6% for AGIs over 100k)
IRA payment deduction: $3,196 (reported on 3.4% of returns)
16046:
$3,196
Pennsylvania:
$2,903
(% of AGI for various income ranges: 0.5% for AGIs $10k-25k, 0.3% for AGIs $25k-50k, 0.3% for AGIs $50k-75k, 0.2% for AGIs $75k-100k, 0.1% for AGIs over 100k)
Self-employed pension: $12,121 (reported on 1.7% of returns)
Here:
$12,121
Pennsylvania:
$14,674
(% of AGI for various income ranges: 0.7% for AGIs $10k-25k, 0.3% for AGIs $50k-75k, 0.1% for AGIs $75k-100k, 0.3% for AGIs over 100k)
Total itemized deductions: $21,874 (17% of AGI, reported on 51.9% of returns)
Here:
$21,874
State:
$18,804
Here:
17.2% of AGI
State:
19.5% of AGI
(% of AGI for various income ranges: 10.9% for AGIs below $10k, 11.7% for AGIs $10k-25k, 12.7% for AGIs $25k-50k, 15.7% for AGIs $50k-75k, 18.0% for AGIs $75k-100k, 13.5% for AGIs over 100k)
Charity contributions deductions: $3,315 (3% of AGI, reported on 47.9% of returns)
Here:
$3,315
State:
$3,337
Here:
2.5% of AGI
State:
3.3% of AGI
(% of AGI for various income ranges: 0.3% for AGIs below $10k, 1.7% for AGIs $10k-25k, 1.2% for AGIs $25k-50k, 1.8% for AGIs $50k-75k, 2.1% for AGIs $75k-100k, 2.1% for AGIs over 100k)
Total tax: $15,098 (reported on 83.2% of returns)
16046:
$15,098
State:
$8,008
(% of AGI for various income ranges: 2.4% for AGIs below $10k, 5.0% for AGIs $10k-25k, 8.2% for AGIs $25k-50k, 9.4% for AGIs $50k-75k, 10.1% for AGIs $75k-100k, 19.6% for AGIs over 100k)
Earned income credit: $1,336 (reported on 4.3% of returns)
Here:
$1,336
State:
$1,643
Percentage of individuals using paid preparers for their 2004 taxes: 51.8%
Here:
52%
State:
56%
(% for various income ranges: 43.3% for AGIs below $10k, 51.1% for AGIs $10k-25k, 49.0% for AGIs $25k-50k, 57.2% for AGIs $50k-75k, 50.0% for AGIs $75k-100k, 58.3% for AGIs over 100k)
Household received Food Stamps/SNAP in the past 12 months: 167 Household did not receive Food Stamps/SNAP in the past 12 months: 6,752
Women who had a birth in the past 12 months: 267 (259 now married, 20 unmarried) Women who did not have a birth in the past 12 months: 3,722 (2,254 now married, 1,441 unmarried)
Housing units in zip code 16046 with a mortgage: 4,059 (735 second mortgage, 710 both second mortgage and home equity loan) Houses without a mortgage: 170
Median monthly owner costs for units with a mortgage: $2,319 Median monthly owner costs for units without a mortgage: $849
Residents with income below the poverty level in 2022:
This zip code:
2.8%
Whole state:
11.8%
Residents with income below 50% of the poverty level in 2022:
This zip code:
0.4%
Whole state:
6.1%
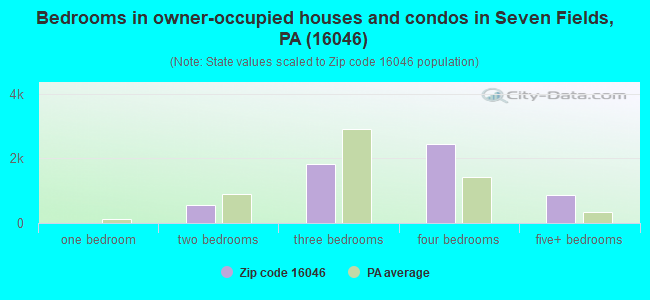
Median number of rooms in houses and condos:
Here:
8.5
State:
6.8
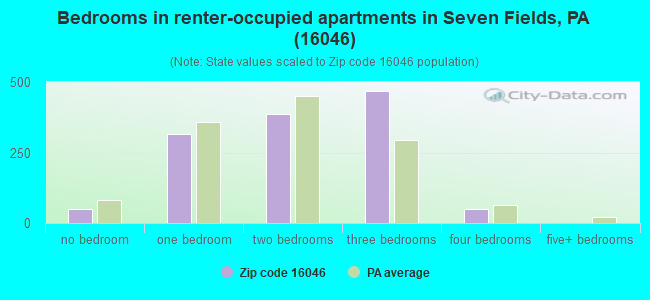
Median number of rooms in apartments:
Here:
4.9
State:
4.3
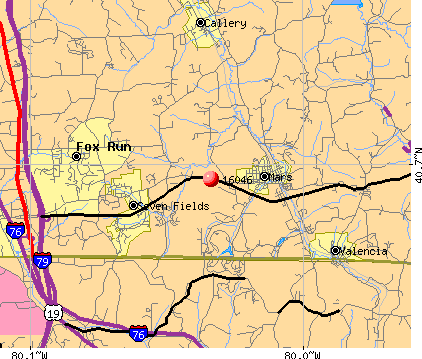
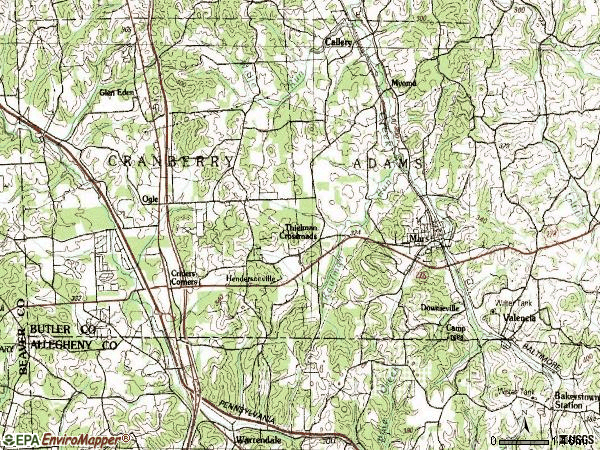
Notable locations in this zip code not listed on our city pages
Notable locations in zip code 16046: Venango Trail Golf Course (A), Family Resources Center (B), Mars Volunteer Fire Company (C), Fresh Air Home (D). Display/hide their locations on the map
Churches in zip code 16046 include: The Mars Alliance Church (A), Fountain Park Church (B), Mount Pleasant Church (C), Old Union Church (D). Display/hide their locations on the map
In group quarters: 172 (-1 institutionalized population)
Size of family households: 1,812 2-persons, 1,230 3-persons, 1,303 4-persons, 380 5-persons, 173 6-persons, 152 7-or-more-persons
Size of nonfamily households: 1,520 1-person, 326 2-persons, 16 4-persons
4,642 married couples with children.
353 single-parent households (161 men, 192 women).
91.3% of residents of 16046 zip code speak English at home.
0.8% of residents speak Spanish at home (77% very well, 3% well, 20% not well).
3.6% of residents speak other Indo-European language at home (82% very well, 16% well, 2% not at all).
2.7% of residents speak Asian or Pacific Island language at home (82% very well, 12% well, 6% not well).
0.8% of residents speak other language at home (85% very well, 15% not well).
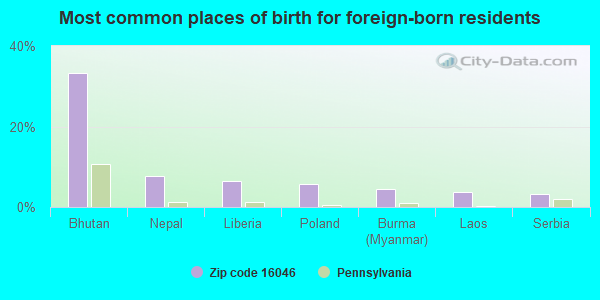
Foreign born population: 1,220 (6.5%) (59.4% of them are naturalized citizens)
This zip code:
6.5%
Whole state:
7.5%
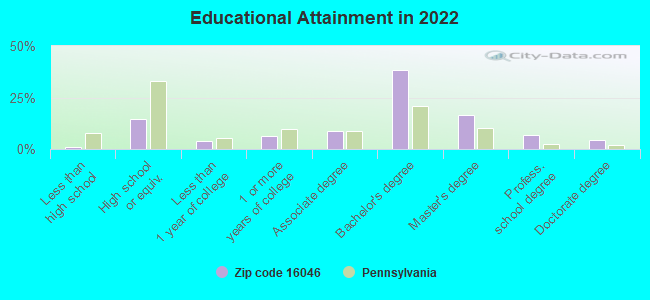
33%Bhutan
8%Nepal
7%Liberia
6%Poland
5%Burma (Myanmar)
4%Laos
3%Serbia
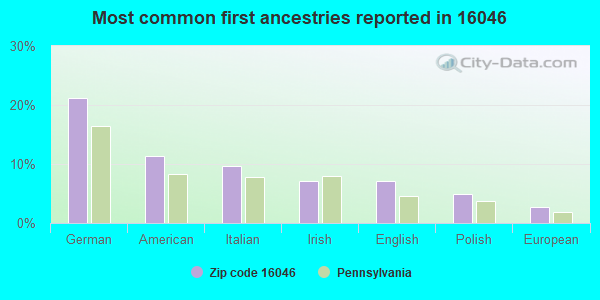
21%German
11%American
10%Italian
7%Irish
7%English
5%Polish
3%European
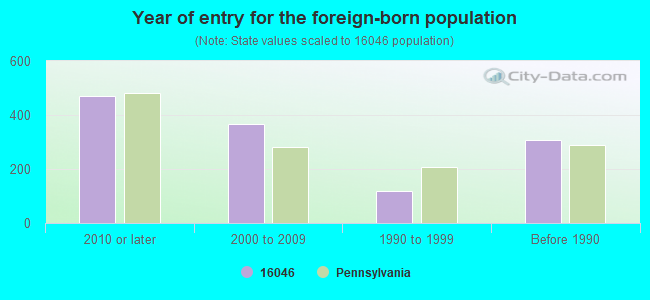
Year of entry for the foreign-born population
4702010 or later
3652000 to 2009
1171990 to 1999
309Before 1990
Facilities with environmental interests located in this zip code:
ADAMS EL SCH ( in MARS, PA)
(National Center for Education Statistics) - STATE ID-1155 Organizations: MARS AREA SD (SCHOOL DISTRICT)
BASILON DRY CLEANERS (IRVINE ST in MARS, PA)
AIR MINOR (AIRS/AFS) Small Quantity Generators, between 100 kg and 1000 kg of hazardous waste/month (Resource Conservation and Recovery Act (tracking hazardous waste)) - notification Business SIC classification: DRYCLEANING PLANTS, EXCEPT RUG CLEANING Organizations: OPERNAME (CONTACT/OPERATOR)
, BASILON, GEORGE (CONTACT/OWNER)
Alternative names: BASILON CLEANERS
A CUBED CORP (CONCAST METAL in MARS, PA)
National Pollutant Discharge Elimination System NON-MAJOR (Tracking pollutant discharge elimination systems) - permit Business SIC classification: SECONDARY SMELTING AND REFINING OF NONFERROUS METALS
Housing units lacking complete kitchen facilities: 1.2%
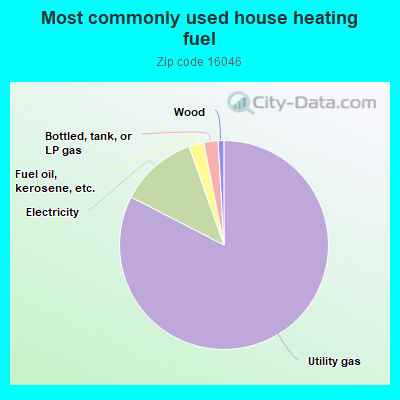
82.5%Utility gas
12.0%Electricity
2.3%Fuel oil, kerosene, etc.
2.2%Bottled, tank, or LP gas
0.9%Wood
Population in 1990: 10,192.
Place of birth for U.S.-born residents:
This state: 12,631
Northeast: 1,393
Midwest: 1,816
South: 1,339
West: 328
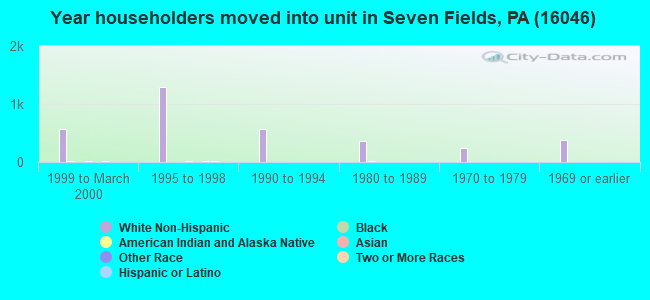
51% of the 16046 zip code residents lived in the same house 5 years ago. Out of people who lived in different houses, 37% lived in this county. Out of people who lived in different counties, 50% lived in Pennsylvania.
89% of the 16046 zip code residents lived in the same house 1 year ago. Out of people who lived in different houses, 57% moved from this county. Out of people who lived in different houses, 22% moved from different county within same state. Out of people who lived in different houses, 13% moved from different state. Out of people who lived in different houses, 6% moved from abroad.
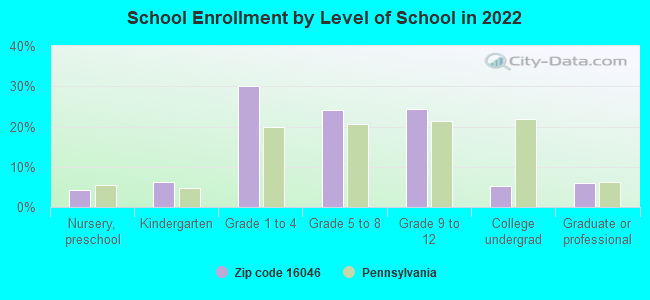
Private vs. public school enrollment:
Students in private schools in grades 1 to 8 (elementary and middle school): 246
Here:
9.2%
Pennsylvania:
15.7%
Students in private schools in grades 9 to 12 (high school): 196
Here:
16.2%
Pennsylvania:
13.4%
Students in private undergraduate colleges: 154
Here:
60.1%
Pennsylvania:
39.8%
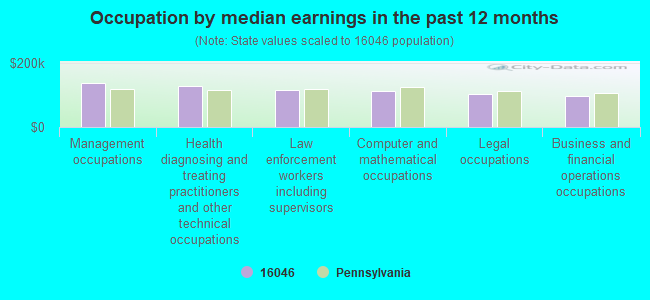
Occupation by median earnings in the past 12 months ($)
138,428Management occupations
130,336Health diagnosing and treating practitioners and other technical occupations
115,623Law enforcement workers including supervisors
112,713Computer and mathematical occupations
103,014Legal occupations
97,627Business and financial operations occupations
Companies with federal contracts located in this zip code (MARS, PA):
AMERICAN METALS CO (311 CLARK ST) : $194,280 in 14 contractsfrom 2004 to 2005
Contracts for Bushings, Rings, Shims, and Spacers, Motors, Electrical, Bearings, Plain, Unmounted by Defense Logistics Agency Signed by year:2000: $0; 2001: $0; 2002: $0; 2003: $0; 2004: $98,111; 2005: $96,169; 2006: $0.
Biggest contracts:
$54,714 with Defense Logistics Agency for Bushings, Rings, Shims, and Spacers. Signed on 2005-02-11. Completion date: 2005-06-11.
$29,198 with Defense Logistics Agency for Motors, Electrical. Signed on 2004-02-17. Completion date: 2004-08-05.
$21,434 with Defense Logistics Agency for Bushings, Rings, Shims, and Spacers. Signed on 2004-10-25. Completion date: 2005-04-27.
$20,860, same as above.Signed on 2004-11-10. Completion date: 2005-04-08.
AIRGROUP AMERICA, INC (612 SHADY OAK COURT; small business) 50 employees, $0 revenue. : $96,500 in 3 contractsfrom 2002 to 2004
$62,000 with Defense Logistics Agency for Bearings, Antifriction, Unmounted. Signed on 2004-07-26. Completion date: 2005-03-07.
$59,750 with Air Force for Bearings, Antifriction, Unmounted. Signed on 2002-10-07. Completion date: 2002-10-18.
-$25,250, same as above.Signed on 2002-10-07. Completion date: 2002-10-18.
JAMES AUSTIN COMPANY (115 DOWNIEVILLE RD; small business) 200 employees, $42000000 revenue.
$28,000 with Federal Supply Service for Chemicals. Taking place in FL. Signed on 1999-11-15. Completion date: 1999-12-15.
ALLIANCE FIRE SYSTEMS INC (109 GRAND AVE; small business) 15 employees, $2700000 revenue.
$9,000 with Public Buildings Service for Maintenance, Repair or Alteration of Real Property -- Office Buildings. Signed on 2000-06-15. Completion date: 2001-06-15.
INDUSTRIAL BRAKE COMPANY, INC (300 CLAY AVENUE; small business)
$2,992 with Army for Motors, Electrical. Taking place in KY. Signed on 2005-09-15. Completion date: 2005-09-12.
Top industries in this zip code by the number of employees in 2005:
Detailed PMIC statistics for the following Tracts:4110.00
, 9124.00
2003 - 2018 National Fire Incident Reporting System (NFIRS) incidents
Based on the data from the years 2003 - 2018 the average number of fire incidents per year is 14. The highest number of fires - 50 took place in 2016, and the least - 0 in 2007. The data has a rising trend.
When looking into fire subcategories, the most incidents belonged to: Structure Fires (56.3%), and Outside Fires (31.4%).
Fire incident types reported to NFIRS in Zip Code 16046
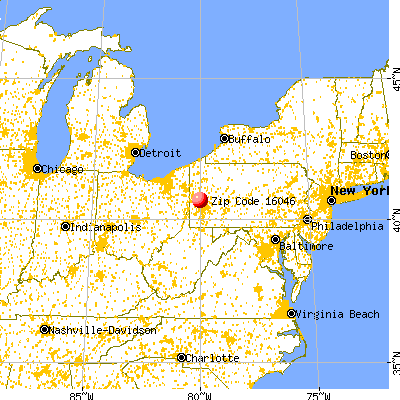


 Nearest zip codes: 16024, 16066, 16033, 15015, 15086, 15090.
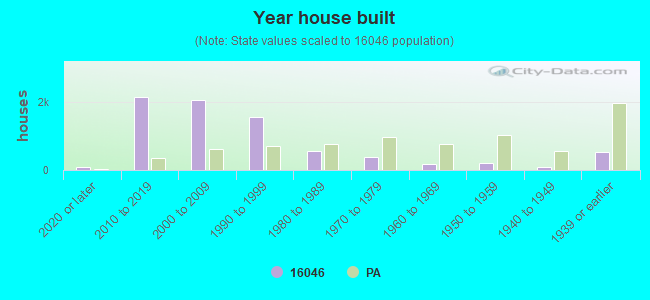


 Based on the data from the years 2003 - 2018 the average number of fire incidents per year is 14. The highest number of fires - 50 took place in 2016, and the least - 0 in 2007. The data has a rising trend.
 When looking into fire subcategories, the most incidents belonged to: Structure Fires (56.3%), and Outside Fires (31.4%).