Estimated zip code population in 2022: 17,586 Zip code population in 2010: 18,186 Zip code population in 2000: 19,128
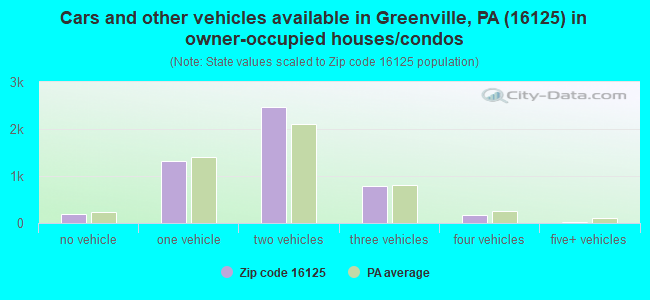
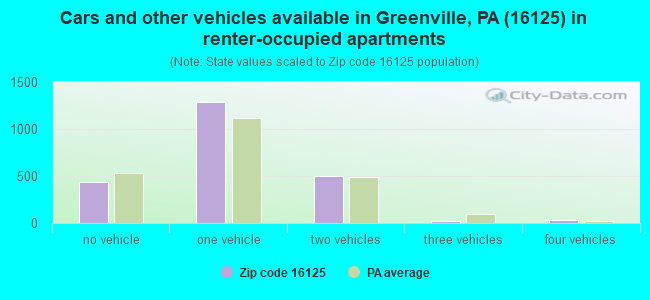
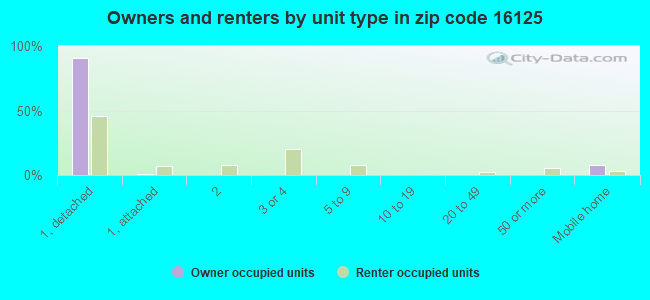
Houses and condos: 8,053 Renter-occupied apartments: 2,271
% of renters here:
31%
State:
31%
March 2022 cost of living index in zip code 16125: 93.3 (less than average, U.S. average is 100)
Land area: 109.4 sq. mi. Water area: 0.1 sq. mi.
Population density: 161 people per square mile
(very low).
OSM Map
General Map
Google Map
MSN Map
OSM Map
General Map
Google Map
MSN Map
OSM Map
General Map
Google Map
MSN Map
OSM Map
General Map
Google Map
MSN Map
Please wait while loading the map...
Real estate property taxes paid for housing units in 2022:
This zip code:
1.3% ($1,790)
Pennsylvania:
1.3% ($3,094)
Median real estate property taxes paid for housing units with mortgages in 2022: $2,044 (1.3%) Median real estate property taxes paid for housing units with no mortgage in 2022: $1,561 (1.3%)
Averages for the 2020 tax year for zip code 16125, filed in 2021:
Average Adjusted Gross Income (AGI) in 2020: $49,584 (Individual Income Tax Returns)
Here:
$49,584
State:
$75,707
Salary/wage: $42,660 (reported on 73.6% of returns)
Here:
$42,660
State:
$62,806
(% of AGI for various income ranges: 985.9% for AGIs below $25k, 3176.5% for AGIs $25k-50k, 5700.8% for AGIs $50k-75k, 8427.2% for AGIs $75k-100k, 14288.7% for AGIs $100k-200k, 50152.5% for AGIs over 200k)
Taxable interest for individuals: $1,015 (reported on 30.4% of returns)
This zip code:
$1,015
Pennsylvania:
$1,633
(% of AGI for various income ranges: 25.7% for AGIs below $25k, 27.6% for AGIs $25k-50k, 35.4% for AGIs $50k-75k, 49.4% for AGIs $75k-100k, 141.1% for AGIs $100k-200k, 720.0% for AGIs over 200k)
Ordinary dividends: $4,521 (reported on 19.1% of returns)
Here:
$4,521
State:
$7,382
(% of AGI for various income ranges: 36.4% for AGIs below $25k, 45.3% for AGIs $25k-50k, 74.1% for AGIs $50k-75k, 187.8% for AGIs $75k-100k, 316.5% for AGIs $100k-200k, 5880.0% for AGIs over 200k)
Net capital gain/loss in AGI: +$9,059 (reported on 15.3% of returns)
Here:
+$9,059
State:
+$23,522
(% of AGI for various income ranges: 14.1% for AGIs below $25k, 33.4% for AGIs $25k-50k, 84.1% for AGIs $50k-75k, 176.6% for AGIs $75k-100k, 718.3% for AGIs $100k-200k, 13102.5% for AGIs over 200k)
Profit/loss from business: +$13,743 (reported on 10.9% of returns)
Here:
+$13,743
State:
+$16,274
(% of AGI for various income ranges: 72.1% for AGIs below $25k, 140.4% for AGIs $25k-50k, 211.0% for AGIs $50k-75k, 282.0% for AGIs $75k-100k, 546.5% for AGIs $100k-200k, 5970.0% for AGIs over 200k)
Taxable individual retirement arrangement distribution: $14,756 (reported on 15.1% of returns)
16125:
$14,756
Pennsylvania:
$18,583
(% of AGI for various income ranges: 119.6% for AGIs below $25k, 150.7% for AGIs $25k-50k, 329.6% for AGIs $50k-75k, 460.4% for AGIs $75k-100k, 988.0% for AGIs $100k-200k, 7832.5% for AGIs over 200k)
Total itemized deductions: $36,389 (reported on 2.3% of returns)
Here:
$36,389
State:
$34,850
(% of AGI for various income ranges: 48.5% for AGIs below $25k, 64.6% for AGIs $25k-50k, 63.7% for AGIs $50k-75k, 171.0% for AGIs $75k-100k, 457.2% for AGIs $100k-200k, 2600.0% for AGIs over 200k)
Charity contributions: $12,362 (reported on 1.6% of returns)
Here:
$12,362
State:
$12,392
(% of AGI for various income ranges: 5.1% for AGIs below $25k, 26.9% for AGIs $50k-75k, 207.4% for AGIs $100k-200k, 830.0% for AGIs over 200k)
Taxes paid: $5,459 (reported on 2.2% of returns)
16125:
$5,459
State:
$8,200
(% of AGI for various income ranges: 0.9% for AGIs below $25k, 4.3% for AGIs $25k-50k, 9.8% for AGIs $50k-75k, 34.2% for AGIs $75k-100k, 80.9% for AGIs $100k-200k, 537.5% for AGIs over 200k)
Earned income credit: $2,101 (reported on 14.6% of returns)
Here:
$2,101
State:
$2,100
(% of AGI for various income ranges: 71.0% for AGIs below $25k, 61.5% for AGIs $25k-50k, 1.7% for AGIs $50k-75k)
Percentage of individuals using paid preparers for their 2020 taxes: 91.0%
Here:
91%
State:
92%
(% for various income ranges: 89.4% for AGIs below $25k, 92.5% for AGIs $25k-50k, 89.6% for AGIs $50k-75k, 91.5% for AGIs $75k-100k, 93.4% for AGIs $100k-200k, 100.0% for AGIs over 200k)
Averages for the 2012 tax year for zip code 16125, filed in 2013:
Average Adjusted Gross Income (AGI) in 2012: $46,632 (Individual Income Tax Returns)
Here:
$46,632
State:
$61,346
Salary/wage: $37,400 (reported on 76.9% of returns)
Here:
$37,400
State:
$51,902
(% of AGI for various income ranges: 65.8% for AGIs below $25k, 70.0% for AGIs $25k-50k, 71.1% for AGIs $50k-75k, 70.1% for AGIs $75k-100k, 59.0% for AGIs $100k-200k, 32.9% for AGIs over 200k)
Taxable interest for individuals: $1,204 (reported on 37.8% of returns)
This zip code:
$1,204
Pennsylvania:
$1,588
(% of AGI for various income ranges: 1.7% for AGIs below $25k, 1.1% for AGIs $25k-50k, 0.7% for AGIs $50k-75k, 0.7% for AGIs $75k-100k, 0.6% for AGIs $100k-200k, 1.4% for AGIs over 200k)
Ordinary dividends: $4,016 (reported on 21.4% of returns)
Here:
$4,016
State:
$5,827
(% of AGI for various income ranges: 1.8% for AGIs below $25k, 1.1% for AGIs $25k-50k, 1.0% for AGIs $50k-75k, 1.1% for AGIs $75k-100k, 1.9% for AGIs $100k-200k, 4.4% for AGIs over 200k)
Net capital gain/loss in AGI: +$10,269 (reported on 13.8% of returns)
Here:
+$10,269
State:
+$14,495
(% of AGI for various income ranges: 0.3% for AGIs $25k-50k, 0.5% for AGIs $50k-75k, 0.7% for AGIs $75k-100k, 2.1% for AGIs $100k-200k, 15.1% for AGIs over 200k)
Profit/loss from business: +$11,727 (reported on 13.1% of returns)
Here:
+$11,727
State:
+$16,268
(% of AGI for various income ranges: 4.8% for AGIs below $25k, 3.7% for AGIs $25k-50k, 2.4% for AGIs $50k-75k, 1.6% for AGIs $75k-100k, 3.9% for AGIs $100k-200k, 3.7% for AGIs over 200k)
Taxable individual retirement arrangement distribution: $10,642 (reported on 15.0% of returns)
16125:
$10,642
Pennsylvania:
$14,550
(% of AGI for various income ranges: 5.0% for AGIs below $25k, 3.0% for AGIs $25k-50k, 3.4% for AGIs $50k-75k, 3.1% for AGIs $75k-100k, 4.1% for AGIs $100k-200k, 2.3% for AGIs over 200k)
Self-employment retirement plans: $9,567 (reported on 0.4% of returns)
16125:
$9,567
Pennsylvania:
$20,922
Total itemized deductions: $20,150 (19% of AGI, reported on 16.3% of returns)
Here:
$20,150
State:
$23,538
Here:
18.9% of AGI
State:
18.4% of AGI
(% of AGI for various income ranges: 6.0% for AGIs below $25k, 5.4% for AGIs $25k-50k, 6.2% for AGIs $50k-75k, 6.3% for AGIs $75k-100k, 9.2% for AGIs $100k-200k, 8.9% for AGIs over 200k)
Charity contributions: $5,200 (reported on 12.0% of returns)
Here:
$5,200
State:
$4,025
(% of AGI for various income ranges: 0.5% for AGIs below $25k, 0.6% for AGIs $25k-50k, 1.1% for AGIs $50k-75k, 1.1% for AGIs $75k-100k, 2.0% for AGIs $100k-200k, 2.4% for AGIs over 200k)
Taxes paid: $6,232 (reported on 16.2% of returns)
16125:
$6,232
State:
$9,982
(% of AGI for various income ranges: 0.7% for AGIs below $25k, 1.2% for AGIs $25k-50k, 1.6% for AGIs $50k-75k, 1.8% for AGIs $75k-100k, 3.5% for AGIs $100k-200k, 3.6% for AGIs over 200k)
Earned income credit: $2,082 (reported on 16.3% of returns)
Here:
$2,082
State:
$2,106
(% of AGI for various income ranges: 5.0% for AGIs below $25k, 0.9% for AGIs $25k-50k)
Percentage of individuals using paid preparers for their 2012 taxes: 55.5%
Here:
55%
State:
53%
(% for various income ranges: 49.6% for AGIs below $25k, 56.5% for AGIs $25k-50k, 59.1% for AGIs $50k-75k, 62.1% for AGIs $75k-100k, 66.7% for AGIs $100k-200k, 85.7% for AGIs over 200k)
Averages for the 2004 tax year for zip code 16125, filed in 2005:
Average Adjusted Gross Income (AGI) in 2004: $35,819 (Individual Income Tax Returns)
Here:
$35,819
State:
$48,049
Salary/wage: $32,237 (reported on 80.3% of returns)
Here:
$32,237
State:
$42,646
(% of AGI for various income ranges: 83.7% for AGIs below $10k, 66.8% for AGIs $10k-25k, 77.9% for AGIs $25k-50k, 80.4% for AGIs $50k-75k, 78.6% for AGIs $75k-100k, 53.7% for AGIs over 100k)
Taxable interest for individuals: $1,491 (reported on 50.1% of returns)
This zip code:
$1,491
Pennsylvania:
$1,657
(% of AGI for various income ranges: 8.6% for AGIs below $10k, 3.7% for AGIs $10k-25k, 1.6% for AGIs $25k-50k, 1.4% for AGIs $50k-75k, 1.3% for AGIs $75k-100k, 2.1% for AGIs over 100k)
Taxable dividends: $3,870 (reported on 25.5% of returns)
Here:
$3,870
State:
$3,566
(% of AGI for various income ranges: 4.1% for AGIs below $10k, 2.0% for AGIs $10k-25k, 1.4% for AGIs $25k-50k, 1.3% for AGIs $50k-75k, 1.4% for AGIs $75k-100k, 7.4% for AGIs over 100k)
Net capital gain/loss: +$3,469 (reported on 17.7% of returns)
Here:
+$3,469
State:
+$9,716
(% of AGI for various income ranges: -0.5% for AGIs below $10k, 0.5% for AGIs $10k-25k, 0.6% for AGIs $25k-50k, 0.9% for AGIs $50k-75k, 1.5% for AGIs $75k-100k, 5.2% for AGIs over 100k)
Profit/loss from business: +$10,880 (reported on 12.9% of returns)
Here:
+$10,880
State:
+$14,267
(% of AGI for various income ranges: 5.4% for AGIs below $10k, 3.9% for AGIs $10k-25k, 2.1% for AGIs $25k-50k, 2.0% for AGIs $50k-75k, 3.6% for AGIs $75k-100k, 8.5% for AGIs over 100k)
IRA payment deduction: $2,682 (reported on 2.8% of returns)
16125:
$2,682
Pennsylvania:
$2,903
(% of AGI for various income ranges: 0.5% for AGIs below $10k, 0.3% for AGIs $10k-25k, 0.3% for AGIs $25k-50k, 0.2% for AGIs $50k-75k, 0.1% for AGIs $75k-100k, 0.1% for AGIs over 100k)
Self-employed pension: $13,447 (reported on 0.6% of returns)
Here:
$13,447
Pennsylvania:
$14,674
Total itemized deductions: $16,093 (21% of AGI, reported on 18.5% of returns)
Here:
$16,093
State:
$18,804
Here:
21.2% of AGI
State:
19.5% of AGI
(% of AGI for various income ranges: 10.6% for AGIs below $10k, 6.1% for AGIs $10k-25k, 6.2% for AGIs $25k-50k, 8.0% for AGIs $50k-75k, 10.5% for AGIs $75k-100k, 11.1% for AGIs over 100k)
Charity contributions deductions: $3,940 (5% of AGI, reported on 15.3% of returns)
Here:
$3,940
State:
$3,337
Here:
4.8% of AGI
State:
3.3% of AGI
(% of AGI for various income ranges: 0.8% for AGIs below $10k, 0.7% for AGIs $10k-25k, 1.0% for AGIs $25k-50k, 1.3% for AGIs $50k-75k, 1.8% for AGIs $75k-100k, 3.6% for AGIs over 100k)
Total tax: $4,991 (reported on 70.0% of returns)
16125:
$4,991
State:
$8,008
(% of AGI for various income ranges: 2.1% for AGIs below $10k, 3.7% for AGIs $10k-25k, 6.3% for AGIs $25k-50k, 8.5% for AGIs $50k-75k, 10.7% for AGIs $75k-100k, 19.7% for AGIs over 100k)
Earned income credit: $1,607 (reported on 15.3% of returns)
Here:
$1,607
State:
$1,643
Percentage of individuals using paid preparers for their 2004 taxes: 58.4%
Here:
58%
State:
56%
(% for various income ranges: 53.5% for AGIs below $10k, 59.4% for AGIs $10k-25k, 60.7% for AGIs $25k-50k, 56.1% for AGIs $50k-75k, 59.7% for AGIs $75k-100k, 70.7% for AGIs over 100k)
Household received Food Stamps/SNAP in the past 12 months: 1,555 Household did not receive Food Stamps/SNAP in the past 12 months: 5,695
Women who had a birth in the past 12 months: 206 (162 now married, 47 unmarried) Women who did not have a birth in the past 12 months: 3,270 (1,370 now married, 1,898 unmarried)
Housing units in zip code 16125 with a mortgage: 2,434 (291 second mortgage, 7 home equity loan, 240 both second mortgage and home equity loan) Houses without a mortgage: 333
Median monthly owner costs for units with a mortgage: $1,042 Median monthly owner costs for units without a mortgage: $429
Residents with income below the poverty level in 2022:
This zip code:
11.7%
Whole state:
11.8%
Residents with income below 50% of the poverty level in 2022:
This zip code:
7.0%
Whole state:
6.1%
Median number of rooms in houses and condos:
Here:
6.4
State:
6.8
Median number of rooms in apartments:
Here:
4.8
State:
4.3
Notable locations in this zip code not listed on our city pages
Notable locations in zip code 16125: Pinehill Golf Course (A), Reynolds Plaza (B), Amasa Station (C), Kitches Corners (D), Camp Rowland (E), Furance Corners (F), Stulls Corners (G), Greenville Volunteer Fire Department (H), Hempfield Township Volunteer Fire Department Station 1 Headquarters (I), West Salem Volunteer Fire Department Station 2 (J), West Salem Volunteer Fire Department Station 1 (K), Saint Pauls Childrens Home (L), Transfer Volunteer Fire Department Station 2 (M), Hempfield Township Volunteer Fire Department Station 2 (N). Display/hide their locations on the map
Streams, rivers, and creeks: Saul Run (A), Minis Hollow Run (B), Little Shenango River (C), Big Run (D), Crooked Creek (E), Mathay Run (F), Bluff Run (G). Display/hide their locations on the map
1,879 married couples with children.
946 single-parent households (361 men, 585 women).
95.7% of residents of 16125 zip code speak English at home.
0.5% of residents speak Spanish at home (59% very well, 41% well).
2.9% of residents speak other Indo-European language at home (73% very well, 19% well, 8% not well).
0.5% of residents speak Asian or Pacific Island language at home (94% very well, 6% well).
0.1% of residents speak other language at home (100% very well).
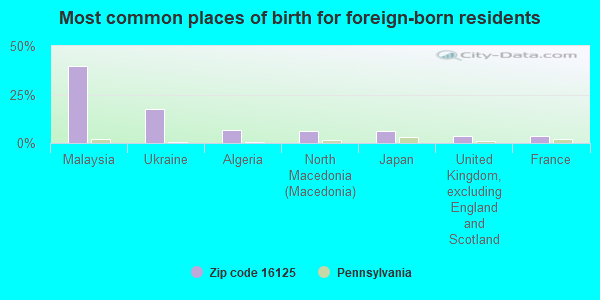
Foreign born population: 230 (1.3%) (95.1% of them are naturalized citizens)
This zip code:
1.3%
Whole state:
7.5%
40%Malaysia
18%Ukraine
7%Algeria
6%North Macedonia (Macedonia)
6%Japan
4%United Kingdom, excluding England and Scotland
4%France
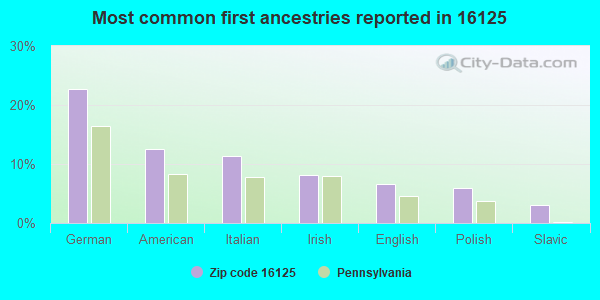
23%German
12%American
11%Italian
8%Irish
7%English
6%Polish
3%Slavic
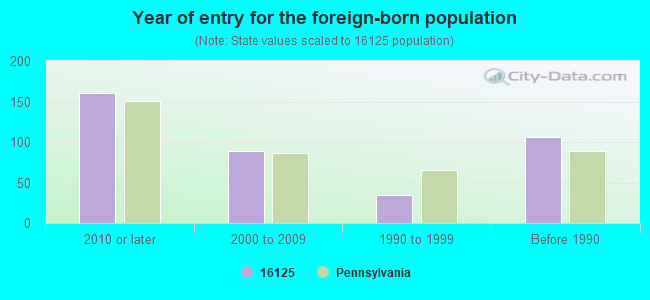
Year of entry for the foreign-born population
1612010 or later
892000 to 2009
351990 to 1999
106Before 1990
Facilities with environmental interests located in this zip code:
BESSEMER & LAKE ERIE RR OHL STREET (85 OHL STREET in GREENVILLE, PA)
STATE MASTER (Pennsylvania database) - PCS-PA0005622, National Pollutant Discharge Elimination System Permit, RCRIS-PAD093323442, HAZARDOUS WASTE PROGRAM, AFS-25-1589046-1, AIR PROGRAM National Pollutant Discharge Elimination System NON-MAJOR (Tracking pollutant discharge elimination systems) - permit HAZARDOUS WASTE BIENNIAL REPORTER (Resource Conservation and Recovery Act (tracking hazardous waste)) Small Quantity Generators, between 100 kg and 1000 kg of hazardous waste/month (Resource Conservation and Recovery Act (tracking hazardous waste)) - notification Business SIC classification: RAILROADS, LINE-HAUL OPERATING; TRANSPORTATION SERVICES Business NAICS classification: LINE-HAUL RAILROADS. Alternative names: BESSEMER & LAKE ERIE RAILROAD, BESSEMER & LAKE ERIE RR CO TRANSTAR, BESSEMER & LAKE ERIE RR SOUTH RACE ST, BESSEMER & LAKE ERIE RR SOUTH RACE STREET
ANDERSON COACH & TRAVEL (1 ANDERSON PLAZA in GREENVILLE, PA)
STATE MASTER (Pennsylvania database) - PCS-PAR808307, National Pollutant Discharge Elimination System Permit Small Quantity Generators, between 100 kg and 1000 kg of hazardous waste/month (Resource Conservation and Recovery Act (tracking hazardous waste)) - notification Organizations: ANDERSON OB INC (CONTACT/OWNER)
Alternative names: ANDERSON TOURS
A C COACH OPERATIONS INC (ANDERSON COACH AND TRAVEL in GREENVILLE, PA)
National Pollutant Discharge Elimination System NON-MAJOR (Tracking pollutant discharge elimination systems) - permit Business SIC classification: BUS CHARTER SERVICE, EXCEPT LOCAL Alternative names: ANDERSON REALTY
ALICE WILLIAMS (1443 RUTLEDGE RD in GREENVILLE, PA)
National Pollutant Discharge Elimination System NON-MAJOR (Tracking pollutant discharge elimination systems) - permit Business SIC classification: OPERATORS OF DWELLINGS OTHER THAN APARTMENT BUILDINGS Alternative names: WILLIAMS, ALICE
AMNDERSON MHP (326 VERNON RD in GREENVILLE, PA)
National Pollutant Discharge Elimination System NON-MAJOR (Tracking pollutant discharge elimination systems) - permit Business SIC classification: OPERATORS OF RESIDENTIAL MOBILE HOME SITES Alternative names: ANDERSON MHP, ANDERSON MOBILE HOME PARK
ANDREW & TONI KURELKO (522 VERNON RD in GREENVILLE, PA)
National Pollutant Discharge Elimination System NON-MAJOR (Tracking pollutant discharge elimination systems) - permit Business SIC classification: OPERATORS OF DWELLINGS OTHER THAN APARTMENT BUILDINGS Alternative names: KURELKO, ANDREW P & TONI A
AGWAY INCORPORATED REGIONAL FEEDMILL (345 SHARON ROAD in GREENVILLE, PA)
TRI REPORTER (Tracking of toxic chemicals releasing facilities) Business SIC classification: PREPARED FEEDS AND FEED INGREDIENTS FOR ANIMALS AND FOWLS, EXCEPT DOGS AND CATS
Housing units lacking complete plumbing facilities: 2.2% Housing units lacking complete kitchen facilities: 3.3%
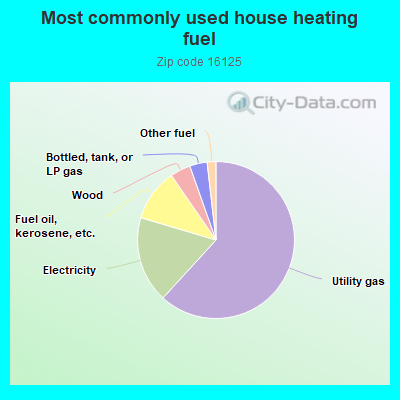
61.8%Utility gas
17.8%Electricity
10.8%Fuel oil, kerosene, etc.
4.2%Wood
3.6%Bottled, tank, or LP gas
1.8%Other fuel
Population in 1990: 19,982.
Place of birth for U.S.-born residents:
This state: 13,800
Northeast: 543
Midwest: 1,314
South: 1,105
West: 386
66% of the 16125 zip code residents lived in the same house 5 years ago. Out of people who lived in different houses, 68% lived in this county. Out of people who lived in different counties, 50% lived in Pennsylvania.
92% of the 16125 zip code residents lived in the same house 1 year ago. Out of people who lived in different houses, 72% moved from this county. Out of people who lived in different houses, 10% moved from different county within same state. Out of people who lived in different houses, 18% moved from different state.
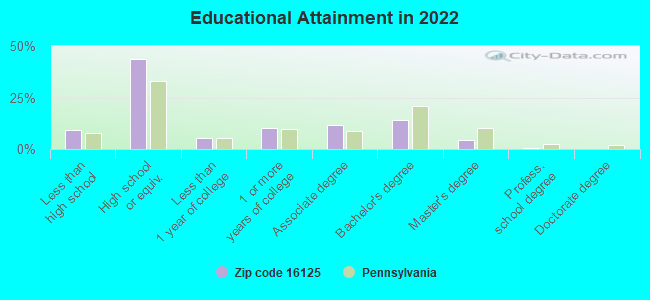
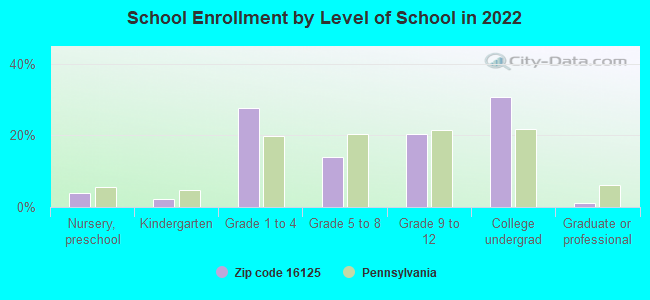
Private vs. public school enrollment:
Students in private schools in grades 1 to 8 (elementary and middle school): 113
Here:
7.6%
Pennsylvania:
15.7%
Students in private schools in grades 9 to 12 (high school): 71
Here:
9.7%
Pennsylvania:
13.4%
Students in private undergraduate colleges: 844
Here:
76.7%
Pennsylvania:
39.8%
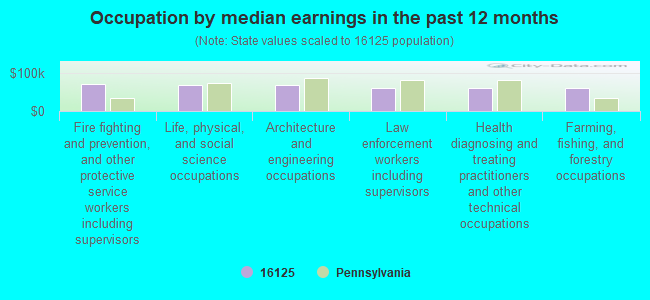
Occupation by median earnings in the past 12 months ($)
69,812Fire fighting and prevention, and other protective service workers including supervisors
68,914Life, physical, and social science occupations
68,675Architecture and engineering occupations
61,212Law enforcement workers including supervisors
59,815Health diagnosing and treating practitioners and other technical occupations
59,311Farming, fishing, and forestry occupations
Companies with federal contracts located in this zip code (GREENVILLE, PA):
M&R GROUNDS INC (3 WERNER ROAD; small business) : $226,283 in 41 contractsfrom 2002 to 2004
Contracts for Landscaping/Groundskeeping Services, Facilities Operations Support Services by U.S. Army Corps of Engineers - civil program financing only, Army Signed by year:2000: $0; 2001: $0; 2002: $121,775; 2003: $106,578; 2004: -$2,070; 2005: $0; 2006: $0.
Biggest contracts:
$63,215 with U.S. Army Corps of Engineers - civil program financing only for Landscaping/Groundskeeping Services. Signed on 2002-07-16. Completion date: 2002-10-15.
$49,652, same as above.Signed on 2002-04-30. Completion date: 2002-04-24.
$30,790 with Army for Landscaping/Groundskeeping Services. Signed on 2003-04-02. Completion date: 2003-11-30.
$23,915, same as above.Signed on 2003-05-29. Completion date: 2003-11-30.
NORTHEAST INDUSTRIAL MANUFACTU (640 KEYSTONE RD; small business)
$9,430 with Army for Waste Treatment and Storage. Taking place in VA. Signed on 2005-01-13. Completion date: 2005-01-31.
ANDERSON, O D INC (1 ANDERSON PLAZA; small business) : $5,993 in 2 contractsfrom 2003 to 2004
$3,518 with Army for Passenger Motor Charter Service. Taking place in OH. Signed on 2003-04-24. Completion date: 2003-04-18.
$2,475 with Army for Passenger Motor Charter Service. Signed on 2004-04-21. Completion date: 2004-04-30.
MASON, CLIFF (121 WOODSHIRE RD; small business)
$5,692 with Army for Technical Assistance. Signed on 2002-05-22. Completion date: 2003-05-31.
MAILLIARD, CHRISTY (346 LEECH RD; small business) : $0 in 2 contractsin 2002
$4,637 with Army for Athletic and Sporting Equipment. Signed on 2002-07-24. Completion date: 2002-08-23.
-$4,637, same as above.Signed on 2002-09-23. Completion date: 2002-08-23.
Top industries in this zip code by the number of employees in 2005:
Educational Services: Colleges, Universities, and Professional Schools (500-999 employees: 1 establishment)
Health Care and Social Assistance: General Medical and Surgical Hospitals (500-999: 1)
Management of Companies and Enterprises: Corporate, Subsidiary, and Regional Managing Offices (250-499: 1, 20-49: 1)
Health Care and Social Assistance: Continuing Care Retirement Communities (250-499: 1)
Health Care and Social Assistance: Offices of Physicians (except Mental Health Specialists) (100-249: 1, 20-49: 1, 10-19: 3, 5-9: 6, 1-4: 14)
2003 - 2018 National Fire Incident Reporting System (NFIRS) incidents
According to the data from the years 2003 - 2018 the average number of fires per year is 68. The highest number of fires - 146 took place in 2017, and the least - 37 in 2008. The data has a rising trend.
When looking into fire subcategories, the most incidents belonged to: Structure Fires (72.6%), and Outside Fires (18.2%).
Fire incident types reported to NFIRS in Zip Code 16125


 Nearest zip codes: 16154, 16110, 16124, 16113, 16131, 16111.


 According to the data from the years 2003 - 2018 the average number of fires per year is 68. The highest number of fires - 146 took place in 2017, and the least - 37 in 2008. The data has a rising trend.
 When looking into fire subcategories, the most incidents belonged to: Structure Fires (72.6%), and Outside Fires (18.2%).