Estimated zip code population in 2022: 16,687
Zip code population in 2010: 16,959
Zip code population in 2000: 13,490
Houses and condos: 8,418
Renter-occupied apartments: 2,154
% of renters here:
27%State:
31%
March 2022 cost of living index in zip code 16148: 93.8
(less than average, U.S. average is 100)
Land area: 32.1
sq. mi.
Water area: 0.1
sq. mi.
Population density: 520 people per square mile (low).
OSM Map
General Map
Google Map
MSN Map
OSM Map
General Map
Google Map
MSN Map
OSM Map
General Map
Google Map
MSN Map
OSM Map
General Map
Google Map
MSN Map
Please wait while loading the map...
Real estate property taxes paid for housing units in 2022:
This zip code:
1.2% ($2,172)Pennsylvania:
1.3% ($3,094)
Median real estate property taxes paid for housing units with mortgages in 2022: $2,254 (1.1%)
Median real estate property taxes paid for housing units with no mortgage in 2022: $2,126 (1.2%)
Profiles of local businesses
Business Search - 14 Million verified businesses
Males: 8,077 Females: 8,610
For population 25 years and over in 16148:
High school or higher: 93.1%Bachelor's degree or higher: 36.3%Graduate or professional degree: 16.2%Unemployed: 3.7%Mean travel time to work (commute): 18.9 minutes
For population 15 years and over in 16148:
Never married: 25.1%Now married: 54.8%Separated: 0.8%Widowed: 10.8%Divorced: 8.6%
Zip code 16148 compared to state average:
Black race population percentage below state average. Hispanic race population percentage significantly below state average. Median age significantly above state average. Foreign-born population percentage significantly below state average. Length of stay since moving in above state average. 14,562 87.3% White 804 4.8% Black 535 3.2% Two or more races 347 2.1% Asian 328 2.0% Hispanic or Latino 81 0.5% Some other race 26 0.2% American Indian
Data:
Median household income ($)
Median household income (% change since 2000)
Household income diversity
Ratio of average income to average house value (%)
Ratio of average income to average rent
Median household income ($) - White
Median household income ($) - Black or African American
Median household income ($) - Asian
Median household income ($) - Hispanic or Latino
Median household income ($) - American Indian and Alaska Native
Median household income ($) - Multirace
Median household income ($) - Other Race
Median household income for houses/condos with a mortgage ($)
Median household income for apartments without a mortgage ($)
Races - White alone (%)
Races - White alone (% change since 2000)
Races - Black alone (%)
Races - Black alone (% change since 2000)
Races - American Indian alone (%)
Races - American Indian alone (% change since 2000)
Races - Asian alone (%)
Races - Asian alone (% change since 2000)
Races - Hispanic (%)
Races - Hispanic (% change since 2000)
Races - Native Hawaiian and Other Pacific Islander alone (%)
Races - Native Hawaiian and Other Pacific Islander alone (% change since 2000)
Races - Two or more races (%)
Races - Two or more races (% change since 2000)
Races - Other race alone (%)
Races - Other race alone (% change since 2000)
Racial diversity
Unemployment (%)
Unemployment (% change since 2000)
Unemployment (%) - White
Unemployment (%) - Black or African American
Unemployment (%) - Asian
Unemployment (%) - Hispanic or Latino
Unemployment (%) - American Indian and Alaska Native
Unemployment (%) - Multirace
Unemployment (%) - Other Race
Population density (people per square mile)
Population - Males (%)
Population - Females (%)
Population - Males (%) - White
Population - Males (%) - Black or African American
Population - Males (%) - Asian
Population - Males (%) - Hispanic or Latino
Population - Males (%) - American Indian and Alaska Native
Population - Males (%) - Multirace
Population - Males (%) - Other Race
Population - Females (%) - White
Population - Females (%) - Black or African American
Population - Females (%) - Asian
Population - Females (%) - Hispanic or Latino
Population - Females (%) - American Indian and Alaska Native
Population - Females (%) - Multirace
Population - Females (%) - Other Race
Coronavirus confirmed cases (Apr 27, 2024)
Deaths caused by coronavirus (Apr 27, 2024)
Coronavirus confirmed cases (per 100k population) (Apr 27, 2024)
Deaths caused by coronavirus (per 100k population) (Apr 27, 2024)
Daily increase in number of cases (Apr 27, 2024)
Weekly increase in number of cases (Apr 27, 2024)
Cases doubled (in days) (Apr 27, 2024)
Hospitalized patients (Apr 18, 2022)
Negative test results (Apr 18, 2022)
Total test results (Apr 18, 2022)
COVID Vaccine doses distributed (per 100k population) (Sep 19, 2023)
COVID Vaccine doses administered (per 100k population) (Sep 19, 2023)
COVID Vaccine doses distributed (Sep 19, 2023)
COVID Vaccine doses administered (Sep 19, 2023)
Likely homosexual households (%)
Likely homosexual households (% change since 2000)
Likely homosexual households - Lesbian couples (%)
Likely homosexual households - Lesbian couples (% change since 2000)
Likely homosexual households - Gay men (%)
Likely homosexual households - Gay men (% change since 2000)
Cost of living index
Median gross rent ($)
Median contract rent ($)
Median monthly housing costs ($)
Median house or condo value ($)
Median house or condo value ($ change since 2000)
Mean house or condo value by units in structure - 1, detached ($)
Mean house or condo value by units in structure - 1, attached ($)
Mean house or condo value by units in structure - 2 ($)
Mean house or condo value by units in structure by units in structure - 3 or 4 ($)
Mean house or condo value by units in structure - 5 or more ($)
Mean house or condo value by units in structure - Boat, RV, van, etc. ($)
Mean house or condo value by units in structure - Mobile home ($)
Median house or condo value ($) - White
Median house or condo value ($) - Black or African American
Median house or condo value ($) - Asian
Median house or condo value ($) - Hispanic or Latino
Median house or condo value ($) - American Indian and Alaska Native
Median house or condo value ($) - Multirace
Median house or condo value ($) - Other Race
Median resident age
Resident age diversity
Median resident age - Males
Median resident age - Females
Median resident age - White
Median resident age - Black or African American
Median resident age - Asian
Median resident age - Hispanic or Latino
Median resident age - American Indian and Alaska Native
Median resident age - Multirace
Median resident age - Other Race
Median resident age - Males - White
Median resident age - Males - Black or African American
Median resident age - Males - Asian
Median resident age - Males - Hispanic or Latino
Median resident age - Males - American Indian and Alaska Native
Median resident age - Males - Multirace
Median resident age - Males - Other Race
Median resident age - Females - White
Median resident age - Females - Black or African American
Median resident age - Females - Asian
Median resident age - Females - Hispanic or Latino
Median resident age - Females - American Indian and Alaska Native
Median resident age - Females - Multirace
Median resident age - Females - Other Race
Commute - mean travel time to work (minutes)
Travel time to work - Less than 5 minutes (%)
Travel time to work - Less than 5 minutes (% change since 2000)
Travel time to work - 5 to 9 minutes (%)
Travel time to work - 5 to 9 minutes (% change since 2000)
Travel time to work - 10 to 19 minutes (%)
Travel time to work - 10 to 19 minutes (% change since 2000)
Travel time to work - 20 to 29 minutes (%)
Travel time to work - 20 to 29 minutes (% change since 2000)
Travel time to work - 30 to 39 minutes (%)
Travel time to work - 30 to 39 minutes (% change since 2000)
Travel time to work - 40 to 59 minutes (%)
Travel time to work - 40 to 59 minutes (% change since 2000)
Travel time to work - 60 to 89 minutes (%)
Travel time to work - 60 to 89 minutes (% change since 2000)
Travel time to work - 90 or more minutes (%)
Travel time to work - 90 or more minutes (% change since 2000)
Marital status - Never married (%)
Marital status - Now married (%)
Marital status - Separated (%)
Marital status - Widowed (%)
Marital status - Divorced (%)
Median family income ($)
Median family income (% change since 2000)
Median non-family income ($)
Median non-family income (% change since 2000)
Median per capita income ($)
Median per capita income (% change since 2000)
Median family income ($) - White
Median family income ($) - Black or African American
Median family income ($) - Asian
Median family income ($) - Hispanic or Latino
Median family income ($) - American Indian and Alaska Native
Median family income ($) - Multirace
Median family income ($) - Other Race
Median year house/condo built
Median year apartment built
Year house built - Built 2005 or later (%)
Year house built - Built 2000 to 2004 (%)
Year house built - Built 1990 to 1999 (%)
Year house built - Built 1980 to 1989 (%)
Year house built - Built 1970 to 1979 (%)
Year house built - Built 1960 to 1969 (%)
Year house built - Built 1950 to 1959 (%)
Year house built - Built 1940 to 1949 (%)
Year house built - Built 1939 or earlier (%)
Average household size
Household density (households per square mile)
Average household size - White
Average household size - Black or African American
Average household size - Asian
Average household size - Hispanic or Latino
Average household size - American Indian and Alaska Native
Average household size - Multirace
Average household size - Other Race
Occupied housing units (%)
Vacant housing units (%)
Owner occupied housing units (%)
Renter occupied housing units (%)
Vacancy status - For rent (%)
Vacancy status - For sale only (%)
Vacancy status - Rented or sold, not occupied (%)
Vacancy status - For seasonal, recreational, or occasional use (%)
Vacancy status - For migrant workers (%)
Vacancy status - Other vacant (%)
Residents with income below the poverty level (%)
Residents with income below 50% of the poverty level (%)
Children below poverty level (%)
Poor families by family type - Married-couple family (%)
Poor families by family type - Male, no wife present (%)
Poor families by family type - Female, no husband present (%)
Poverty status for native-born residents (%)
Poverty status for foreign-born residents (%)
Poverty among high school graduates not in families (%)
Poverty among people who did not graduate high school not in families (%)
Residents with income below the poverty level (%) - White
Residents with income below the poverty level (%) - Black or African American
Residents with income below the poverty level (%) - Asian
Residents with income below the poverty level (%) - Hispanic or Latino
Residents with income below the poverty level (%) - American Indian and Alaska Native
Residents with income below the poverty level (%) - Multirace
Residents with income below the poverty level (%) - Other Race
Air pollution - Air Quality Index (AQI)
Air pollution - CO
Air pollution - NO2
Air pollution - SO2
Air pollution - Ozone
Air pollution - PM10
Air pollution - PM25
Air pollution - Pb
Crime - Murders per 100,000 population
Crime - Rapes per 100,000 population
Crime - Robberies per 100,000 population
Crime - Assaults per 100,000 population
Crime - Burglaries per 100,000 population
Crime - Thefts per 100,000 population
Crime - Auto thefts per 100,000 population
Crime - Arson per 100,000 population
Crime - City-data.com crime index
Crime - Violent crime index
Crime - Property crime index
Crime - Murders per 100,000 population (5 year average)
Crime - Rapes per 100,000 population (5 year average)
Crime - Robberies per 100,000 population (5 year average)
Crime - Assaults per 100,000 population (5 year average)
Crime - Burglaries per 100,000 population (5 year average)
Crime - Thefts per 100,000 population (5 year average)
Crime - Auto thefts per 100,000 population (5 year average)
Crime - Arson per 100,000 population (5 year average)
Crime - City-data.com crime index (5 year average)
Crime - Violent crime index (5 year average)
Crime - Property crime index (5 year average)
1996 Presidential Elections Results (%) - Democratic Party (Clinton)
1996 Presidential Elections Results (%) - Republican Party (Dole)
1996 Presidential Elections Results (%) - Other
2000 Presidential Elections Results (%) - Democratic Party (Gore)
2000 Presidential Elections Results (%) - Republican Party (Bush)
2000 Presidential Elections Results (%) - Other
2004 Presidential Elections Results (%) - Democratic Party (Kerry)
2004 Presidential Elections Results (%) - Republican Party (Bush)
2004 Presidential Elections Results (%) - Other
2008 Presidential Elections Results (%) - Democratic Party (Obama)
2008 Presidential Elections Results (%) - Republican Party (McCain)
2008 Presidential Elections Results (%) - Other
2012 Presidential Elections Results (%) - Democratic Party (Obama)
2012 Presidential Elections Results (%) - Republican Party (Romney)
2012 Presidential Elections Results (%) - Other
2016 Presidential Elections Results (%) - Democratic Party (Clinton)
2016 Presidential Elections Results (%) - Republican Party (Trump)
2016 Presidential Elections Results (%) - Other
2020 Presidential Elections Results (%) - Democratic Party (Biden)
2020 Presidential Elections Results (%) - Republican Party (Trump)
2020 Presidential Elections Results (%) - Other
Ancestries Reported - Arab (%)
Ancestries Reported - Czech (%)
Ancestries Reported - Danish (%)
Ancestries Reported - Dutch (%)
Ancestries Reported - English (%)
Ancestries Reported - French (%)
Ancestries Reported - French Canadian (%)
Ancestries Reported - German (%)
Ancestries Reported - Greek (%)
Ancestries Reported - Hungarian (%)
Ancestries Reported - Irish (%)
Ancestries Reported - Italian (%)
Ancestries Reported - Lithuanian (%)
Ancestries Reported - Norwegian (%)
Ancestries Reported - Polish (%)
Ancestries Reported - Portuguese (%)
Ancestries Reported - Russian (%)
Ancestries Reported - Scotch-Irish (%)
Ancestries Reported - Scottish (%)
Ancestries Reported - Slovak (%)
Ancestries Reported - Subsaharan African (%)
Ancestries Reported - Swedish (%)
Ancestries Reported - Swiss (%)
Ancestries Reported - Ukrainian (%)
Ancestries Reported - United States (%)
Ancestries Reported - Welsh (%)
Ancestries Reported - West Indian (%)
Ancestries Reported - Other (%)
Educational Attainment - No schooling completed (%)
Educational Attainment - Less than high school (%)
Educational Attainment - High school or equivalent (%)
Educational Attainment - Less than 1 year of college (%)
Educational Attainment - 1 or more years of college (%)
Educational Attainment - Associate degree (%)
Educational Attainment - Bachelor's degree (%)
Educational Attainment - Master's degree (%)
Educational Attainment - Professional school degree (%)
Educational Attainment - Doctorate degree (%)
School Enrollment - Nursery, preschool (%)
School Enrollment - Kindergarten (%)
School Enrollment - Grade 1 to 4 (%)
School Enrollment - Grade 5 to 8 (%)
School Enrollment - Grade 9 to 12 (%)
School Enrollment - College undergrad (%)
School Enrollment - Graduate or professional (%)
School Enrollment - Not enrolled in school (%)
School enrollment - Public schools (%)
School enrollment - Private schools (%)
School enrollment - Not enrolled (%)
Median number of rooms in houses and condos
Median number of rooms in apartments
Housing units lacking complete plumbing facilities (%)
Housing units lacking complete kitchen facilities (%)
Density of houses
Urban houses (%)
Rural houses (%)
Households with people 60 years and over (%)
Households with people 65 years and over (%)
Households with people 75 years and over (%)
Households with one or more nonrelatives (%)
Households with no nonrelatives (%)
Population in households (%)
Family households (%)
Nonfamily households (%)
Population in families (%)
Family households with own children (%)
Median number of bedrooms in owner occupied houses
Mean number of bedrooms in owner occupied houses
Median number of bedrooms in renter occupied houses
Mean number of bedrooms in renter occupied houses
Median number of vehichles in owner occupied houses
Mean number of vehichles in owner occupied houses
Median number of vehichles in renter occupied houses
Mean number of vehichles in renter occupied houses
Mortgage status - with mortgage (%)
Mortgage status - with second mortgage (%)
Mortgage status - with home equity loan (%)
Mortgage status - with both second mortgage and home equity loan (%)
Mortgage status - without a mortgage (%)
Average family size
Average family size - White
Average family size - Black or African American
Average family size - Asian
Average family size - Hispanic or Latino
Average family size - American Indian and Alaska Native
Average family size - Multirace
Average family size - Other Race
Geographical mobility - Same house 1 year ago (%)
Geographical mobility - Moved within same county (%)
Geographical mobility - Moved from different county within same state (%)
Geographical mobility - Moved from different state (%)
Geographical mobility - Moved from abroad (%)
Place of birth - Born in state of residence (%)
Place of birth - Born in other state (%)
Place of birth - Native, outside of US (%)
Place of birth - Foreign born (%)
Housing units in structures - 1, detached (%)
Housing units in structures - 1, attached (%)
Housing units in structures - 2 (%)
Housing units in structures - 3 or 4 (%)
Housing units in structures - 5 to 9 (%)
Housing units in structures - 10 to 19 (%)
Housing units in structures - 20 to 49 (%)
Housing units in structures - 50 or more (%)
Housing units in structures - Mobile home (%)
Housing units in structures - Boat, RV, van, etc. (%)
House/condo owner moved in on average (years ago)
Renter moved in on average (years ago)
Year householder moved into unit - Moved in 1999 to March 2000 (%)
Year householder moved into unit - Moved in 1995 to 1998 (%)
Year householder moved into unit - Moved in 1990 to 1994 (%)
Year householder moved into unit - Moved in 1980 to 1989 (%)
Year householder moved into unit - Moved in 1970 to 1979 (%)
Year householder moved into unit - Moved in 1969 or earlier (%)
Means of transportation to work - Drove car alone (%)
Means of transportation to work - Carpooled (%)
Means of transportation to work - Public transportation (%)
Means of transportation to work - Bus or trolley bus (%)
Means of transportation to work - Streetcar or trolley car (%)
Means of transportation to work - Subway or elevated (%)
Means of transportation to work - Railroad (%)
Means of transportation to work - Ferryboat (%)
Means of transportation to work - Taxicab (%)
Means of transportation to work - Motorcycle (%)
Means of transportation to work - Bicycle (%)
Means of transportation to work - Walked (%)
Means of transportation to work - Other means (%)
Working at home (%)
Industry diversity
Most Common Industries - Agriculture, forestry, fishing and hunting, and mining (%)
Most Common Industries - Agriculture, forestry, fishing and hunting (%)
Most Common Industries - Mining, quarrying, and oil and gas extraction (%)
Most Common Industries - Construction (%)
Most Common Industries - Manufacturing (%)
Most Common Industries - Wholesale trade (%)
Most Common Industries - Retail trade (%)
Most Common Industries - Transportation and warehousing, and utilities (%)
Most Common Industries - Transportation and warehousing (%)
Most Common Industries - Utilities (%)
Most Common Industries - Information (%)
Most Common Industries - Finance and insurance, and real estate and rental and leasing (%)
Most Common Industries - Finance and insurance (%)
Most Common Industries - Real estate and rental and leasing (%)
Most Common Industries - Professional, scientific, and management, and administrative and waste management services (%)
Most Common Industries - Professional, scientific, and technical services (%)
Most Common Industries - Management of companies and enterprises (%)
Most Common Industries - Administrative and support and waste management services (%)
Most Common Industries - Educational services, and health care and social assistance (%)
Most Common Industries - Educational services (%)
Most Common Industries - Health care and social assistance (%)
Most Common Industries - Arts, entertainment, and recreation, and accommodation and food services (%)
Most Common Industries - Arts, entertainment, and recreation (%)
Most Common Industries - Accommodation and food services (%)
Most Common Industries - Other services, except public administration (%)
Most Common Industries - Public administration (%)
Occupation diversity
Most Common Occupations - Management, business, science, and arts occupations (%)
Most Common Occupations - Management, business, and financial occupations (%)
Most Common Occupations - Management occupations (%)
Most Common Occupations - Business and financial operations occupations (%)
Most Common Occupations - Computer, engineering, and science occupations (%)
Most Common Occupations - Computer and mathematical occupations (%)
Most Common Occupations - Architecture and engineering occupations (%)
Most Common Occupations - Life, physical, and social science occupations (%)
Most Common Occupations - Education, legal, community service, arts, and media occupations (%)
Most Common Occupations - Community and social service occupations (%)
Most Common Occupations - Legal occupations (%)
Most Common Occupations - Education, training, and library occupations (%)
Most Common Occupations - Arts, design, entertainment, sports, and media occupations (%)
Most Common Occupations - Healthcare practitioners and technical occupations (%)
Most Common Occupations - Health diagnosing and treating practitioners and other technical occupations (%)
Most Common Occupations - Health technologists and technicians (%)
Most Common Occupations - Service occupations (%)
Most Common Occupations - Healthcare support occupations (%)
Most Common Occupations - Protective service occupations (%)
Most Common Occupations - Fire fighting and prevention, and other protective service workers including supervisors (%)
Most Common Occupations - Law enforcement workers including supervisors (%)
Most Common Occupations - Food preparation and serving related occupations (%)
Most Common Occupations - Building and grounds cleaning and maintenance occupations (%)
Most Common Occupations - Personal care and service occupations (%)
Most Common Occupations - Sales and office occupations (%)
Most Common Occupations - Sales and related occupations (%)
Most Common Occupations - Office and administrative support occupations (%)
Most Common Occupations - Natural resources, construction, and maintenance occupations (%)
Most Common Occupations - Farming, fishing, and forestry occupations (%)
Most Common Occupations - Construction and extraction occupations (%)
Most Common Occupations - Installation, maintenance, and repair occupations (%)
Most Common Occupations - Production, transportation, and material moving occupations (%)
Most Common Occupations - Production occupations (%)
Most Common Occupations - Transportation occupations (%)
Most Common Occupations - Material moving occupations (%)
People in Group quarters - Institutionalized population (%)
People in Group quarters - Correctional institutions (%)
People in Group quarters - Federal prisons and detention centers (%)
People in Group quarters - Halfway houses (%)
People in Group quarters - Local jails and other confinement facilities (including police lockups) (%)
People in Group quarters - Military disciplinary barracks (%)
People in Group quarters - State prisons (%)
People in Group quarters - Other types of correctional institutions (%)
People in Group quarters - Nursing homes (%)
People in Group quarters - Hospitals/wards, hospices, and schools for the handicapped (%)
People in Group quarters - Hospitals/wards and hospices for chronically ill (%)
People in Group quarters - Hospices or homes for chronically ill (%)
People in Group quarters - Military hospitals or wards for chronically ill (%)
People in Group quarters - Other hospitals or wards for chronically ill (%)
People in Group quarters - Hospitals or wards for drug/alcohol abuse (%)
People in Group quarters - Mental (Psychiatric) hospitals or wards (%)
People in Group quarters - Schools, hospitals, or wards for the mentally retarded (%)
People in Group quarters - Schools, hospitals, or wards for the physically handicapped (%)
People in Group quarters - Institutions for the deaf (%)
People in Group quarters - Institutions for the blind (%)
People in Group quarters - Orthopedic wards and institutions for the physically handicapped (%)
People in Group quarters - Wards in general hospitals for patients who have no usual home elsewhere (%)
People in Group quarters - Wards in military hospitals for patients who have no usual home elsewhere (%)
People in Group quarters - Juvenile institutions (%)
People in Group quarters - Long-term care (%)
People in Group quarters - Homes for abused, dependent, and neglected children (%)
People in Group quarters - Residential treatment centers for emotionally disturbed children (%)
People in Group quarters - Training schools for juvenile delinquents (%)
People in Group quarters - Short-term care, detention or diagnostic centers for delinquent children (%)
People in Group quarters - Type of juvenile institution unknown (%)
People in Group quarters - Noninstitutionalized population (%)
People in Group quarters - College dormitories (includes college quarters off campus) (%)
People in Group quarters - Military quarters (%)
People in Group quarters - On base (%)
People in Group quarters - Barracks, unaccompanied personnel housing (UPH), (Enlisted/Officer), ;and similar group living quarters for military personnel (%)
People in Group quarters - Transient quarters for temporary residents (%)
People in Group quarters - Military ships (%)
People in Group quarters - Group homes (%)
People in Group quarters - Homes or halfway houses for drug/alcohol abuse (%)
People in Group quarters - Homes for the mentally ill (%)
People in Group quarters - Homes for the mentally retarded (%)
People in Group quarters - Homes for the physically handicapped (%)
People in Group quarters - Other group homes (%)
People in Group quarters - Religious group quarters (%)
People in Group quarters - Dormitories (%)
People in Group quarters - Agriculture workers' dormitories on farms (%)
People in Group quarters - Job Corps and vocational training facilities (%)
People in Group quarters - Other workers' dormitories (%)
People in Group quarters - Crews of maritime vessels (%)
People in Group quarters - Other nonhousehold living situations (%)
People in Group quarters - Other noninstitutional group quarters (%)
Residents speaking English at home (%)
Residents speaking English at home - Born in the United States (%)
Residents speaking English at home - Native, born elsewhere (%)
Residents speaking English at home - Foreign born (%)
Residents speaking Spanish at home (%)
Residents speaking Spanish at home - Born in the United States (%)
Residents speaking Spanish at home - Native, born elsewhere (%)
Residents speaking Spanish at home - Foreign born (%)
Residents speaking other language at home (%)
Residents speaking other language at home - Born in the United States (%)
Residents speaking other language at home - Native, born elsewhere (%)
Residents speaking other language at home - Foreign born (%)
Class of Workers - Employee of private company (%)
Class of Workers - Self-employed in own incorporated business (%)
Class of Workers - Private not-for-profit wage and salary workers (%)
Class of Workers - Local government workers (%)
Class of Workers - State government workers (%)
Class of Workers - Federal government workers (%)
Class of Workers - Self-employed workers in own not incorporated business and Unpaid family workers (%)
House heating fuel used in houses and condos - Utility gas (%)
House heating fuel used in houses and condos - Bottled, tank, or LP gas (%)
House heating fuel used in houses and condos - Electricity (%)
House heating fuel used in houses and condos - Fuel oil, kerosene, etc. (%)
House heating fuel used in houses and condos - Coal or coke (%)
House heating fuel used in houses and condos - Wood (%)
House heating fuel used in houses and condos - Solar energy (%)
House heating fuel used in houses and condos - Other fuel (%)
House heating fuel used in houses and condos - No fuel used (%)
House heating fuel used in apartments - Utility gas (%)
House heating fuel used in apartments - Bottled, tank, or LP gas (%)
House heating fuel used in apartments - Electricity (%)
House heating fuel used in apartments - Fuel oil, kerosene, etc. (%)
House heating fuel used in apartments - Coal or coke (%)
House heating fuel used in apartments - Wood (%)
House heating fuel used in apartments - Solar energy (%)
House heating fuel used in apartments - Other fuel (%)
House heating fuel used in apartments - No fuel used (%)
Armed forces status - In Armed Forces (%)
Armed forces status - Civilian (%)
Armed forces status - Civilian - Veteran (%)
Armed forces status - Civilian - Nonveteran (%)
Fatal accidents locations in years 2005-2021
Fatal accidents locations in 2005
Fatal accidents locations in 2006
Fatal accidents locations in 2007
Fatal accidents locations in 2008
Fatal accidents locations in 2009
Fatal accidents locations in 2010
Fatal accidents locations in 2011
Fatal accidents locations in 2012
Fatal accidents locations in 2013
Fatal accidents locations in 2014
Fatal accidents locations in 2015
Fatal accidents locations in 2016
Fatal accidents locations in 2017
Fatal accidents locations in 2018
Fatal accidents locations in 2019
Fatal accidents locations in 2020
Fatal accidents locations in 2021
Alcohol use - People drinking some alcohol every month (%)
Alcohol use - People not drinking at all (%)
Alcohol use - Average days/month drinking alcohol
Alcohol use - Average drinks/week
Alcohol use - Average days/year people drink much
Audiometry - Average condition of hearing (%)
Audiometry - People that can hear a whisper from across a quiet room (%)
Audiometry - People that can hear normal voice from across a quiet room (%)
Audiometry - Ears ringing, roaring, buzzing (%)
Audiometry - Had a job exposure to loud noise (%)
Audiometry - Had off-work exposure to loud noise (%)
Blood Pressure & Cholesterol - Has high blood pressure (%)
Blood Pressure & Cholesterol - Checking blood pressure at home (%)
Blood Pressure & Cholesterol - Frequently checking blood cholesterol (%)
Blood Pressure & Cholesterol - Has high cholesterol level (%)
Consumer Behavior - Money monthly spent on food at supermarket/grocery store
Consumer Behavior - Money monthly spent on food at other stores
Consumer Behavior - Money monthly spent on eating out
Consumer Behavior - Money monthly spent on carryout/delivered foods
Consumer Behavior - Income spent on food at supermarket/grocery store (%)
Consumer Behavior - Income spent on food at other stores (%)
Consumer Behavior - Income spent on eating out (%)
Consumer Behavior - Income spent on carryout/delivered foods (%)
Current Health Status - General health condition (%)
Current Health Status - Blood donors (%)
Current Health Status - Has blood ever tested for HIV virus (%)
Current Health Status - Left-handed people (%)
Dermatology - People using sunscreen (%)
Diabetes - Diabetics (%)
Diabetes - Had a blood test for high blood sugar (%)
Diabetes - People taking insulin (%)
Diet Behavior & Nutrition - Diet health (%)
Diet Behavior & Nutrition - Milk product consumption (# of products/month)
Diet Behavior & Nutrition - Meals not home prepared (#/week)
Diet Behavior & Nutrition - Meals from fast food or pizza place (#/week)
Diet Behavior & Nutrition - Ready-to-eat foods (#/month)
Diet Behavior & Nutrition - Frozen meals/pizza (#/month)
Drug Use - People that ever used marijuana or hashish (%)
Drug Use - Ever used hard drugs (%)
Drug Use - Ever used any form of cocaine (%)
Drug Use - Ever used heroin (%)
Drug Use - Ever used methamphetamine (%)
Health Insurance - People covered by health insurance (%)
Kidney Conditions-Urology - Avg. # of times urinating at night
Medical Conditions - People with asthma (%)
Medical Conditions - People with anemia (%)
Medical Conditions - People with psoriasis (%)
Medical Conditions - People with overweight (%)
Medical Conditions - Elderly people having difficulties in thinking or remembering (%)
Medical Conditions - People who ever received blood transfusion (%)
Medical Conditions - People having trouble seeing even with glass/contacts (%)
Medical Conditions - People with arthritis (%)
Medical Conditions - People with gout (%)
Medical Conditions - People with congestive heart failure (%)
Medical Conditions - People with coronary heart disease (%)
Medical Conditions - People with angina pectoris (%)
Medical Conditions - People who ever had heart attack (%)
Medical Conditions - People who ever had stroke (%)
Medical Conditions - People with emphysema (%)
Medical Conditions - People with thyroid problem (%)
Medical Conditions - People with chronic bronchitis (%)
Medical Conditions - People with any liver condition (%)
Medical Conditions - People who ever had cancer or malignancy (%)
Mental Health - People who have little interest in doing things (%)
Mental Health - People feeling down, depressed, or hopeless (%)
Mental Health - People who have trouble sleeping or sleeping too much (%)
Mental Health - People feeling tired or having little energy (%)
Mental Health - People with poor appetite or overeating (%)
Mental Health - People feeling bad about themself (%)
Mental Health - People who have trouble concentrating on things (%)
Mental Health - People moving or speaking slowly or too fast (%)
Mental Health - People having thoughts they would be better off dead (%)
Oral Health - Average years since last visit a dentist
Oral Health - People embarrassed because of mouth (%)
Oral Health - People with gum disease (%)
Oral Health - General health of teeth and gums (%)
Oral Health - Average days a week using dental floss/device
Oral Health - Average days a week using mouthwash for dental problem
Oral Health - Average number of teeth
Pesticide Use - Households using pesticides to control insects (%)
Pesticide Use - Households using pesticides to kill weeds (%)
Physical Activity - People doing vigorous-intensity work activities (%)
Physical Activity - People doing moderate-intensity work activities (%)
Physical Activity - People walking or bicycling (%)
Physical Activity - People doing vigorous-intensity recreational activities (%)
Physical Activity - People doing moderate-intensity recreational activities (%)
Physical Activity - Average hours a day doing sedentary activities
Physical Activity - Average hours a day watching TV or videos
Physical Activity - Average hours a day using computer
Physical Functioning - People having limitations keeping them from working (%)
Physical Functioning - People limited in amount of work they can do (%)
Physical Functioning - People that need special equipment to walk (%)
Physical Functioning - People experiencing confusion/memory problems (%)
Physical Functioning - People requiring special healthcare equipment (%)
Prescription Medications - Average number of prescription medicines taking
Preventive Aspirin Use - Adults 40+ taking low-dose aspirin (%)
Reproductive Health - Vaginal deliveries (%)
Reproductive Health - Cesarean deliveries (%)
Reproductive Health - Deliveries resulted in a live birth (%)
Reproductive Health - Pregnancies resulted in a delivery (%)
Reproductive Health - Women breastfeeding newborns (%)
Reproductive Health - Women that had a hysterectomy (%)
Reproductive Health - Women that had both ovaries removed (%)
Reproductive Health - Women that have ever taken birth control pills (%)
Reproductive Health - Women taking birth control pills (%)
Reproductive Health - Women that have ever used Depo-Provera or injectables (%)
Reproductive Health - Women that have ever used female hormones (%)
Sexual Behavior - People 18+ that ever had sex (vaginal, anal, or oral) (%)
Sexual Behavior - Males 18+ that ever had vaginal sex with a woman (%)
Sexual Behavior - Males 18+ that ever performed oral sex on a woman (%)
Sexual Behavior - Males 18+ that ever had anal sex with a woman (%)
Sexual Behavior - Males 18+ that ever had any sex with a man (%)
Sexual Behavior - Females 18+ that ever had vaginal sex with a man (%)
Sexual Behavior - Females 18+ that ever performed oral sex on a man (%)
Sexual Behavior - Females 18+ that ever had anal sex with a man (%)
Sexual Behavior - Females 18+ that ever had any kind of sex with a woman (%)
Sexual Behavior - Average age people first had sex
Sexual Behavior - Average number of female sex partners in lifetime (males 18+)
Sexual Behavior - Average number of female vaginal sex partners in lifetime (males 18+)
Sexual Behavior - Average age people first performed oral sex on a woman (18+)
Sexual Behavior - Average number of woman performed oral sex on in lifetime (18+)
Sexual Behavior - Average number of male sex partners in lifetime (males 18+)
Sexual Behavior - Average number of male anal sex partners in lifetime (males 18+)
Sexual Behavior - Average age people first performed oral sex on a man (18+)
Sexual Behavior - Average number of male oral sex partners in lifetime (18+)
Sexual Behavior - People using protection when performing oral sex (%)
Sexual Behavior - Average number of times people have vaginal or anal sex a year
Sexual Behavior - People having sex without condom (%)
Sexual Behavior - Average number of male sex partners in lifetime (females 18+)
Sexual Behavior - Average number of male vaginal sex partners in lifetime (females 18+)
Sexual Behavior - Average number of female sex partners in lifetime (females 18+)
Sexual Behavior - Circumcised males 18+ (%)
Sleep Disorders - Average hours sleeping at night
Sleep Disorders - People that has trouble sleeping (%)
Smoking-Cigarette Use - People smoking cigarettes (%)
Taste & Smell - People 40+ having problems with smell (%)
Taste & Smell - People 40+ having problems with taste (%)
Taste & Smell - People 40+ that ever had wisdom teeth removed (%)
Taste & Smell - People 40+ that ever had tonsils teeth removed (%)
Taste & Smell - People 40+ that ever had a loss of consciousness because of a head injury (%)
Taste & Smell - People 40+ that ever had a broken nose or other serious injury to face or skull (%)
Taste & Smell - People 40+ that ever had two or more sinus infections (%)
Weight - Average height (inches)
Weight - Average weight (pounds)
Weight - Average BMI
Weight - People that are obese (%)
Weight - People that ever were obese (%)
Weight - People trying to lose weight (%)
Urban population: 12,494
Rural population: 4,192
Estimated median house/condo value in 2022: $188,086
16148:
$188,086Pennsylvania:
$245,500
According to our research of Pennsylvania and other state lists, there were 17 registered sex offenders living in 16148 zip code as of April 27, 2024 . The ratio of all residents to sex offenders in zip code 16148 is 987 to 1.The ratio of registered sex offenders to all residents in this zip code is lower than the state average.
Median resident age: This zip code:
49.3 yearsPennsylvania median age:
40.9 years
Average household size: This zip code:
2.0 peoplePennsylvania:
2.4 people
Averages for the 2020 tax year for zip code 16148, filed in 2021:
Average Adjusted Gross Income (AGI) in 2020: $64,382 (Individual Income Tax Returns) Here:
$64,382State:
$75,707
Salary/wage: $55,331 (reported on 72.8% of returns )Here:
$55,331State:
$62,806
(% of AGI for various income ranges: 868.0% for AGIs below $25k , 3051.2% for AGIs $25k-50k , 5532.0% for AGIs $50k-75k , 8464.9% for AGIs $75k-100k , 16015.9% for AGIs $100k-200k , 77429.0% for AGIs over 200k ) Taxable interest for individuals: $2,629 (reported on 37.4% of returns )This zip code:
$2,629Pennsylvania:
$1,633
(% of AGI for various income ranges: 34.2% for AGIs below $25k , 51.8% for AGIs $25k-50k , 100.6% for AGIs $50k-75k , 104.4% for AGIs $75k-100k , 174.1% for AGIs $100k-200k , 4427.0% for AGIs over 200k ) Ordinary dividends: $5,093 (reported on 25.3% of returns )(% of AGI for various income ranges: 47.8% for AGIs below $25k , 76.8% for AGIs $25k-50k , 186.9% for AGIs $50k-75k , 176.9% for AGIs $75k-100k , 374.9% for AGIs $100k-200k , 3822.0% for AGIs over 200k ) Net capital gain/loss in AGI: +$8,552 (reported on 20.7% of returns )Here:
+$8,552State:
+$23,522
(% of AGI for various income ranges: 26.2% for AGIs below $25k , 34.2% for AGIs $25k-50k , 86.2% for AGIs $50k-75k , 229.8% for AGIs $75k-100k , 369.6% for AGIs $100k-200k , 9787.0% for AGIs over 200k ) Profit/loss from business: +$12,888 (reported on 10.8% of returns )Here:
+$12,888State:
+$16,274
(% of AGI for various income ranges: 59.9% for AGIs below $25k , 94.0% for AGIs $25k-50k , 94.8% for AGIs $50k-75k , 249.0% for AGIs $75k-100k , 530.1% for AGIs $100k-200k , 3558.0% for AGIs over 200k ) Taxable individual retirement arrangement distribution: $15,304 (reported on 17.2% of returns )16148:
$15,304Pennsylvania:
$18,583
(% of AGI for various income ranges: 135.5% for AGIs below $25k , 203.4% for AGIs $25k-50k , 409.7% for AGIs $50k-75k , 552.6% for AGIs $75k-100k , 1045.2% for AGIs $100k-200k , 2998.0% for AGIs over 200k ) Self-employed (Keogh) retirement plans: $22,600 (reported on 0.2% of returns )16148:
$22,600Pennsylvania:
$25,407
(% of AGI for various income ranges: 65.5% for AGIs $100k-200k ) Total itemized deductions: $33,468 (reported on 4.2% of returns )Here:
$33,468State:
$34,850
(% of AGI for various income ranges: 67.9% for AGIs below $25k , 61.2% for AGIs $25k-50k , 151.6% for AGIs $50k-75k , 212.1% for AGIs $75k-100k , 422.8% for AGIs $100k-200k , 4519.0% for AGIs over 200k ) Charity contributions: $11,428 (reported on 3.3% of returns )Here:
$11,428State:
$12,392
(% of AGI for various income ranges: 9.4% for AGIs $25k-50k , 23.1% for AGIs $50k-75k , 43.3% for AGIs $75k-100k , 128.6% for AGIs $100k-200k , 1808.0% for AGIs over 200k ) Taxes paid: $7,217 (reported on 4.1% of returns )(% of AGI for various income ranges: 2.1% for AGIs below $25k , 7.9% for AGIs $25k-50k , 29.4% for AGIs $50k-75k , 48.5% for AGIs $75k-100k , 130.9% for AGIs $100k-200k , 970.0% for AGIs over 200k ) Earned income credit: $2,000 (reported on 11.8% of returns )(% of AGI for various income ranges: 65.0% for AGIs below $25k , 50.6% for AGIs $25k-50k ) Percentage of individuals using paid preparers for their 2020 taxes: 89.6%(% for various income ranges: 87.1% for AGIs below $25k , 91.2% for AGIs $25k-50k , 89.8% for AGIs $50k-75k , 90.1% for AGIs $75k-100k , 91.6% for AGIs $100k-200k , 93.9% for AGIs over 200k )
Averages for the 2012 tax year for zip code 16148, filed in 2013:
Average Adjusted Gross Income (AGI) in 2012: $56,665 (Individual Income Tax Returns) Here:
$56,665State:
$61,346
Salary/wage: $48,355 (reported on 75.4% of returns )Here:
$48,355State:
$51,902
(% of AGI for various income ranges: 58.5% for AGIs below $25k , 69.2% for AGIs $25k-50k , 71.8% for AGIs $50k-75k , 68.3% for AGIs $75k-100k , 71.9% for AGIs $100k-200k , 50.5% for AGIs over 200k ) Taxable interest for individuals: $2,018 (reported on 44.2% of returns )This zip code:
$2,018Pennsylvania:
$1,588
(% of AGI for various income ranges: 2.9% for AGIs below $25k , 1.3% for AGIs $25k-50k , 0.9% for AGIs $50k-75k , 1.2% for AGIs $75k-100k , 1.3% for AGIs $100k-200k , 2.2% for AGIs over 200k ) Ordinary dividends: $4,120 (reported on 28.1% of returns )(% of AGI for various income ranges: 3.0% for AGIs below $25k , 1.8% for AGIs $25k-50k , 1.3% for AGIs $50k-75k , 1.6% for AGIs $75k-100k , 1.8% for AGIs $100k-200k , 2.7% for AGIs over 200k ) Net capital gain/loss in AGI: +$7,323 (reported on 19.0% of returns )Here:
+$7,323State:
+$14,495
(% of AGI for various income ranges: 0.5% for AGIs $50k-75k , 0.7% for AGIs $75k-100k , 0.8% for AGIs $100k-200k , 8.1% for AGIs over 200k ) Profit/loss from business: +$15,198 (reported on 11.5% of returns )Here:
+$15,198State:
+$16,268
(% of AGI for various income ranges: 3.5% for AGIs below $25k , 2.5% for AGIs $25k-50k , 2.2% for AGIs $50k-75k , 2.4% for AGIs $75k-100k , 2.8% for AGIs $100k-200k , 4.4% for AGIs over 200k ) Taxable individual retirement arrangement distribution: $11,235 (reported on 16.1% of returns )16148:
$11,235Pennsylvania:
$14,550
(% of AGI for various income ranges: 5.7% for AGIs below $25k , 3.7% for AGIs $25k-50k , 3.5% for AGIs $50k-75k , 3.8% for AGIs $75k-100k , 3.1% for AGIs $100k-200k , 1.7% for AGIs over 200k ) Self-employment retirement plans: $19,929 (reported on 0.8% of returns )16148:
$19,929Pennsylvania:
$20,922
Total itemized deductions: $22,702 (18% of AGI, reported on 25.6% of returns )Here:
$22,702State:
$23,538
Here:
17.8% of AGIState:
18.4% of AGI
(% of AGI for various income ranges: 9.1% for AGIs below $25k , 6.5% for AGIs $25k-50k , 7.3% for AGIs $50k-75k , 10.3% for AGIs $75k-100k , 12.8% for AGIs $100k-200k , 12.2% for AGIs over 200k ) Charity contributions: $4,334 (reported on 21.0% of returns )(% of AGI for various income ranges: 0.8% for AGIs below $25k , 0.9% for AGIs $25k-50k , 0.9% for AGIs $50k-75k , 1.5% for AGIs $75k-100k , 1.9% for AGIs $100k-200k , 2.5% for AGIs over 200k ) Taxes paid: $9,455 (reported on 25.4% of returns )(% of AGI for various income ranges: 1.4% for AGIs below $25k , 1.9% for AGIs $25k-50k , 2.6% for AGIs $50k-75k , 3.9% for AGIs $75k-100k , 5.9% for AGIs $100k-200k , 6.0% for AGIs over 200k ) Earned income credit: $1,907 (reported on 11.8% of returns )(% of AGI for various income ranges: 3.9% for AGIs below $25k , 0.6% for AGIs $25k-50k ) Percentage of individuals using paid preparers for their 2012 taxes: 51.2%(% for various income ranges: 43.2% for AGIs below $25k , 51.1% for AGIs $25k-50k , 56.5% for AGIs $50k-75k , 57.3% for AGIs $75k-100k , 62.8% for AGIs $100k-200k , 79.3% for AGIs over 200k )
Averages for the 2004 tax year for zip code 16148, filed in 2005:
Average Adjusted Gross Income (AGI) in 2004: $44,058 (Individual Income Tax Returns) Here:
$44,058State:
$48,049
Salary/wage: $39,923 (reported on 76.0% of returns )Here:
$39,923State:
$42,646
(% of AGI for various income ranges: 81.4% for AGIs below $10k , 55.9% for AGIs $10k-25k , 72.3% for AGIs $25k-50k , 77.8% for AGIs $50k-75k , 77.1% for AGIs $75k-100k , 61.2% for AGIs over 100k ) Taxable interest for individuals: $2,307 (reported on 58.0% of returns )This zip code:
$2,307Pennsylvania:
$1,657
(% of AGI for various income ranges: 10.2% for AGIs below $10k , 6.5% for AGIs $10k-25k , 3.2% for AGIs $25k-50k , 1.9% for AGIs $50k-75k , 1.9% for AGIs $75k-100k , 2.8% for AGIs over 100k ) Taxable dividends: $2,957 (reported on 34.5% of returns )(% of AGI for various income ranges: 7.5% for AGIs below $10k , 3.4% for AGIs $10k-25k , 1.9% for AGIs $25k-50k , 1.7% for AGIs $50k-75k , 1.7% for AGIs $75k-100k , 2.6% for AGIs over 100k ) Net capital gain/loss: +$6,759 (reported on 24.7% of returns )Here:
+$6,759State:
+$9,716
(% of AGI for various income ranges: -3.2% for AGIs below $10k , 0.2% for AGIs $10k-25k , 0.6% for AGIs $25k-50k , 1.0% for AGIs $50k-75k , 1.6% for AGIs $75k-100k , 9.2% for AGIs over 100k ) Profit/loss from business: +$13,761 (reported on 12.5% of returns )Here:
+$13,761State:
+$14,267
(% of AGI for various income ranges: 4.1% for AGIs below $10k , 3.4% for AGIs $10k-25k , 2.4% for AGIs $25k-50k , 2.2% for AGIs $50k-75k , 3.8% for AGIs $75k-100k , 5.8% for AGIs over 100k ) IRA payment deduction: $2,971 (reported on 3.7% of returns )16148:
$2,971Pennsylvania:
$2,903
(% of AGI for various income ranges: 0.3% for AGIs below $10k , 0.4% for AGIs $10k-25k , 0.4% for AGIs $25k-50k , 0.3% for AGIs $50k-75k , 0.2% for AGIs $75k-100k , 0.1% for AGIs over 100k ) Self-employed pension: $13,983 (reported on 0.7% of returns )Here:
$13,983Pennsylvania:
$14,674
Total itemized deductions: $16,953 (20% of AGI, reported on 29.8% of returns )Here:
$16,953State:
$18,804
Here:
19.7% of AGIState:
19.5% of AGI
(% of AGI for various income ranges: 13.0% for AGIs below $10k , 9.2% for AGIs $10k-25k , 9.8% for AGIs $25k-50k , 11.3% for AGIs $50k-75k , 13.1% for AGIs $75k-100k , 12.2% for AGIs over 100k ) Charity contributions deductions: $2,797 (3% of AGI, reported on 26.4% of returns )Here:
3.1% of AGIState:
3.3% of AGI
(% of AGI for various income ranges: 0.8% for AGIs below $10k , 1.0% for AGIs $10k-25k , 1.2% for AGIs $25k-50k , 1.6% for AGIs $50k-75k , 1.8% for AGIs $75k-100k , 2.2% for AGIs over 100k ) Total tax: $7,135 (reported on 73.0% of returns )(% of AGI for various income ranges: 2.1% for AGIs below $10k , 3.7% for AGIs $10k-25k , 7.2% for AGIs $25k-50k , 9.0% for AGIs $50k-75k , 10.5% for AGIs $75k-100k , 19.1% for AGIs over 100k ) Earned income credit: $1,521 (reported on 10.0% of returns )Percentage of individuals using paid preparers for their 2004 taxes: 57.7%(% for various income ranges: 51.4% for AGIs below $10k , 58.4% for AGIs $10k-25k , 57.9% for AGIs $25k-50k , 58.7% for AGIs $50k-75k , 58.2% for AGIs $75k-100k , 70.8% for AGIs over 100k )
Estimated median household income in 2022: This zip code:
$66,103Pennsylvania:
$71,798
Nearest zip codes: 16113 ,
16150 ,
16121 ,
16146 ,
16161 ,
16159 .
Hermitage Zip Code Map
Percentage of family households: This zip code:
41.0%Pennsylvania:
42.6%
Percentage of households with unmarried partners: This zip code:
5.8%Pennsylvania:
46.5%
Likely homosexual households (counted as self-reported same-sex unmarried-partner households)
Lesbian couples: 0.1% of all households Gay men: 0.1% of all households
Household received Food Stamps/SNAP in the past 12 months: 1,156Household did not receive Food Stamps/SNAP in the past 12 months: 6,839
Women who had a birth in the past 12 months: 319 (270 now married , 56 unmarried) Women who did not have a birth in the past 12 months: 2,897 (1,300 now married , 1,592 unmarried)
Housing units in zip code 16148 with a mortgage: 2,786 (405
second mortgage , 18
home equity loan , 388
both second mortgage and home equity loan )
Houses without a mortgage: 241
Median monthly owner costs for units with a mortgage: $1,257
Median monthly owner costs for units without a mortgage: $497
Residents with income below the poverty level in 2022:
This zip code:
12.0%Whole state:
11.8%
Residents with income below 50% of the poverty level in 2022:
This zip code:
8.4%Whole state:
6.1%
Median number of rooms in houses and condos: Median number of rooms in apartments: Notable locations in this zip code not listed on our city pages
Click to draw/clear zip code borders Notable locations in zip code 16148: (A) , Oakland Station (B) , Patagonia Volunteer Fire Department / Hermitage Fire Department Station 2 (C) , Hermitage Fire Department Station 1 Headquarters (D) , Hermitage Fire Department Station 3 (E) . Display/hide their locations on the map
Churches in zip code 16148 include: (A) , Central Church (B) . Display/hide their locations on the map
Cemeteries: (1) , Saint Stanislaus Cemetery (2) , Hillcrest Memorial Park (3) , Saint Annes Cemetery (4) , Saint Anthonys Cemetery (5) , Holy Trinty Cemetery (6) , Saint Johns Cemetery (7) . Display/hide their locations on the map
Lakes and reservoirs: (A) , Shenango River Lake (B) . Display/hide their locations on the map
Streams, rivers, and creeks: (A) , Pine Hollow Run (B) , Big Run (C) . Display/hide their locations on the map
Park in zip code 16148: (1) . Display/hide its location on the map
Year house built (houses)
12 2020 or later202 2010 to 20191,018 2000 to 20091,265 1990 to 1999648 1980 to 19891,401 1970 to 19791,410 1960 to 19691,426 1950 to 1959441 1940 to 1949510 1939 or earlier
Zip code 16148 household income distribution in 2022 434 Less than $10,000361 $10,000 to $14,999246 $15,000 to $19,999346 $20,000 to $24,999559 $25,000 to $29,999393 $30,000 to $34,999304 $35,000 to $39,999303 $40,000 to $44,999256 $45,000 to $49,999462 $50,000 to $59,999701 $60,000 to $74,999993 $75,000 to $99,999974 $100,000 to $124,999475 $125,000 to $149,999687 $150,000 to $199,999464 $200,000 or moreEstimate of home value of owner-occupied houses/condos in 2022 in zip code 16148 263 Less than $10,00021 $10,000 to $14,99914 $15,000 to $19,99912 $20,000 to $24,9997 $30,000 to $34,99961 $40,000 to $49,99955 $50,000 to $59,999122 $70,000 to $79,999125 $80,000 to $89,999219 $90,000 to $99,999494 $100,000 to $124,999581 $125,000 to $149,999613 $150,000 to $174,999534 $175,000 to $199,999714 $200,000 to $249,999390 $250,000 to $299,999675 $300,000 to $399,999324 $400,000 to $499,999180 $500,000 to $749,99919 $750,000 to $999,99965 $1,000,000 to $1,499,999Rent paid by renters in 2022 in zip code 16148 158 $150 to $19998 $200 to $24949 $300 to $3497 $350 to $39972 $400 to $44960 $450 to $499152 $500 to $549125 $550 to $599112 $600 to $649275 $650 to $699108 $700 to $749106 $750 to $799274 $800 to $899300 $900 to $99985 $1,000 to $1,24938 $1,250 to $1,49930 $1,500 to $1,99944 $2,000 to $2,49913 $2,500 to $2,99924 $3,500 or more36 No cash rent
Median gross rent in 2022: $832.
Median price asked for vacant for-sale houses and condos in 2022: $210,349.
Estimated median house (or condo) value in 2022 for: White Non-Hispanic householders: $192,025Black or African American householders: $137,864Asian householders: $195,373Two or more races householders: $167,406Estimated median house or condo value in 2022: $188,086
16148:
$188,086Pennsylvania:
$245,500
Lower value quartile - upper value quartile: $132,484 - $273,724
Mean price in 2022: Detached houses: $245,904Here:
$245,904State:
$317,202
Townhouses or other attached units: $234,405Here:
$234,405State:
$254,369
Mobile homes: $11,631Here:
$11,631State:
$92,414
Housing units in structures:
One, detached: 5,970One, attached: 488Two: 463 or 4: 2265 to 9: 51010 to 19: 36020 to 49: 20650 or more: 255Mobile homes: 353Unemployment : 3.7%
Means of transportation to work in zip code 16148 81.9% 6,127 Drove a car alone6.2% 462 Carpooled0.0% 3 Bus or trolley bus0.0% 1 Taxi0.1% 9 Bicycle0.7% 50 Walked0.8% 60 Other means9.3% 697 Worked at homeTravel time to work (commute) in zip code 16148 354 Less than 5 minutes1,361 5 to 9 minutes1,599 10 to 14 minutes1,120 15 to 19 minutes648 20 to 24 minutes304 25 to 29 minutes608 30 to 34 minutes75 35 to 39 minutes111 40 to 44 minutes186 45 to 59 minutes183 60 to 89 minutes116 90 or more minutes
Percentage of zip code residents living and working in this county: 81.3%
Household type by relationship:
Households: 16,687
Male householders: 3,840 (1,347 living alone ), Female householders: 4,156 (1,678 living alone )3,858 spouses (3,838 opposite-sex spouses ), 353 unmarried partners , (340 opposite-sex unmarried partners ), 3,818 children (3,430 natural , 201 adopted , 182 stepchildren ), 101 grandchildren , 47 brothers or sisters , 94 parents , 30 foster children , 43 other relatives , 133 non-relatives In group quarters: 290 (-1 institutionalized population )
Size of family households: 2,854 2-persons , 942 3-persons , 535 4-persons , 360 5-persons , 21 6-persons , 88 7-or-more-persons
Size of nonfamily households: 3,024 1-person , 181 2-persons
1,939 married couples with children. single-parent households (198 men , 617 women ).
97.1% of residents of 16148 zip code speak English at home. of residents speak Spanish at home (55% very well, 21% well, 24% not well ).of residents speak other Indo-European language at home (80% very well, 20% well ).of residents speak Asian or Pacific Island language at home (43% very well, 50% well, 7% not well ).of residents speak other language at home (80% very well, 20% well ).
Foreign born population: 503 (3.0%)
(76.8%
of them are naturalized citizens )
This zip code:
3.0%Whole state:
7.5%
11% Dominica 8% El Salvador 8% Thailand 8% Bhutan 7% Malaysia 5% Singapore 4% North Macedonia (Macedonia) 16% American 11% Italian 10% German 8% English 7% Polish 7% Irish 6% European
Year of entry for the foreign-born population
205 2010 or later 158 2000 to 2009 38 1990 to 1999 200 Before 1990
There are
331 Other Medical Specialists in Zip Code 16148.
Facilities with environmental interests located in this zip code:
10 MINUTE OIL CHANGE (3229 E STATE ST in HERMITAGE, PA)
STATE MASTER (Pennsylvania database) - RCRIS-PAR000019349, HAZARDOUS WASTE PROGRAM National Pollutant Discharge Elimination System NON-MAJOR (Tracking pollutant discharge elimination systems) - permit Conditionally Exempt Small Quantity Generators, less than 100 kg/month of hazardous waste (Resource Conservation and Recovery Act (tracking hazardous waste)) - notification Organizations: PENNZOIL QUAKER STATE CO (CONTACT/GENERAL)
, PENNZOIL PRODS CO (CONTACT/OWNER)
Alternative names: PENNZOIL-QUAKER STATE CO, SHELL OIL PRODUCTS US
BIOREMEDIAL TECH (2700 KIRILA DR in HERMITAGE, PA)
STATE MASTER (Pennsylvania database) - RCRIS-PAR000504563, HAZARDOUS WASTE PROGRAM Conditionally Exempt Small Quantity Generators, less than 100 kg/month of hazardous waste (Resource Conservation and Recovery Act (tracking hazardous waste)) - notification Organizations: PERRY DONALD (CONTACT/OWNER)
, DONALD PERRY (CONTACT/OWNER)
ARTMAN EL SCH ( in HERMITAGE, PA)
(National Center for Education Statistics) - STATE ID-3146 Organizations: HERMITAGE SD (SCHOOL DISTRICT)
ALPONT TRANSP LLC (2797 FREEDLAND ROAD in HERMITAGE, PA)
TRANSPORTER (Resource Conservation and Recovery Act (tracking hazardous waste)) USED OIL PROGRAM (Resource Conservation and Recovery Act (tracking hazardous waste)) Organizations: PUNTURERI ALBERT (CONTACT/OWNER)
ANITA KAMMERDIENER (194 HORVATH FARMS RD in HERMITAGE, PA)
National Pollutant Discharge Elimination System NON-MAJOR (Tracking pollutant discharge elimination systems) - permit Business SIC classification: OPERATORS OF DWELLINGS OTHER THAN APARTMENT BUILDINGSAlternative names: KAMMERDIENER, ANITA
Housing units lacking complete kitchen facilities: 2.7%
74.2% Utility gas 19.7% Electricity 3.2% Fuel oil, kerosene, etc. 2.0% Bottled, tank, or LP gas
Population in 1990: 14,573.
Place of birth for U.S.-born residents:
This state: 12,953Northeast: 376Midwest: 1,840South: 609West: 255
68% of the 16148 zip code residents lived in the same house 5 years ago.
Out of people who lived in different houses, 71% lived in this county.
Out of people who lived in different counties, 50% lived in Pennsylvania.
93% of the 16148 zip code residents lived in the same house 1 year ago.
Out of people who lived in different houses, 57% moved from this county.
Out of people who lived in different houses, 24% moved from different county within same state.
Out of people who lived in different houses, 17% moved from different state.
Out of people who lived in different houses, 2% moved from abroad.
Private vs. public school enrollment:
Students in private schools in grades 1 to 8 (elementary and middle school): 62
Here:
4.5%Pennsylvania:
15.7%
Students in private schools in grades 9 to 12 (high school): 99
Here:
12.7%Pennsylvania:
13.4%
Students in private undergraduate colleges: 148
Here:
22.5%Pennsylvania:
39.8%
Occupation by median earnings in the past 12 months ($)
145,241 Architecture and engineering occupations 103,724 Law enforcement workers including supervisors 101,081 Health diagnosing and treating practitioners and other technical occupations 79,471 Management occupations 69,408 Business and financial operations occupations 68,770 Education, training, and library occupations
Companies with federal contracts located in this zip code:
MADURA STEEL SALES, INC (2505 N HERMITAGE RD in HERMITAGE, PA; small business) in 2 contracts from 2001 to 2003
$64,750 with Navy for Oils and Greases: Cutting, Lubricating, and Hydraulic. Signed on 2001-11-01. Completion date: 2001-12-17.
with Navy for Bars and Rods. Signed on 2003-05-06. Completion date: 2003-07-30.
STAR PROPERTIES, INC (3200 S HERMITAGE RD in HERMITAGE, PA; small business) in 7 contracts from 2002 to 2006
Contracts for Lodging - Hotel/Motel by ArmySigned by year: 2000: $0; 2001: $0; 2002: $3,927; 2003: $107,655; 2004: $0; 2005: $2,805; 2006: $6,710.
Biggest contracts: with Army for Lodging - Hotel/Motel. Signed on 2003-11-13. Completion date: 2003-12-12.
, same as above. Signed on 2003-03-07. Completion date: 2003-03-17.
, same as above. Signed on 2003-11-21. Completion date: 2003-12-12.
, same as above. Signed on 2006-01-17. Completion date: 2006-01-22.
Top industries in this zip code by the number of employees in 2005:
Accommodation and Food Services: Full-Service Restaurants (50-99 employees: 6 establishments, 20-49 employees: 7 establishments, 10-19 employees: 1 establishment, 5-9 employees: 2 establishments, 1-4 employees: 1 establishment)Finance and Insurance: Commercial Banking (250-499: 1, 50-99: 1, 10-19: 3, 5-9: 2, 1-4: 2)Health Care and Social Assistance: Offices of Physicians (except Mental Health Specialists) (50-99: 1, 20-49: 2, 10-19: 12, 5-9: 17, 1-4: 20)Health Care and Social Assistance: Services for the Elderly and Persons with Disabilities (250-499: 1, 50-99: 1, 10-19: 2, 5-9: 1, 1-4: 2)Accommodation and Food Services: Limited-Service Restaurants (50-99: 1, 20-49: 7, 10-19: 3, 5-9: 5, 1-4: 3)Health Care and Social Assistance: Nursing Care Facilities (100-249: 1, 50-99: 1, 20-49: 1)
People in group quarters in 2010:
216 people in nursing facilities/skilled-nursing facilities
22 people in hospitals with patients who have no usual home elsewhere
19 people in group homes intended for adults
3 people in group homes for juveniles (non-correctional)
2 people in workers' group living quarters and job corps centers
2 people in other noninstitutional facilities
People in group quarters in 2000:
261 people in nursing homes
59 people in other noninstitutional group quarters
29 people in homes for the mentally retarded
2 people in other nonhousehold living situations
Fatal accident statistics in 2014:
Fatal accident count: 1Vehicles involved in fatal accidents: 1Fatal accidents caused by drunken drivers: 0Fatalities: 1Persons involved in fatal accidents: 1Pedestrians involved in fatal accidents: 1
Fatal accident statistics in 2011:
Fatal accident count: 1Vehicles involved in fatal accidents: 2Fatal accidents caused by drunken drivers: 0Fatalities: 1Persons involved in fatal accidents: 2Pedestrians involved in fatal accidents: 0
Home Mortgage Disclosure Act Aggregated Statistics For Year 2009(Based on 12 partial tracts) A) FHA, FSA/RHS & VA B) Conventional C) Refinancings D) Home Improvement Loans E) Loans on Dwellings For 5+ Families F) Non-occupant Loans on G) Loans On Manufactured Number Average Value Number Average Value Number Average Value Number Average Value Number Average Value Number Average Value Number Average Value
LOANS ORIGINATED 55 $104,543 109 $120,586 267 $135,700 50 $44,637 1 $310,530 9 $63,081 3 $73,800 APPLICATIONS APPROVED, NOT ACCEPTED 0 $0 4 $152,878 24 $106,288 12 $43,412 0 $0 1 $105,260 1 $97,370 APPLICATIONS DENIED 2 $151,495 9 $121,267 120 $131,174 21 $36,491 0 $0 9 $64,208 4 $74,298 APPLICATIONS WITHDRAWN 3 $68,237 5 $219,880 65 $141,221 1 $12,740 0 $0 0 $0 3 $58,087 FILES CLOSED FOR INCOMPLETENESS 0 $0 1 $112,310 15 $191,651 3 $48,650 0 $0 0 $0 0 $0
Aggregated Statistics For Year 2008(Based on 12 partial tracts) A) FHA, FSA/RHS & VA B) Conventional C) Refinancings D) Home Improvement Loans E) Loans on Dwellings For 5+ Families F) Non-occupant Loans on G) Loans On Manufactured Number Average Value Number Average Value Number Average Value Number Average Value Number Average Value Number Average Value Number Average Value
LOANS ORIGINATED 34 $105,887 126 $141,414 154 $104,915 78 $29,588 0 $0 13 $73,579 2 $35,365 APPLICATIONS APPROVED, NOT ACCEPTED 0 $0 12 $79,913 36 $96,788 11 $55,061 1 $202,630 0 $0 0 $0 APPLICATIONS DENIED 7 $112,021 11 $73,146 198 $117,125 28 $65,629 0 $0 5 $46,028 1 $11,840 APPLICATIONS WITHDRAWN 6 $109,112 14 $109,006 61 $108,506 5 $79,374 0 $0 3 $150,950 1 $48,680 FILES CLOSED FOR INCOMPLETENESS 1 $147,040 1 $219,980 13 $135,328 0 $0 0 $0 1 $103,950 1 $208,400
Aggregated Statistics For Year 2007(Based on 12 partial tracts) A) FHA, FSA/RHS & VA B) Conventional C) Refinancings D) Home Improvement Loans E) Loans on Dwellings For 5+ Families F) Non-occupant Loans on G) Loans On Manufactured Number Average Value Number Average Value Number Average Value Number Average Value Number Average Value Number Average Value Number Average Value
LOANS ORIGINATED 28 $107,302 235 $106,213 251 $92,404 116 $34,873 1 $268,420 37 $71,706 7 $35,904 APPLICATIONS APPROVED, NOT ACCEPTED 0 $0 14 $67,631 70 $93,889 18 $45,775 0 $0 7 $54,439 1 $75,120 APPLICATIONS DENIED 3 $157,440 36 $84,788 273 $119,305 68 $44,638 0 $0 19 $84,534 5 $15,792 APPLICATIONS WITHDRAWN 2 $298,710 23 $105,899 80 $134,896 16 $36,671 0 $0 6 $60,350 0 $0 FILES CLOSED FOR INCOMPLETENESS 0 $0 1 $99,570 21 $141,268 3 $12,707 0 $0 0 $0 0 $0
Aggregated Statistics For Year 2006(Based on 12 partial tracts) A) FHA, FSA/RHS & VA B) Conventional C) Refinancings D) Home Improvement Loans F) Non-occupant Loans on G) Loans On Manufactured Number Average Value Number Average Value Number Average Value Number Average Value Number Average Value Number Average Value
LOANS ORIGINATED 21 $116,266 242 $119,266 298 $80,495 133 $37,577 30 $58,120 8 $24,818 APPLICATIONS APPROVED, NOT ACCEPTED 0 $0 25 $93,827 67 $95,788 13 $23,510 2 $48,815 0 $0 APPLICATIONS DENIED 1 $121,030 52 $96,200 221 $102,043 64 $37,333 10 $78,994 5 $36,630 APPLICATIONS WITHDRAWN 1 $136,840 33 $90,861 139 $123,817 11 $58,433 2 $111,605 0 $0 FILES CLOSED FOR INCOMPLETENESS 0 $0 9 $82,029 33 $138,508 1 $31,300 2 $161,515 0 $0
Aggregated Statistics For Year 2005(Based on 12 partial tracts) A) FHA, FSA/RHS & VA B) Conventional C) Refinancings D) Home Improvement Loans E) Loans on Dwellings For 5+ Families F) Non-occupant Loans on G) Loans On Manufactured Number Average Value Number Average Value Number Average Value Number Average Value Number Average Value Number Average Value Number Average Value
LOANS ORIGINATED 21 $97,070 293 $112,134 348 $93,369 119 $54,271 4 $126,382 26 $75,035 9 $70,153 APPLICATIONS APPROVED, NOT ACCEPTED 1 $87,990 29 $81,849 75 $96,203 14 $51,446 0 $0 7 $54,239 1 $15,050 APPLICATIONS DENIED 1 $159,210 42 $102,830 264 $102,530 70 $33,965 0 $0 17 $26,592 11 $63,017 APPLICATIONS WITHDRAWN 1 $106,580 31 $110,348 146 $124,961 35 $123,431 0 $0 7 $49,213 0 $0 FILES CLOSED FOR INCOMPLETENESS 1 $123,690 5 $138,570 40 $127,809 1 $138,940 0 $0 0 $0 0 $0
Aggregated Statistics For Year 2004(Based on 12 partial tracts) A) FHA, FSA/RHS & VA B) Conventional C) Refinancings D) Home Improvement Loans E) Loans on Dwellings For 5+ Families F) Non-occupant Loans on G) Loans On Manufactured Number Average Value Number Average Value Number Average Value Number Average Value Number Average Value Number Average Value Number Average Value
LOANS ORIGINATED 20 $103,246 224 $114,476 377 $94,254 99 $27,850 1 $230,260 33 $61,115 0 $0 APPLICATIONS APPROVED, NOT ACCEPTED 1 $103,040 16 $118,650 85 $101,836 13 $25,305 0 $0 3 $63,940 1 $7,380 APPLICATIONS DENIED 2 $137,730 41 $98,334 256 $88,873 57 $34,414 1 $626,040 17 $30,695 5 $13,646 APPLICATIONS WITHDRAWN 1 $155,260 23 $118,616 150 $113,280 11 $63,413 1 $127,630 4 $38,202 0 $0 FILES CLOSED FOR INCOMPLETENESS 0 $0 3 $81,353 38 $118,162 5 $63,676 0 $0 1 $122,080 0 $0
Aggregated Statistics For Year 2003(Based on 12 partial tracts) A) FHA, FSA/RHS & VA B) Conventional C) Refinancings D) Home Improvement Loans E) Loans on Dwellings For 5+ Families F) Non-occupant Loans on Number Average Value Number Average Value Number Average Value Number Average Value Number Average Value Number Average Value
LOANS ORIGINATED 27 $98,989 265 $120,999 916 $97,603 120 $42,904 1 $9,421,130 29 $182,147 APPLICATIONS APPROVED, NOT ACCEPTED 1 $111,150 27 $107,960 152 $97,538 22 $41,774 0 $0 1 $118,100 APPLICATIONS DENIED 1 $309,130 46 $94,926 319 $127,951 41 $22,187 0 $0 16 $73,092 APPLICATIONS WITHDRAWN 2 $132,185 26 $100,074 135 $160,015 6 $42,222 0 $0 3 $52,193 FILES CLOSED FOR INCOMPLETENESS 0 $0 10 $81,199 17 $200,953 1 $23,160 0 $0 0 $0
Aggregated Statistics For Year 2002(Based on 12 partial tracts) A) FHA, FSA/RHS & VA B) Conventional C) Refinancings D) Home Improvement Loans F) Non-occupant Loans on Number Average Value Number Average Value Number Average Value Number Average Value Number Average Value
LOANS ORIGINATED 21 $88,504 222 $99,914 616 $102,523 88 $33,223 19 $80,891 APPLICATIONS APPROVED, NOT ACCEPTED 4 $79,460 28 $71,462 99 $119,795 18 $34,386 3 $98,813 APPLICATIONS DENIED 2 $123,340 38 $96,699 230 $88,421 28 $23,617 6 $78,545 APPLICATIONS WITHDRAWN 0 $0 12 $119,911 88 $91,988 11 $43,986 3 $64,473 FILES CLOSED FOR INCOMPLETENESS 1 $87,650 5 $89,216 26 $77,880 0 $0 0 $0
Aggregated Statistics For Year 2001(Based on 12 partial tracts) A) FHA, FSA/RHS & VA B) Conventional C) Refinancings D) Home Improvement Loans F) Non-occupant Loans on Number Average Value Number Average Value Number Average Value Number Average Value Number Average Value
LOANS ORIGINATED 14 $85,739 220 $97,918 556 $87,984 97 $28,069 12 $70,322 APPLICATIONS APPROVED, NOT ACCEPTED 0 $0 20 $75,775 118 $67,807 15 $25,541 0 $0 APPLICATIONS DENIED 1 $219,920 48 $49,304 195 $78,305 35 $31,665 6 $121,387 APPLICATIONS WITHDRAWN 2 $63,335 11 $86,844 100 $77,750 12 $30,468 1 $46,050 FILES CLOSED FOR INCOMPLETENESS 0 $0 1 $210,720 24 $123,719 1 $59,040 0 $0
Aggregated Statistics For Year 2000(Based on 12 partial tracts) A) FHA, FSA/RHS & VA B) Conventional C) Refinancings D) Home Improvement Loans F) Non-occupant Loans on Number Average Value Number Average Value Number Average Value Number Average Value Number Average Value
LOANS ORIGINATED 24 $72,885 238 $84,705 217 $68,347 105 $21,614 17 $48,215 APPLICATIONS APPROVED, NOT ACCEPTED 1 $121,030 23 $62,270 83 $62,615 27 $19,208 6 $54,543 APPLICATIONS DENIED 3 $64,037 35 $42,538 157 $69,528 51 $21,139 7 $61,076 APPLICATIONS WITHDRAWN 1 $100,170 12 $86,191 74 $71,894 13 $34,127 3 $34,370 FILES CLOSED FOR INCOMPLETENESS 0 $0 11 $32,190 11 $138,007 1 $169,740 0 $0
Aggregated Statistics For Year 1999(Based on 6 partial tracts) A) FHA, FSA/RHS & VA B) Conventional C) Refinancings D) Home Improvement Loans E) Loans on Dwellings For 5+ Families F) Non-occupant Loans on Number Average Value Number Average Value Number Average Value Number Average Value Number Average Value Number Average Value
LOANS ORIGINATED 12 $71,259 119 $97,807 139 $76,328 53 $23,907 1 $97,320 9 $64,830 APPLICATIONS APPROVED, NOT ACCEPTED 1 $10,960 16 $57,569 65 $61,051 20 $25,044 0 $0 3 $32,003 APPLICATIONS DENIED 1 $80,970 23 $46,190 84 $74,784 20 $26,958 0 $0 1 $5,770 APPLICATIONS WITHDRAWN 0 $0 11 $75,959 41 $68,362 3 $40,590 0 $0 1 $56,970 FILES CLOSED FOR INCOMPLETENESS 0 $0 4 $80,328 17 $87,386 0 $0 0 $0 2 $39,815
Private Mortgage Insurance Companies Aggregated Statistics For Year 2009(Based on 12 partial tracts) A) Conventional B) Refinancings Number Average Value Number Average Value
LOANS ORIGINATED 27 $136,333 5 $171,586 APPLICATIONS APPROVED, NOT ACCEPTED 4 $151,172 3 $211,407 APPLICATIONS DENIED 6 $235,470 6 $219,818 APPLICATIONS WITHDRAWN 0 $0 1 $143,570 FILES CLOSED FOR INCOMPLETENESS 0 $0 0 $0
Aggregated Statistics For Year 2007(Based on 12 partial tracts) A) Conventional B) Refinancings C) Non-occupant Loans on Number Average Value Number Average Value Number Average Value
LOANS ORIGINATED 49 $102,773 31 $124,567 11 $70,459 APPLICATIONS APPROVED, NOT ACCEPTED 4 $184,048 6 $147,593 0 $0 APPLICATIONS DENIED 0 $0 1 $111,640 0 $0 APPLICATIONS WITHDRAWN 0 $0 3 $85,730 0 $0 FILES CLOSED FOR INCOMPLETENESS 0 $0 0 $0 0 $0
Aggregated Statistics For Year 2006(Based on 12 partial tracts) A) Conventional B) Refinancings C) Non-occupant Loans on Number Average Value Number Average Value Number Average Value
LOANS ORIGINATED 45 $112,246 19 $116,971 1 $83,360 APPLICATIONS APPROVED, NOT ACCEPTED 2 $193,255 2 $122,470 0 $0 APPLICATIONS DENIED 0 $0 0 $0 0 $0 APPLICATIONS WITHDRAWN 0 $0 0 $0 0 $0 FILES CLOSED FOR INCOMPLETENESS 0 $0 0 $0 0 $0
Aggregated Statistics For Year 2005(Based on 12 partial tracts) A) Conventional B) Refinancings C) Non-occupant Loans on Number Average Value Number Average Value Number Average Value
LOANS ORIGINATED 58 $111,523 14 $175,224 3 $50,067 APPLICATIONS APPROVED, NOT ACCEPTED 4 $164,352 3 $250,470 0 $0 APPLICATIONS DENIED 0 $0 0 $0 0 $0 APPLICATIONS WITHDRAWN 1 $117,900 0 $0 0 $0 FILES CLOSED FOR INCOMPLETENESS 0 $0 0 $0 0 $0
Aggregated Statistics For Year 2004(Based on 12 partial tracts) A) Conventional B) Refinancings C) Non-occupant Loans on Number Average Value Number Average Value Number Average Value
LOANS ORIGINATED 59 $122,088 33 $147,248 3 $64,623 APPLICATIONS APPROVED, NOT ACCEPTED 9 $107,880 7 $142,946 1 $131,580 APPLICATIONS DENIED 2 $433,535 0 $0 0 $0 APPLICATIONS WITHDRAWN 0 $0 1 $101,320 0 $0 FILES CLOSED FOR INCOMPLETENESS 0 $0 0 $0 0 $0
Aggregated Statistics For Year 2003(Based on 12 partial tracts) A) Conventional B) Refinancings C) Non-occupant Loans on Number Average Value Number Average Value Number Average Value
LOANS ORIGINATED 67 $121,873 50 $124,476 2 $57,865 APPLICATIONS APPROVED, NOT ACCEPTED 9 $135,922 9 $109,057 1 $88,160 APPLICATIONS DENIED 1 $170,200 0 $0 1 $170,200 APPLICATIONS WITHDRAWN 1 $200,330 1 $90,790 1 $90,790 FILES CLOSED FOR INCOMPLETENESS 0 $0 0 $0 0 $0
Aggregated Statistics For Year 2002(Based on 12 partial tracts) A) Conventional B) Refinancings C) Non-occupant Loans on Number Average Value Number Average Value Number Average Value
LOANS ORIGINATED 70 $114,076 44 $116,344 6 $63,603 APPLICATIONS APPROVED, NOT ACCEPTED 8 $98,649 16 $115,849 0 $0 APPLICATIONS DENIED 1 $73,800 2 $112,305 0 $0 APPLICATIONS WITHDRAWN 0 $0 0 $0 0 $0 FILES CLOSED FOR INCOMPLETENESS 0 $0 0 $0 0 $0
Aggregated Statistics For Year 2001(Based on 12 partial tracts) A) Conventional B) Refinancings Number Average Value Number Average Value
LOANS ORIGINATED 70 $104,195 34 $128,479 APPLICATIONS APPROVED, NOT ACCEPTED 13 $104,048 10 $113,428 APPLICATIONS DENIED 0 $0 2 $72,515 APPLICATIONS WITHDRAWN 0 $0 0 $0 FILES CLOSED FOR INCOMPLETENESS 0 $0 0 $0
Aggregated Statistics For Year 2000(Based on 12 partial tracts) A) Conventional B) Refinancings C) Non-occupant Loans on Number Average Value Number Average Value Number Average Value
LOANS ORIGINATED 72 $92,505 6 $93,105 1 $83,360 APPLICATIONS APPROVED, NOT ACCEPTED 5 $131,062 3 $78,510 0 $0 APPLICATIONS DENIED 1 $92,620 0 $0 0 $0 APPLICATIONS WITHDRAWN 0 $0 0 $0 0 $0 FILES CLOSED FOR INCOMPLETENESS 1 $173,670 0 $0 0 $0
Aggregated Statistics For Year 1999(Based on 6 partial tracts) A) Conventional B) Refinancings C) Non-occupant Loans on Number Average Value Number Average Value Number Average Value
LOANS ORIGINATED 24 $77,569 12 $94,038 1 $46,030 APPLICATIONS APPROVED, NOT ACCEPTED 3 $69,273 3 $81,467 0 $0 APPLICATIONS DENIED 1 $74,380 1 $78,420 0 $0 APPLICATIONS WITHDRAWN 0 $0 0 $0 0 $0 FILES CLOSED FOR INCOMPLETENESS 1 $72,600 0 $0 0 $0
2003 - 2018 National Fire Incident Reporting System (NFIRS) incidents See full 2006 National Fire Incident Reporting System statistics for zip code 16148, Pennsylvania
Most common first names in zip code 16148 among deceased individuals Name Count Lived (average)
Mary 181 83.6 years John 128 77.5 years William 104 75.8 years Joseph 96 78.3 years Helen 94 82.9 years Robert 82 73.3 years Margaret 70 82.4 years James 68 73.5 years George 66 75.1 years Anna 65 85.8 years
Most common last names in zip code 16148 among deceased individuals Last name Count Lived (average)
Smith 30 79.0 years Miller 30 77.4 years Williams 20 77.3 years Davis 13 79.0 years Thompson 12 77.2 years Johnson 11 72.5 years Adams 11 73.6 years Snyder 11 81.3 years Brown 11 78.4 years Wilson 10 75.9 years
Businesses in zip code 16148
Name Count Name Count
ALDI 1 Macy's 1 AT&T 1 Maurices 1 Advance Auto Parts 1 McDonald's 2 Aeropostale 1 Motherhood Maternity 1 American Eagle Outfitters 1 Nike 3 Applebee's 1 Nissan 1 Arby's 1 Panera Bread 1 AutoZone 1 Papa John's Pizza 1 Bath & Body Works 1 Payless 2 Burger King 2 Pizza Hut 1 Chevrolet 1 Quality 1 Circle K 1 RadioShack 1 Dairy Queen 2 Red Lobster 1 Dennys 1 Red Roof Inn 1 Dunkin Donuts 1 Rite Aid 1 Econo Lodge 1 Rue21 1 Fashion Bug 1 Sears 3 FedEx 4 Sprint Nextel 1 Firestone Complete Auto Care 1 Staples 1 Foot Locker 1 Starbucks 1 GNC 1 Subway 2 GameStop 2 T-Mobile 2 Goodwill 1 T.J.Maxx 1 H&R Block 2 Taco Bell 1 Home Depot 1 Toyota 1 Honda 1 Toys"R"Us 1 JCPenney 1 U-Haul 1 Jones New York 1 UPS 6 KFC 1 Verizon Wireless 1 Kmart 1 Walgreens 1 La-Z-Boy 1 Walmart 1 Lane Furniture 2 Wendy's 1 Little Caesars Pizza 1 YMCA 1 Lowe's 1
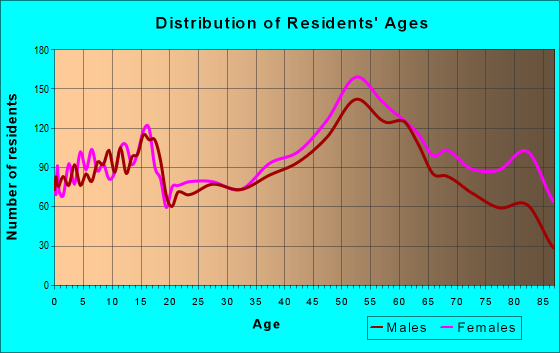
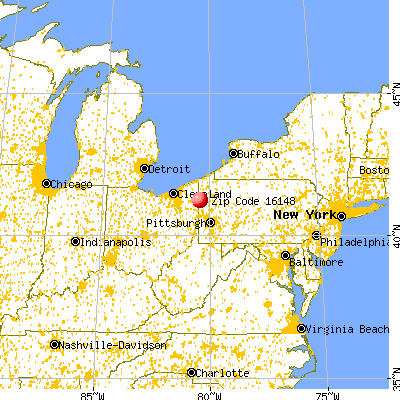


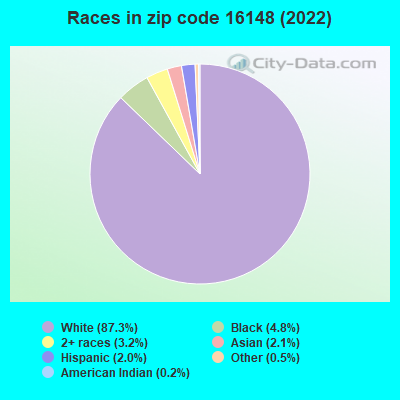


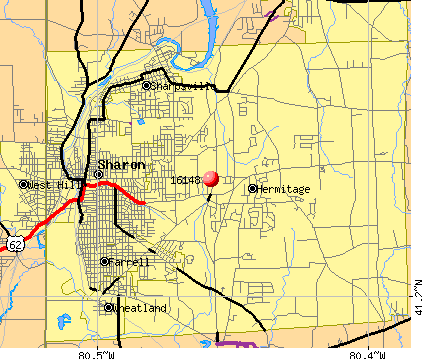 Nearest zip codes: 16113, 16150, 16121, 16146, 16161, 16159.
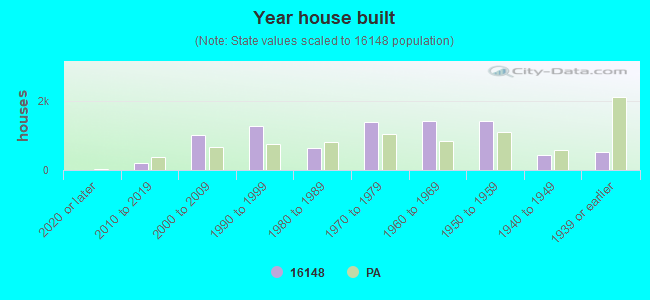
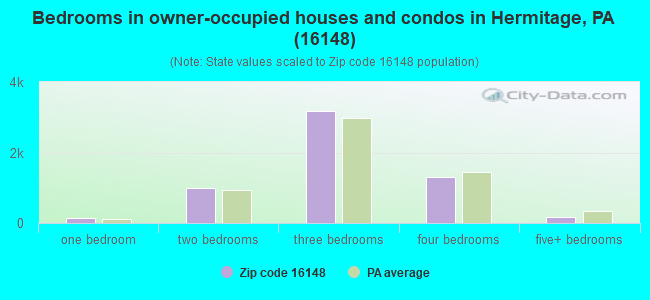
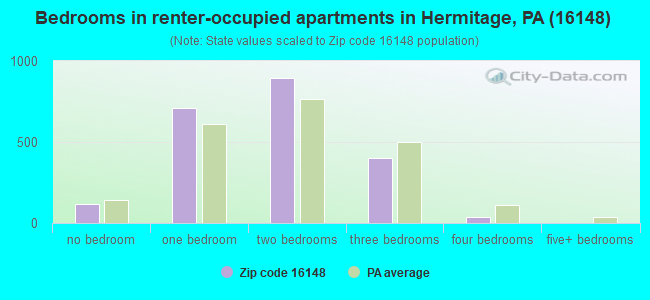
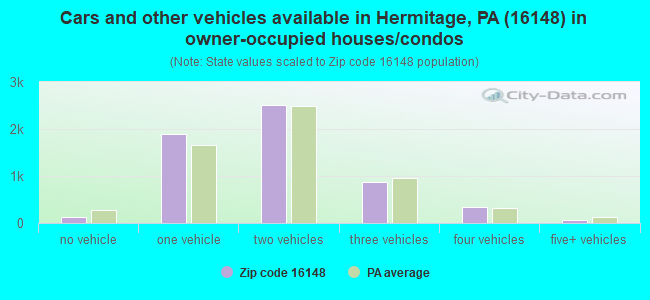
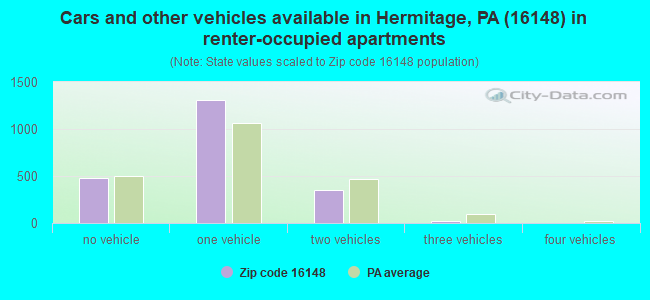


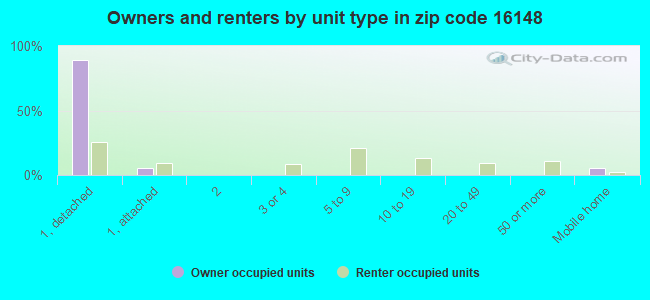
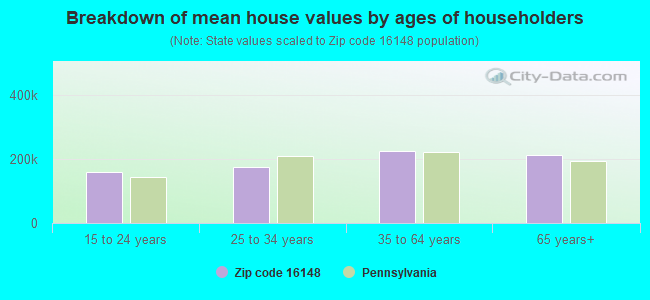


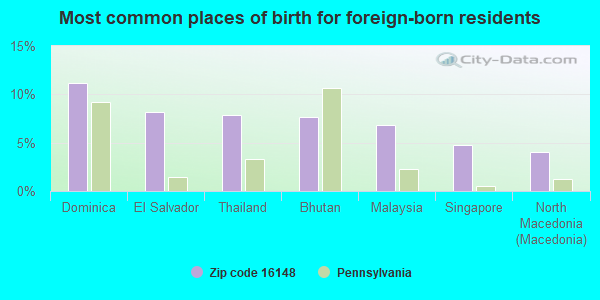
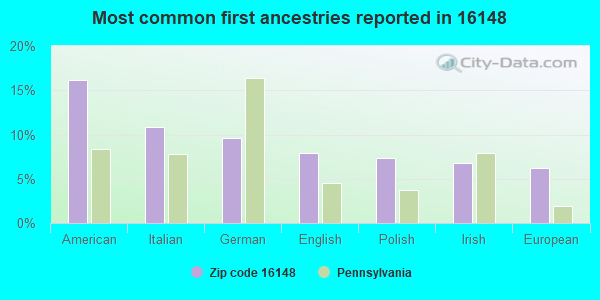
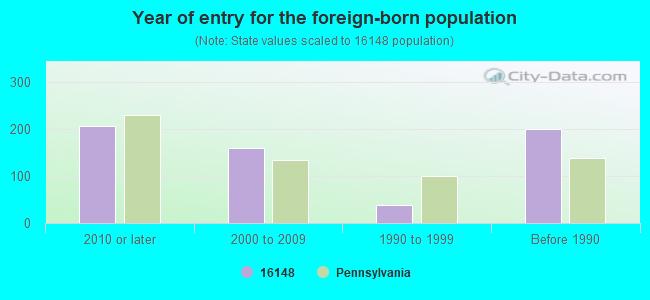


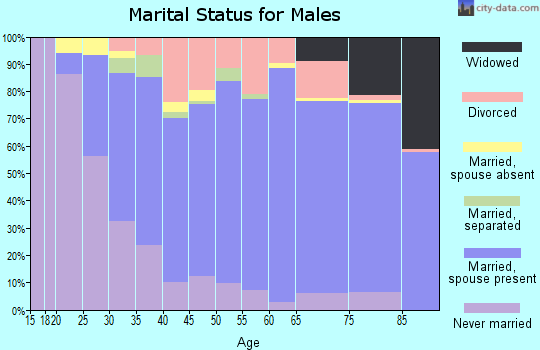
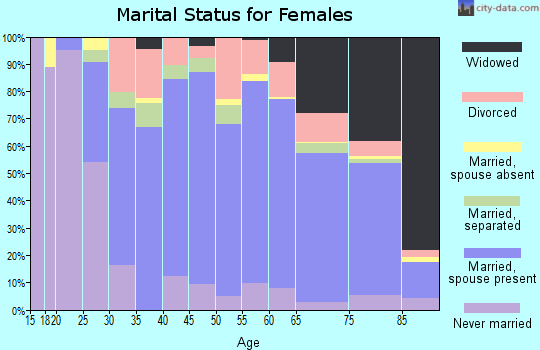
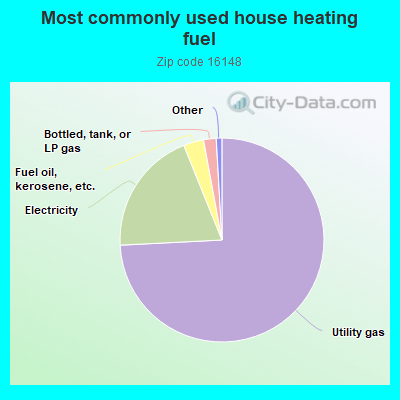
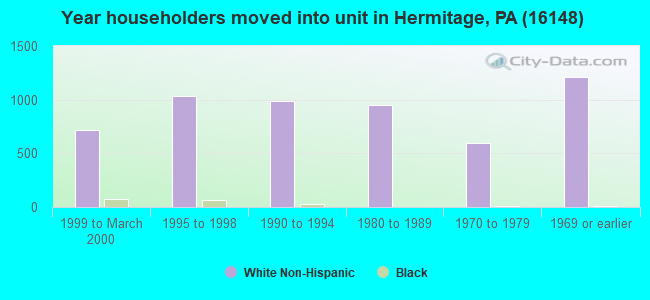
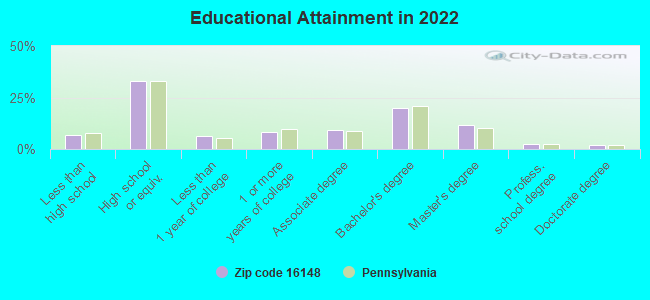
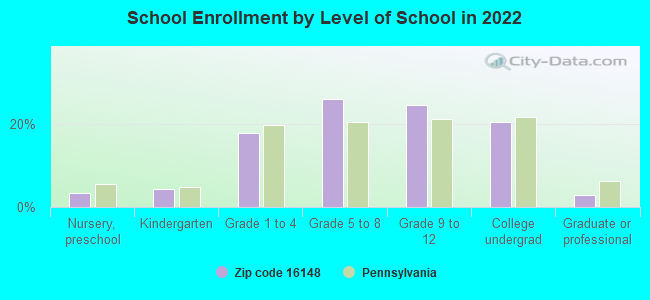
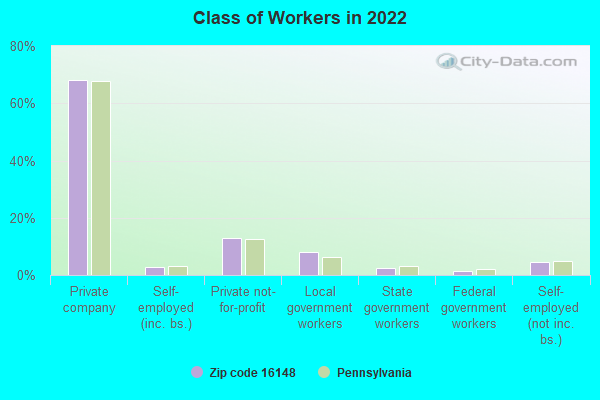
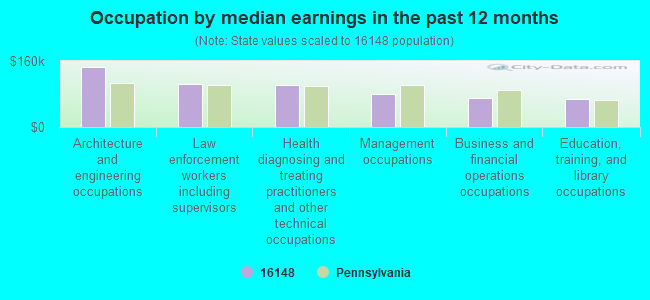
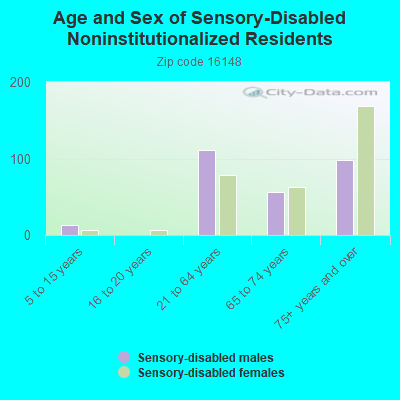
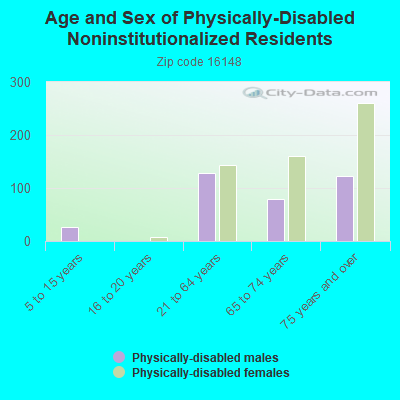
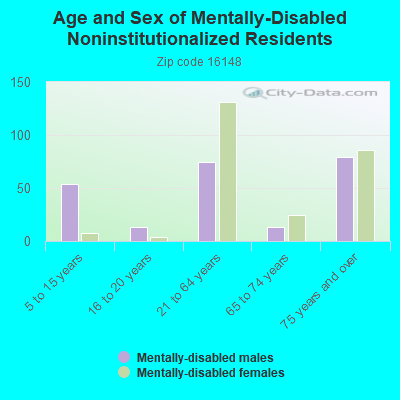
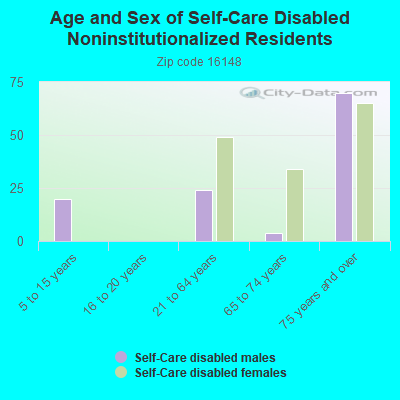
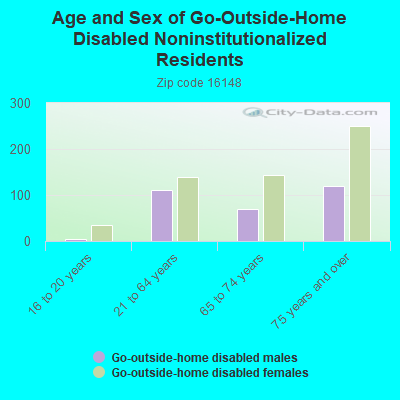
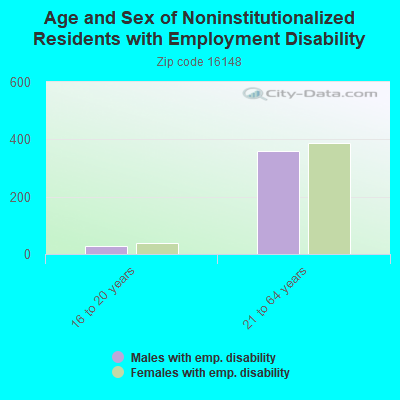
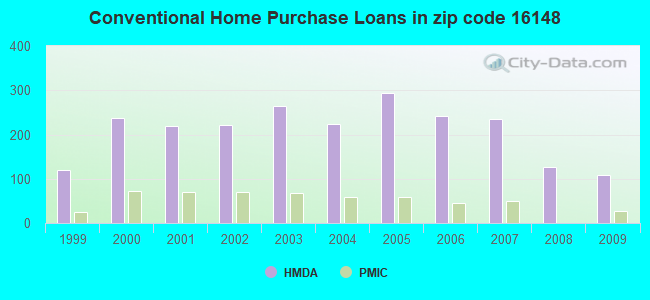
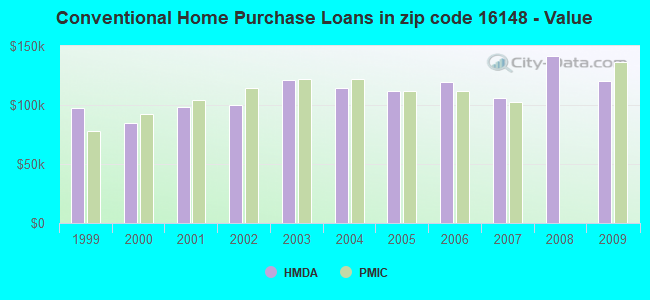
 According to the data from the years 2003 - 2018 the average number of fires per year is 14. The highest number of reported fires - 78 took place in 2017, and the least - 0 in 2004. The data has a growing trend.
 When looking into fire subcategories, the most incidents belonged to: Structure Fires (51.8%), and Outside Fires (31.8%).