Estimated zip code population in 2022: 3,361 Zip code population in 2010: 3,319 Zip code population in 2000: 3,243
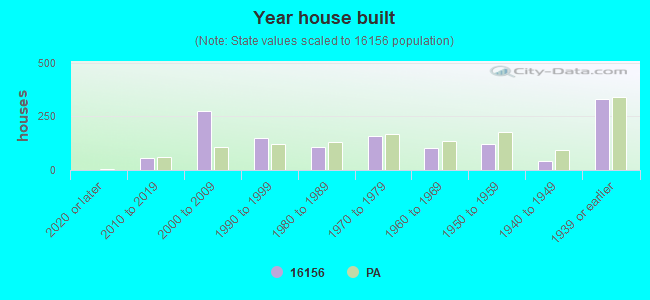
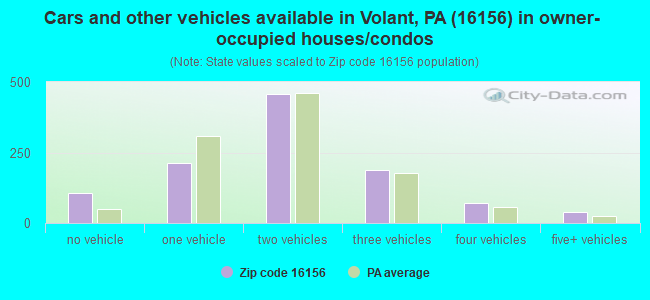
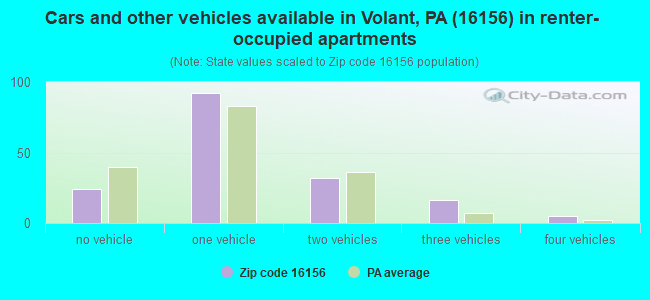
Houses and condos: 1,338 Renter-occupied apartments: 168
% of renters here:
14%
State:
31%
March 2022 cost of living index in zip code 16156: 92.8 (less than average, U.S. average is 100)
Land area: 49.8 sq. mi. Water area: 0.4 sq. mi.
Population density: 67 people per square mile
(very low).
OSM Map
General Map
Google Map
MSN Map
OSM Map
General Map
Google Map
MSN Map
OSM Map
General Map
Google Map
MSN Map
OSM Map
General Map
Google Map
MSN Map
Please wait while loading the map...
Real estate property taxes paid for housing units in 2022:
This zip code:
0.9% ($2,040)
Pennsylvania:
1.3% ($3,094)
Median real estate property taxes paid for housing units with mortgages in 2022: $2,165 (1.0%) Median real estate property taxes paid for housing units with no mortgage in 2022: $1,917 (0.9%)
Business Search- 14 Million verified businesses
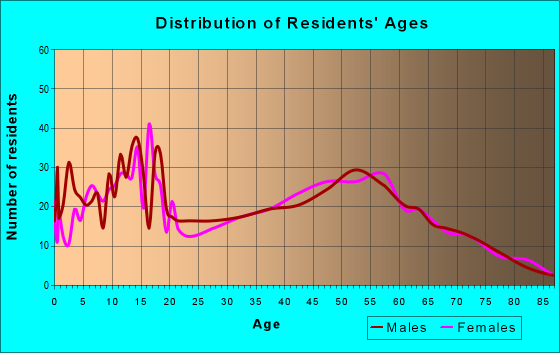
Males: 1,683
(50.1%)
Females: 1,678
(49.9%)
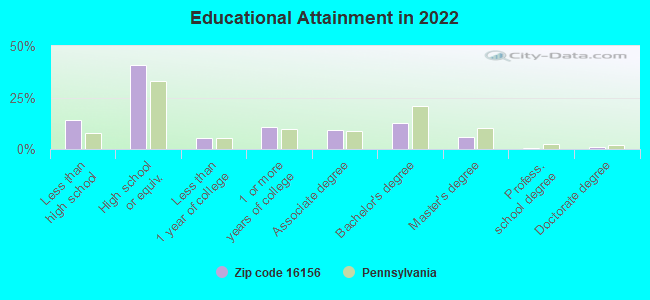
For population 25 years and over in 16156:
High school or higher: 84.5%
Bachelor's degree or higher: 19.6%
Graduate or professional degree: 7.3%
Unemployed: 4.0%
Mean travel time to work (commute): 25.7 minutes
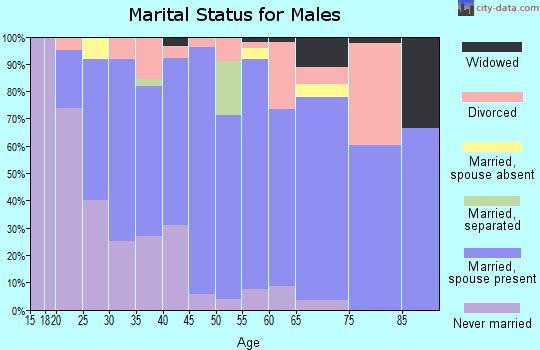
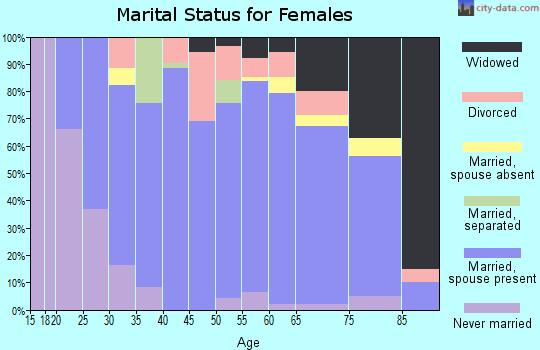
For population 15 years and over in 16156:
Never married: 26.2%
Now married: 59.3%
Separated: 0.9%
Widowed: 5.2%
Divorced: 8.3%
Zip code 16156 compared to state average:
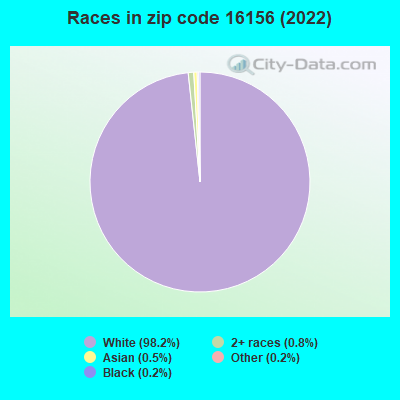
Black race population percentage significantly below state average.
Hispanic race population percentage significantly below state average.
Foreign-born population percentage significantly below state average.
Renting percentage significantly below state average.
Length of stay since moving in significantly above state average.
Number of college students below state average.
Percentage of population with a bachelor's degree or higher below state average.
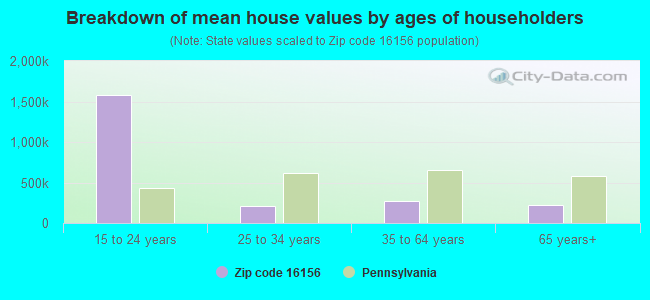
Estimated median house/condo value in 2022: $215,002
16156:
$215,002
Pennsylvania:
$245,500
According to our research of Pennsylvania and other state lists, there were 6 registered sex offenders living in 16156 zip code as of April 26, 2024. The ratio of all residents to sex offenders in zip code 16156 is 482 to 1. The ratio of registered sex offenders to all residents in this zip code is near the state average.
Median resident age:
This zip code:
40.2 years
Pennsylvania median age:
40.9 years
Average household size:
This zip code:
2.7 people
Pennsylvania:
2.4 people
Averages for the 2020 tax year for zip code 16156, filed in 2021:
Average Adjusted Gross Income (AGI) in 2020: $62,560 (Individual Income Tax Returns)
Here:
$62,560
State:
$75,707
Salary/wage: $53,651 (reported on 74.2% of returns)
Here:
$53,651
State:
$62,806
(% of AGI for various income ranges: 1184.6% for AGIs below $25k, 3520.8% for AGIs $25k-50k, 6311.9% for AGIs $50k-75k, 9390.0% for AGIs $75k-100k, 14994.3% for AGIs $100k-200k)
Taxable interest for individuals: $1,106 (reported on 34.2% of returns)
This zip code:
$1,106
Pennsylvania:
$1,633
(% of AGI for various income ranges: 24.6% for AGIs below $25k, 58.3% for AGIs $25k-50k, 42.5% for AGIs $50k-75k, 29.2% for AGIs $75k-100k, 61.4% for AGIs $100k-200k)
Ordinary dividends: $3,073 (reported on 23.9% of returns)
Here:
$3,073
State:
$7,382
(% of AGI for various income ranges: 48.9% for AGIs below $25k, 45.4% for AGIs $25k-50k, 68.8% for AGIs $50k-75k, 65.8% for AGIs $75k-100k, 290.0% for AGIs $100k-200k)
Net capital gain/loss in AGI: +$9,233 (reported on 19.4% of returns)
Here:
+$9,233
State:
+$23,522
(% of AGI for various income ranges: 25.4% for AGIs below $25k, 51.2% for AGIs $25k-50k, 100.0% for AGIs $50k-75k, 190.0% for AGIs $75k-100k, 630.0% for AGIs $100k-200k)
Profit/loss from business: +$16,816 (reported on 20.0% of returns)
Here:
+$16,816
State:
+$16,274
(% of AGI for various income ranges: 199.6% for AGIs below $25k, 593.3% for AGIs $25k-50k, 660.6% for AGIs $50k-75k, 586.7% for AGIs $75k-100k, 1049.3% for AGIs $100k-200k)
Taxable individual retirement arrangement distribution: $13,294 (reported on 11.0% of returns)
16156:
$13,294
Pennsylvania:
$18,583
(% of AGI for various income ranges: 97.9% for AGIs below $25k, 185.8% for AGIs $25k-50k, 170.0% for AGIs $50k-75k, 250.0% for AGIs $75k-100k, 691.4% for AGIs $100k-200k)
Total itemized deductions: $43,625 (reported on 2.6% of returns)
Here:
$43,625
State:
$34,850
(% of AGI for various income ranges: 1246.4% for AGIs $100k-200k)
Charity contributions: $19,967 (reported on 1.9% of returns)
Here:
$19,967
State:
$12,392
(% of AGI for various income ranges: 427.9% for AGIs $100k-200k)
Taxes paid: $8,775 (reported on 2.6% of returns)
16156:
$8,775
State:
$8,200
(% of AGI for various income ranges: 250.7% for AGIs $100k-200k)
Earned income credit: $2,383 (reported on 7.7% of returns)
Here:
$2,383
State:
$2,100
(% of AGI for various income ranges: 68.2% for AGIs below $25k, 39.6% for AGIs $25k-50k)
Percentage of individuals using paid preparers for their 2020 taxes: 89.0%
Here:
89%
State:
92%
(% for various income ranges: 87.8% for AGIs below $25k, 86.5% for AGIs $25k-50k, 87.5% for AGIs $50k-75k, 94.1% for AGIs $75k-100k, 91.3% for AGIs $100k-200k, 100.0% for AGIs over 200k)
Averages for the 2012 tax year for zip code 16156, filed in 2013:
Average Adjusted Gross Income (AGI) in 2012: $58,244 (Individual Income Tax Returns)
Here:
$58,244
State:
$61,346
Salary/wage: $43,704 (reported on 79.5% of returns)
Here:
$43,704
State:
$51,902
(% of AGI for various income ranges: 63.3% for AGIs below $25k, 69.8% for AGIs $25k-50k, 71.5% for AGIs $50k-75k, 69.0% for AGIs $75k-100k, 65.6% for AGIs $100k-200k, 32.4% for AGIs over 200k)
Taxable interest for individuals: $1,107 (reported on 39.1% of returns)
This zip code:
$1,107
Pennsylvania:
$1,588
(% of AGI for various income ranges: 1.6% for AGIs below $25k, 0.5% for AGIs $25k-50k, 0.4% for AGIs $50k-75k, 0.8% for AGIs $75k-100k, 0.4% for AGIs $100k-200k, 1.1% for AGIs over 200k)
Ordinary dividends: $2,894 (reported on 22.4% of returns)
Here:
$2,894
State:
$5,827
(% of AGI for various income ranges: 1.6% for AGIs below $25k, 0.5% for AGIs $25k-50k, 0.8% for AGIs $50k-75k, 0.5% for AGIs $75k-100k, 0.8% for AGIs $100k-200k, 2.2% for AGIs over 200k)
Net capital gain/loss in AGI: +$7,200 (reported on 14.1% of returns)
Here:
+$7,200
State:
+$14,495
(% of AGI for various income ranges: 0.8% for AGIs $25k-50k, 0.2% for AGIs $50k-75k, 1.5% for AGIs $75k-100k, 0.4% for AGIs $100k-200k, 5.4% for AGIs over 200k)
Profit/loss from business: +$13,993 (reported on 17.9% of returns)
Here:
+$13,993
State:
+$16,268
(% of AGI for various income ranges: 13.1% for AGIs below $25k, 5.9% for AGIs $25k-50k, 4.7% for AGIs $50k-75k, 4.1% for AGIs $75k-100k, 4.9% for AGIs $100k-200k)
Taxable individual retirement arrangement distribution: $9,429 (reported on 10.9% of returns)
16156:
$9,429
Pennsylvania:
$14,550
(% of AGI for various income ranges: 3.1% for AGIs below $25k, 3.7% for AGIs $25k-50k, 2.3% for AGIs $50k-75k, 0.6% for AGIs $75k-100k, 2.5% for AGIs $100k-200k)
Total itemized deductions: $20,269 (17% of AGI, reported on 22.4% of returns)
Here:
$20,269
State:
$23,538
Here:
16.6% of AGI
State:
18.4% of AGI
(% of AGI for various income ranges: 8.1% for AGIs below $25k, 5.0% for AGIs $25k-50k, 8.1% for AGIs $50k-75k, 8.9% for AGIs $75k-100k, 8.9% for AGIs $100k-200k, 7.3% for AGIs over 200k)
Charity contributions: $4,750 (reported on 17.9% of returns)
Here:
$4,750
State:
$4,025
(% of AGI for various income ranges: 0.9% for AGIs $25k-50k, 1.3% for AGIs $50k-75k, 1.1% for AGIs $75k-100k, 2.0% for AGIs $100k-200k, 2.0% for AGIs over 200k)
Taxes paid: $7,389 (reported on 22.4% of returns)
16156:
$7,389
State:
$9,982
(% of AGI for various income ranges: 1.1% for AGIs below $25k, 1.4% for AGIs $25k-50k, 2.2% for AGIs $50k-75k, 3.2% for AGIs $75k-100k, 3.7% for AGIs $100k-200k, 3.6% for AGIs over 200k)
Earned income credit: $1,794 (reported on 11.5% of returns)
Here:
$1,794
State:
$2,106
(% of AGI for various income ranges: 3.4% for AGIs below $25k, 0.9% for AGIs $25k-50k)
Percentage of individuals using paid preparers for their 2012 taxes: 59.0%
Here:
59%
State:
53%
(% for various income ranges: 55.2% for AGIs below $25k, 55.9% for AGIs $25k-50k, 64.0% for AGIs $50k-75k, 58.8% for AGIs $75k-100k, 62.5% for AGIs $100k-200k, 83.3% for AGIs over 200k)
Averages for the 2004 tax year for zip code 16156, filed in 2005:
Average Adjusted Gross Income (AGI) in 2004: $39,022 (Individual Income Tax Returns)
Here:
$39,022
State:
$48,049
Salary/wage: $35,204 (reported on 80.7% of returns)
Here:
$35,204
State:
$42,646
(% of AGI for various income ranges: 122.3% for AGIs below $10k, 64.2% for AGIs $10k-25k, 74.9% for AGIs $25k-50k, 81.3% for AGIs $50k-75k, 79.9% for AGIs $75k-100k, 58.1% for AGIs over 100k)
Taxable interest for individuals: $1,566 (reported on 52.8% of returns)
This zip code:
$1,566
Pennsylvania:
$1,657
(% of AGI for various income ranges: 11.4% for AGIs below $10k, 2.6% for AGIs $10k-25k, 1.9% for AGIs $25k-50k, 1.1% for AGIs $50k-75k, 1.2% for AGIs $75k-100k, 3.2% for AGIs over 100k)
Taxable dividends: $1,856 (reported on 25.1% of returns)
Here:
$1,856
State:
$3,566
(% of AGI for various income ranges: 3.4% for AGIs below $10k, 1.2% for AGIs $10k-25k, 0.8% for AGIs $25k-50k, 0.4% for AGIs $50k-75k, 1.0% for AGIs $75k-100k, 2.5% for AGIs over 100k)
Net capital gain/loss: +$5,304 (reported on 19.9% of returns)
Here:
+$5,304
State:
+$9,716
(% of AGI for various income ranges: 1.1% for AGIs below $10k, 1.3% for AGIs $10k-25k, 1.4% for AGIs $25k-50k, 1.9% for AGIs $50k-75k, 2.8% for AGIs $75k-100k, 5.7% for AGIs over 100k)
Profit/loss from business: +$8,415 (reported on 20.4% of returns)
Here:
+$8,415
State:
+$14,267
(% of AGI for various income ranges: 11.5% for AGIs below $10k, 12.0% for AGIs $10k-25k, 6.9% for AGIs $25k-50k, 3.5% for AGIs $50k-75k, 1.8% for AGIs $75k-100k, 0.3% for AGIs over 100k)
IRA payment deduction: $2,489 (reported on 3.1% of returns)
16156:
$2,489
Pennsylvania:
$2,903
Total itemized deductions: $15,412 (19% of AGI, reported on 21.9% of returns)
Here:
$15,412
State:
$18,804
Here:
18.5% of AGI
State:
19.5% of AGI
(% of AGI for various income ranges: 8.4% for AGIs $10k-25k, 5.4% for AGIs $25k-50k, 9.5% for AGIs $50k-75k, 11.4% for AGIs $75k-100k, 9.9% for AGIs over 100k)
Charity contributions deductions: $3,309 (4% of AGI, reported on 18.3% of returns)
Here:
$3,309
State:
$3,337
Here:
3.7% of AGI
State:
3.3% of AGI
(% of AGI for various income ranges: 0.8% for AGIs $10k-25k, 0.9% for AGIs $25k-50k, 1.6% for AGIs $50k-75k, 1.6% for AGIs $75k-100k, 2.6% for AGIs over 100k)
Total tax: $5,953 (reported on 72.0% of returns)
16156:
$5,953
State:
$8,008
(% of AGI for various income ranges: 4.2% for AGIs below $10k, 4.0% for AGIs $10k-25k, 6.9% for AGIs $25k-50k, 8.7% for AGIs $50k-75k, 10.5% for AGIs $75k-100k, 22.0% for AGIs over 100k)
Earned income credit: $1,513 (reported on 12.6% of returns)
Here:
$1,513
State:
$1,643
Percentage of individuals using paid preparers for their 2004 taxes: 59.9%
Here:
60%
State:
56%
(% for various income ranges: 54.2% for AGIs below $10k, 60.8% for AGIs $10k-25k, 60.7% for AGIs $25k-50k, 61.1% for AGIs $50k-75k, 59.6% for AGIs $75k-100k, 73.3% for AGIs over 100k)
Likely homosexual households (counted as self-reported same-sex unmarried-partner households)
Lesbian couples: 0.1% of all households
Gay men: 0.0% of all households
Household received Food Stamps/SNAP in the past 12 months: 114 Household did not receive Food Stamps/SNAP in the past 12 months: 1,131
Women who had a birth in the past 12 months: 22 (20 now married, 2 unmarried) Women who did not have a birth in the past 12 months: 581 (279 now married, 300 unmarried)
Housing units in zip code 16156 with a mortgage: 486 (88 second mortgage, 78 both second mortgage and home equity loan) Houses without a mortgage: 29
Median monthly owner costs for units with a mortgage: $1,402 Median monthly owner costs for units without a mortgage: $437
Residents with income below the poverty level in 2022:
This zip code:
14.2%
Whole state:
11.8%
Residents with income below 50% of the poverty level in 2022:
This zip code:
5.2%
Whole state:
6.1%
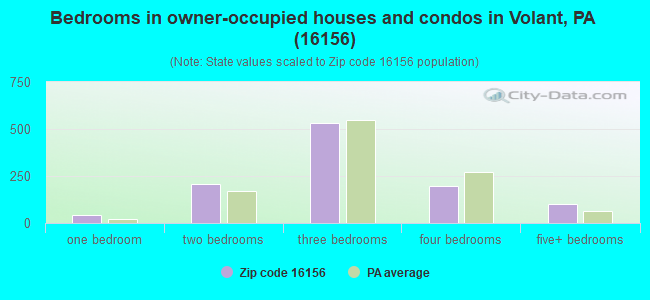
Median number of rooms in houses and condos:
Here:
6.5
State:
6.8
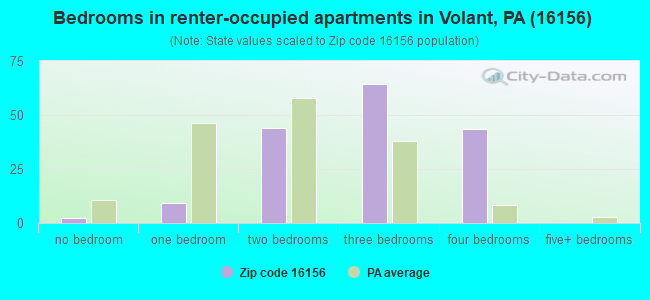
Median number of rooms in apartments:
Here:
6.2
State:
4.3
Notable locations in this zip code not listed on our city pages
Notable locations in zip code 16156: Green Meadows Golf Course (A), Fayette Chapel (B), Volant Volunteer Fire Company (C). Display/hide their locations on the map
786 married couples with children.
149 single-parent households (34 men, 115 women).
81.9% of residents of 16156 zip code speak English at home.
17.2% of residents speak other Indo-European language at home (68% very well, 32% well).
0.8% of residents speak Asian or Pacific Island language at home (71% very well, 29% well).
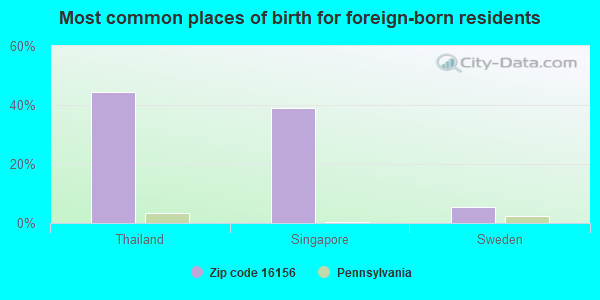
Foreign born population: 18 (0.6%) (89.3% of them are naturalized citizens)
This zip code:
0.6%
Whole state:
7.5%
44%Thailand
39%Singapore
6%Sweden
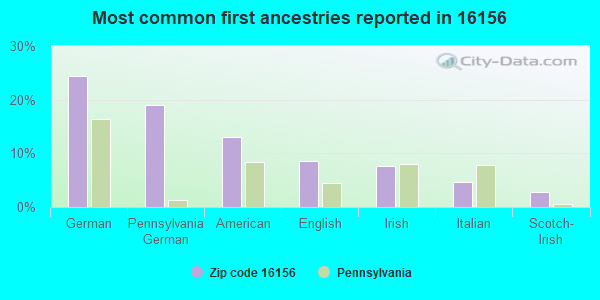
24%German
19%Pennsylvania German
13%American
9%English
8%Irish
5%Italian
3%Scotch-Irish
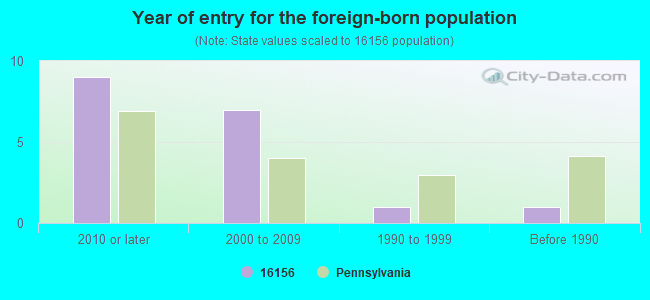
Year of entry for the foreign-born population
92010 or later
72000 to 2009
11990 to 1999
1Before 1990
Housing units lacking complete plumbing facilities: 11.0% Housing units lacking complete kitchen facilities: 9.4%
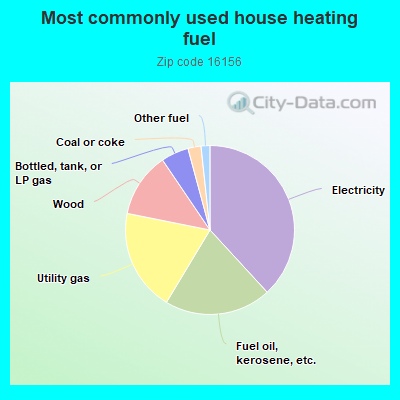
38.3%Electricity
20.5%Fuel oil, kerosene, etc.
19.6%Utility gas
12.4%Wood
5.3%Bottled, tank, or LP gas
2.5%Coal or coke
1.7%Other fuel
Population in 1990: 2,114. Population change in the 1990s: +1,129 (+53.4%).
Place of birth for U.S.-born residents:
This state: 2,977
Northeast: 70
Midwest: 177
South: 56
West: 36
75% of the 16156 zip code residents lived in the same house 5 years ago. Out of people who lived in different houses, 60% lived in this county. Out of people who lived in different counties, 50% lived in Pennsylvania.
96% of the 16156 zip code residents lived in the same house 1 year ago. Out of people who lived in different houses, 21% moved from this county. Out of people who lived in different houses, 73% moved from different county within same state. Out of people who lived in different houses, 12% moved from different state.
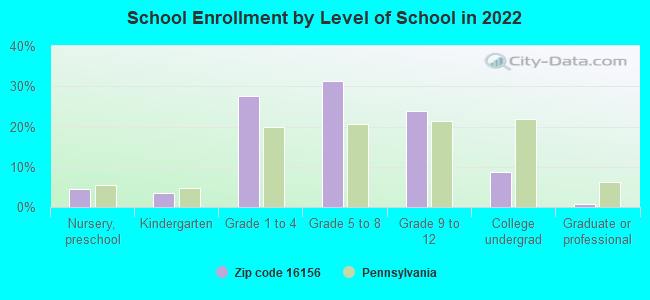
Private vs. public school enrollment:
Students in private schools in grades 1 to 8 (elementary and middle school): 195
Here:
41.0%
Pennsylvania:
15.7%
Students in private schools in grades 9 to 12 (high school): 2
Here:
1.1%
Pennsylvania:
13.4%
Students in private undergraduate colleges: 11
Here:
15.7%
Pennsylvania:
39.8%
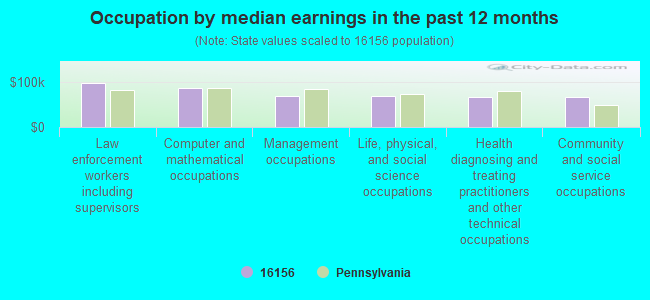
Occupation by median earnings in the past 12 months ($)
98,005Law enforcement workers including supervisors
87,570Computer and mathematical occupations
68,958Management occupations
68,914Life, physical, and social science occupations
67,845Health diagnosing and treating practitioners and other technical occupations
67,020Community and social service occupations
Top industries in this zip code by the number of employees in 2005:
Mining: Construction Sand and Gravel Mining (10-19 employees: 1 establishment, 1-4 employees: 1 establishment)
Other Services (except Public Administration): General Automotive Repair (10-19: 1, 1-4: 1)
Other Services (except Public Administration): Labor Unions and Similar Labor Organizations (10-19: 1, 1-4: 1)
Accommodation and Food Services: Recreational and Vacation Camps (except Campgrounds) (10-19: 1)
Wholesale Trade: Home Furnishing Merchant Wholesalers (10-19: 1)
Professional, Scientific, and Technical Services: Tax Preparation Services (10-19: 1)
Other Services (except Public Administration): Religious Organizations (5-9: 1, 1-4: 4)
Fatal accident statistics in 2013:
Fatal accident count: 2
Vehicles involved in fatal accidents: 3
Fatal accidents caused by drunken drivers: 1
Fatalities: 2
Persons involved in fatal accidents: 3
Pedestrians involved in fatal accidents: 3
Home Mortgage Disclosure Act Aggregated Statistics For Year 2009 (Based on 2 partial tracts)
A) FHA, FSA/RHS & VA Home Purchase Loans
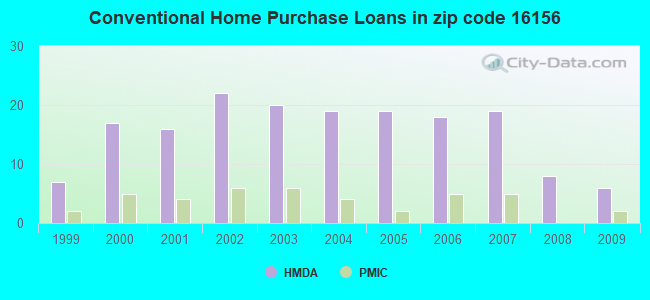
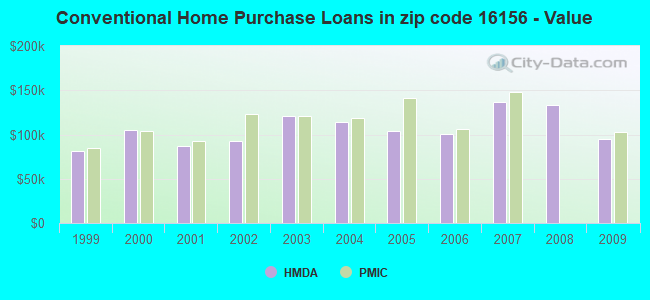
B) Conventional Home Purchase Loans
C) Refinancings
D) Home Improvement Loans
F) Non-occupant Loans on < 5 Family Dwellings (A B C & D)
G) Loans On Manufactured Home Dwelling (A B C & D)
Number
Average Value
Number
Average Value
Number
Average Value
Number
Average Value
Number
Average Value
Number
Average Value
LOANS ORIGINATED
4
$108,550
6
$95,357
32
$130,417
5
$44,622
1
$66,130
1
$125,580
APPLICATIONS APPROVED, NOT ACCEPTED
0
$0
1
$105,210
4
$136,355
0
$0
0
$0
0
$0
APPLICATIONS DENIED
1
$72,480
1
$220,440
14
$105,472
2
$44,925
1
$63,460
2
$80,325
APPLICATIONS WITHDRAWN
1
$84,840
2
$127,255
5
$126,586
1
$10,020
0
$0
1
$98,530
FILES CLOSED FOR INCOMPLETENESS
0
$0
0
$0
1
$32,400
0
$0
0
$0
0
$0
Aggregated Statistics For Year 2008 (Based on 2 partial tracts)
A) FHA, FSA/RHS & VA Home Purchase Loans
B) Conventional Home Purchase Loans
C) Refinancings
D) Home Improvement Loans
F) Non-occupant Loans on < 5 Family Dwellings (A B C & D)
G) Loans On Manufactured Home Dwelling (A B C & D)
Number
Average Value
Number
Average Value
Number
Average Value
Number
Average Value
Number
Average Value
Number
Average Value
LOANS ORIGINATED
3
$91,960
8
$133,516
18
$95,561
5
$27,856
1
$137,610
2
$64,965
APPLICATIONS APPROVED, NOT ACCEPTED
0
$0
1
$39,410
2
$78,655
0
$0
0
$0
1
$47,760
APPLICATIONS DENIED
0
$0
2
$71,645
14
$137,656
4
$35,405
0
$0
2
$79,825
APPLICATIONS WITHDRAWN
0
$0
0
$0
5
$155,644
0
$0
0
$0
0
$0
FILES CLOSED FOR INCOMPLETENESS
0
$0
0
$0
1
$183,030
0
$0
0
$0
0
$0
Aggregated Statistics For Year 2007 (Based on 2 partial tracts)
A) FHA, FSA/RHS & VA Home Purchase Loans
B) Conventional Home Purchase Loans
C) Refinancings
D) Home Improvement Loans
F) Non-occupant Loans on < 5 Family Dwellings (A B C & D)
G) Loans On Manufactured Home Dwelling (A B C & D)
Number
Average Value
Number
Average Value
Number
Average Value
Number
Average Value
Number
Average Value
Number
Average Value
LOANS ORIGINATED
1
$116,900
19
$137,256
23
$86,535
9
$35,663
2
$85,170
4
$65,048
APPLICATIONS APPROVED, NOT ACCEPTED
0
$0
1
$115,560
4
$129,342
1
$96,190
0
$0
0
$0
APPLICATIONS DENIED
0
$0
6
$105,265
26
$165,047
5
$49,298
3
$136,607
3
$63,237
APPLICATIONS WITHDRAWN
0
$0
3
$74,483
8
$92,018
1
$40,080
1
$60,120
0
$0
FILES CLOSED FOR INCOMPLETENESS
0
$0
0
$0
1
$141,280
0
$0
0
$0
0
$0
Aggregated Statistics For Year 2006 (Based on 2 partial tracts)
A) FHA, FSA/RHS & VA Home Purchase Loans
B) Conventional Home Purchase Loans
C) Refinancings
D) Home Improvement Loans
F) Non-occupant Loans on < 5 Family Dwellings (A B C & D)
G) Loans On Manufactured Home Dwelling (A B C & D)
Number
Average Value
Number
Average Value
Number
Average Value
Number
Average Value
Number
Average Value
Number
Average Value
LOANS ORIGINATED
2
$110,055
18
$100,701
30
$110,699
14
$33,829
3
$81,720
4
$60,202
APPLICATIONS APPROVED, NOT ACCEPTED
0
$0
2
$35,740
6
$132,820
2
$46,090
0
$0
0
$0
APPLICATIONS DENIED
0
$0
3
$44,980
24
$119,892
7
$65,511
2
$138,610
4
$79,825
APPLICATIONS WITHDRAWN
0
$0
4
$107,548
14
$119,906
1
$69,470
0
$0
1
$98,860
FILES CLOSED FOR INCOMPLETENESS
0
$0
1
$64,130
3
$93,630
0
$0
0
$0
0
$0
Aggregated Statistics For Year 2005 (Based on 2 partial tracts)
B) Conventional Home Purchase Loans
C) Refinancings
D) Home Improvement Loans
F) Non-occupant Loans on < 5 Family Dwellings (A B C & D)
G) Loans On Manufactured Home Dwelling (A B C & D)
Number
Average Value
Number
Average Value
Number
Average Value
Number
Average Value
Number
Average Value
LOANS ORIGINATED
19
$104,472
29
$84,099
11
$28,664
0
$0
6
$63,237
APPLICATIONS APPROVED, NOT ACCEPTED
2
$69,640
5
$89,578
0
$0
1
$37,070
2
$49,935
APPLICATIONS DENIED
5
$93,920
30
$116,588
9
$36,962
3
$39,747
4
$108,300
APPLICATIONS WITHDRAWN
3
$122,690
18
$113,708
3
$104,543
1
$60,120
1
$59,790
FILES CLOSED FOR INCOMPLETENESS
0
$0
2
$98,530
0
$0
0
$0
0
$0
Aggregated Statistics For Year 2004 (Based on 2 partial tracts)
A) FHA, FSA/RHS & VA Home Purchase Loans
B) Conventional Home Purchase Loans
C) Refinancings
D) Home Improvement Loans
F) Non-occupant Loans on < 5 Family Dwellings (A B C & D)
G) Loans On Manufactured Home Dwelling (A B C & D)
Number
Average Value
Number
Average Value
Number
Average Value
Number
Average Value
Number
Average Value
Number
Average Value
LOANS ORIGINATED
1
$124,250
19
$114,456
39
$106,931
14
$37,694
3
$49,990
4
$60,705
APPLICATIONS APPROVED, NOT ACCEPTED
0
$0
2
$68,805
5
$137,340
2
$37,075
1
$78,820
1
$35,070
APPLICATIONS DENIED
0
$0
5
$76,620
24
$106,282
9
$30,542
1
$49,100
4
$46,760
APPLICATIONS WITHDRAWN
0
$0
2
$59,955
21
$104,144
2
$231,460
2
$70,975
2
$94,520
FILES CLOSED FOR INCOMPLETENESS
0
$0
0
$0
7
$89,846
1
$105,540
0
$0
1
$32,730
Aggregated Statistics For Year 2003 (Based on 2 partial tracts)
A) FHA, FSA/RHS & VA Home Purchase Loans
B) Conventional Home Purchase Loans
C) Refinancings
D) Home Improvement Loans
F) Non-occupant Loans on < 5 Family Dwellings (A B C & D)
Number
Average Value
Number
Average Value
Number
Average Value
Number
Average Value
Number
Average Value
LOANS ORIGINATED
1
$76,150
20
$120,892
80
$102,392
15
$28,635
3
$62,457
APPLICATIONS APPROVED, NOT ACCEPTED
0
$0
3
$99,533
9
$151,636
2
$37,740
0
$0
APPLICATIONS DENIED
0
$0
3
$104,320
29
$98,138
5
$20,308
1
$152,970
APPLICATIONS WITHDRAWN
0
$0
2
$86,675
19
$107,144
3
$45,200
0
$0
FILES CLOSED FOR INCOMPLETENESS
0
$0
1
$68,470
5
$97,928
1
$17,700
0
$0
Aggregated Statistics For Year 2002 (Based on 2 partial tracts)
B) Conventional Home Purchase Loans
C) Refinancings
D) Home Improvement Loans
F) Non-occupant Loans on < 5 Family Dwellings (A B C & D)
Number
Average Value
Number
Average Value
Number
Average Value
Number
Average Value
LOANS ORIGINATED
22
$92,715
54
$91,225
9
$19,520
2
$51,770
APPLICATIONS APPROVED, NOT ACCEPTED
2
$35,405
12
$82,638
2
$18,535
1
$26,720
APPLICATIONS DENIED
6
$45,090
29
$85,850
4
$23,798
1
$30,390
APPLICATIONS WITHDRAWN
2
$46,260
12
$99,282
1
$15,030
0
$0
FILES CLOSED FOR INCOMPLETENESS
0
$0
5
$83,232
0
$0
0
$0
Aggregated Statistics For Year 2001 (Based on 2 partial tracts)
B) Conventional Home Purchase Loans
C) Refinancings
D) Home Improvement Loans
F) Non-occupant Loans on < 5 Family Dwellings (A B C & D)
Number
Average Value
Number
Average Value
Number
Average Value
Number
Average Value
LOANS ORIGINATED
16
$86,443
42
$104,367
14
$24,692
2
$34,905
APPLICATIONS APPROVED, NOT ACCEPTED
5
$71,476
10
$77,989
3
$23,270
0
$0
APPLICATIONS DENIED
7
$64,653
17
$83,343
4
$15,365
0
$0
APPLICATIONS WITHDRAWN
3
$110,887
12
$81,802
2
$12,190
0
$0
FILES CLOSED FOR INCOMPLETENESS
0
$0
5
$90,448
0
$0
0
$0
Aggregated Statistics For Year 2000 (Based on 2 partial tracts)
A) FHA, FSA/RHS & VA Home Purchase Loans
B) Conventional Home Purchase Loans
C) Refinancings
D) Home Improvement Loans
F) Non-occupant Loans on < 5 Family Dwellings (A B C & D)
Number
Average Value
Number
Average Value
Number
Average Value
Number
Average Value
Number
Average Value
LOANS ORIGINATED
1
$77,820
17
$105,249
20
$65,146
12
$19,428
2
$97,025
APPLICATIONS APPROVED, NOT ACCEPTED
0
$0
3
$76,263
5
$74,482
3
$31,730
0
$0
APPLICATIONS DENIED
0
$0
10
$54,175
14
$66,442
4
$31,230
0
$0
APPLICATIONS WITHDRAWN
0
$0
2
$113,895
8
$75,359
1
$33,730
0
$0
FILES CLOSED FOR INCOMPLETENESS
0
$0
0
$0
4
$110,302
0
$0
0
$0
Aggregated Statistics For Year 1999 (Based on 1 partial tract)
B) Conventional Home Purchase Loans
C) Refinancings
D) Home Improvement Loans
F) Non-occupant Loans on < 5 Family Dwellings (A B C & D)
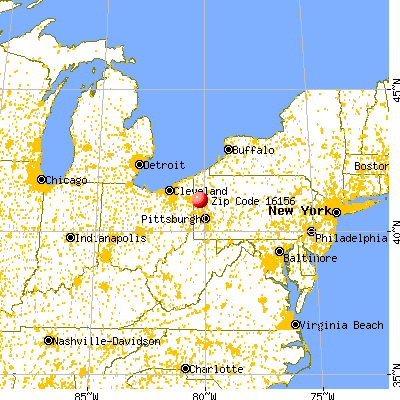


 Nearest zip codes: 16105, 16101, 16142, 16137, 16051, 16057.