Estimated zip code population in 2022: 4,252 Zip code population in 2010: 4,693 Zip code population in 2000: 5,075
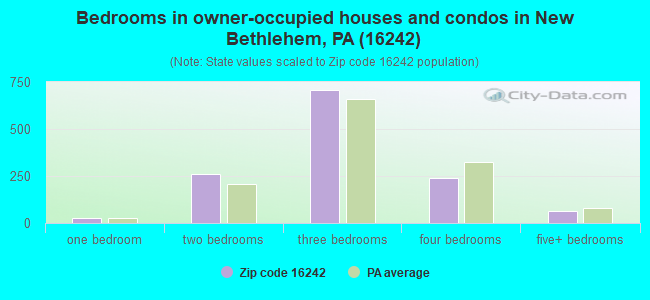
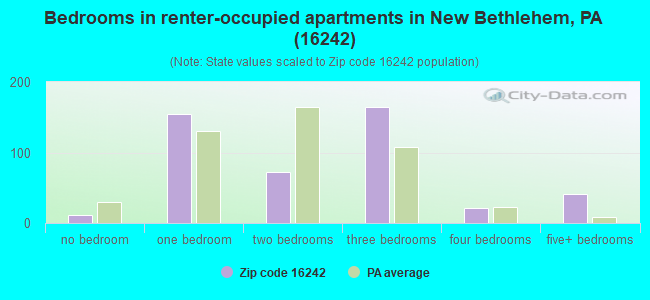
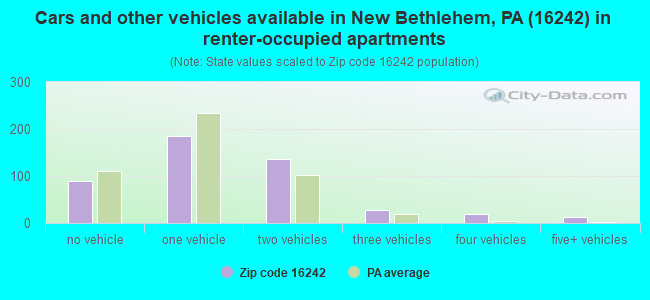
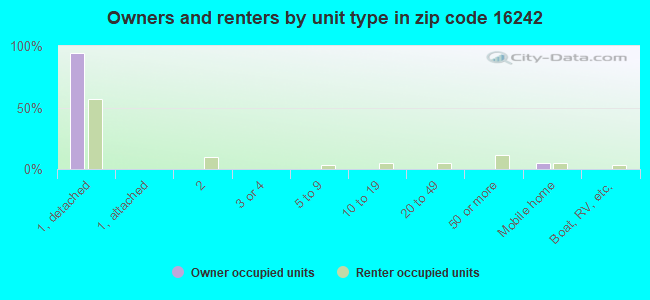
Houses and condos: 2,044 Renter-occupied apartments: 470
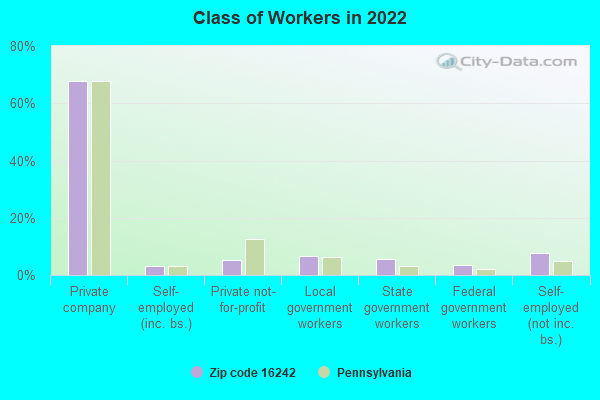
% of renters here:
27%
State:
31%
March 2022 cost of living index in zip code 16242: 90.6 (less than average, U.S. average is 100)
Land area: 90.5 sq. mi. Water area: 1.3 sq. mi.
Population density: 47 people per square mile
(very low).
OSM Map
General Map
Google Map
MSN Map
OSM Map
General Map
Google Map
MSN Map
OSM Map
General Map
Google Map
MSN Map
OSM Map
General Map
Google Map
MSN Map
Please wait while loading the map...
Real estate property taxes paid for housing units in 2022:
This zip code:
0.9% ($1,241)
Pennsylvania:
1.3% ($3,094)
Median real estate property taxes paid for housing units with mortgages in 2022: $1,259 (0.9%) Median real estate property taxes paid for housing units with no mortgage in 2022: $1,223 (0.9%)
Business Search- 14 Million verified businesses
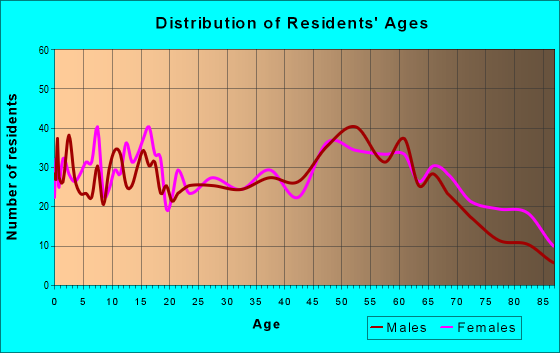
Males: 2,003
(47.1%)
Females: 2,248
(52.9%)
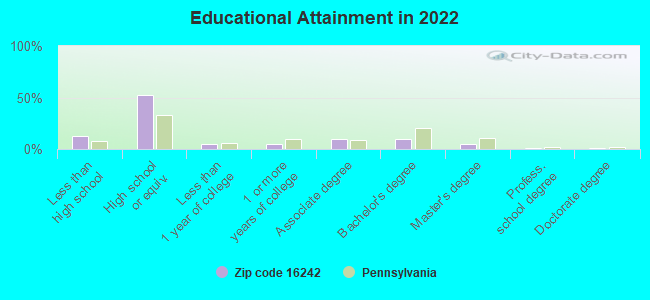
For population 25 years and over in 16242:
High school or higher: 86.9%
Bachelor's degree or higher: 16.6%
Graduate or professional degree: 7.2%
Unemployed: 3.1%
Mean travel time to work (commute): 28.3 minutes
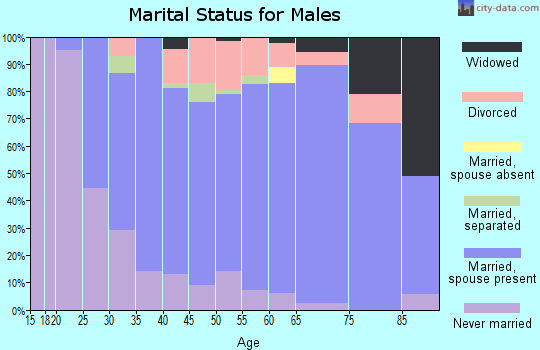
For population 15 years and over in 16242:
Never married: 21.8%
Now married: 60.7%
Separated: 0.9%
Widowed: 8.4%
Divorced: 8.3%
Zip code 16242 compared to state average:
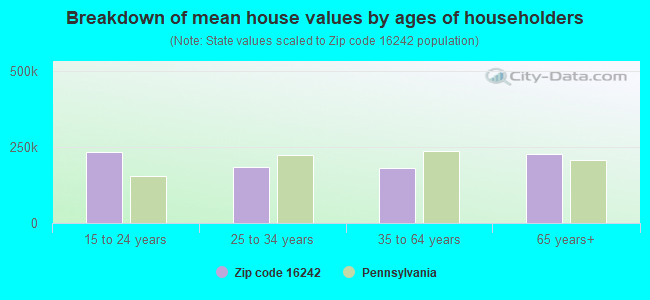
Median house value below state average.
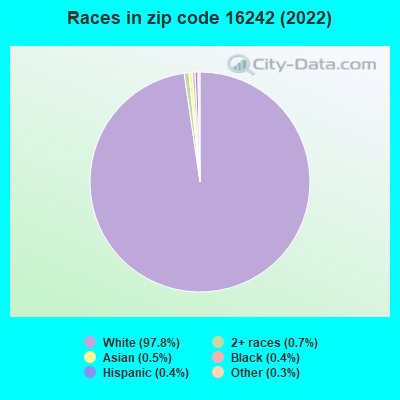
Black race population percentage significantly below state average.
Hispanic race population percentage significantly below state average.
Median age above state average.
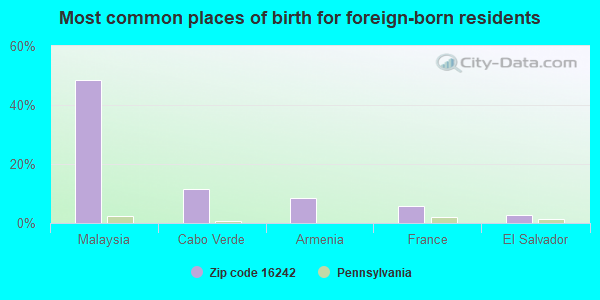
Foreign-born population percentage significantly below state average.
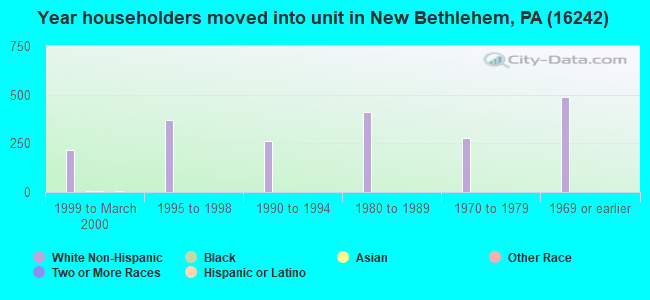
Length of stay since moving in significantly above state average.
Number of college students below state average.
Percentage of population with a bachelor's degree or higher below state average.
Estimated median house/condo value in 2022: $131,216
16242:
$131,216
Pennsylvania:
$245,500
According to our research of Pennsylvania and other state lists, there were 6 registered sex offenders living in 16242 zip code as of April 26, 2024. The ratio of all residents to sex offenders in zip code 16242 is 785 to 1. The ratio of registered sex offenders to all residents in this zip code is lower than the state average.
Median resident age:
This zip code:
45.0 years
Pennsylvania median age:
40.9 years
Average household size:
This zip code:
2.4 people
Pennsylvania:
2.4 people
Averages for the 2020 tax year for zip code 16242, filed in 2021:
Average Adjusted Gross Income (AGI) in 2020: $54,828 (Individual Income Tax Returns)
Here:
$54,828
State:
$75,707
Salary/wage: $46,938 (reported on 80.1% of returns)
Here:
$46,938
State:
$62,806
(% of AGI for various income ranges: 1188.1% for AGIs below $25k, 3397.7% for AGIs $25k-50k, 6250.0% for AGIs $50k-75k, 9223.3% for AGIs $75k-100k, 15128.8% for AGIs $100k-200k)
Taxable interest for individuals: $918 (reported on 38.8% of returns)
This zip code:
$918
Pennsylvania:
$1,633
(% of AGI for various income ranges: 34.5% for AGIs below $25k, 28.9% for AGIs $25k-50k, 42.0% for AGIs $50k-75k, 144.7% for AGIs $75k-100k, 59.4% for AGIs $100k-200k)
Ordinary dividends: $3,272 (reported on 22.8% of returns)
Here:
$3,272
State:
$7,382
(% of AGI for various income ranges: 47.6% for AGIs below $25k, 40.0% for AGIs $25k-50k, 74.0% for AGIs $50k-75k, 166.0% for AGIs $75k-100k, 455.0% for AGIs $100k-200k)
Net capital gain/loss in AGI: +$8,797 (reported on 14.6% of returns)
Here:
+$8,797
State:
+$23,522
(% of AGI for various income ranges: 19.0% for AGIs below $25k, 34.8% for AGIs $25k-50k, 71.2% for AGIs $50k-75k, 146.7% for AGIs $75k-100k, 1255.0% for AGIs $100k-200k)
Profit/loss from business: +$13,459 (reported on 13.1% of returns)
Here:
+$13,459
State:
+$16,274
(% of AGI for various income ranges: 53.3% for AGIs below $25k, 148.9% for AGIs $25k-50k, 227.6% for AGIs $50k-75k, 464.0% for AGIs $75k-100k, 931.2% for AGIs $100k-200k)
Taxable individual retirement arrangement distribution: $11,269 (reported on 12.6% of returns)
16242:
$11,269
Pennsylvania:
$18,583
(% of AGI for various income ranges: 141.2% for AGIs below $25k, 105.7% for AGIs $25k-50k, 198.8% for AGIs $50k-75k, 382.7% for AGIs $75k-100k, 500.6% for AGIs $100k-200k)
Total itemized deductions: $30,075 (reported on 1.9% of returns)
Here:
$30,075
State:
$34,850
(% of AGI for various income ranges: 802.0% for AGIs $75k-100k)
Charity contributions: $17,867 (reported on 1.5% of returns)
Here:
$17,867
State:
$12,392
(% of AGI for various income ranges: 357.3% for AGIs $75k-100k)
Taxes paid: $6,150 (reported on 1.9% of returns)
16242:
$6,150
State:
$8,200
(% of AGI for various income ranges: 153.8% for AGIs $100k-200k)
Earned income credit: $2,083 (reported on 14.6% of returns)
Here:
$2,083
State:
$2,100
(% of AGI for various income ranges: 82.6% for AGIs below $25k, 63.2% for AGIs $25k-50k)
Percentage of individuals using paid preparers for their 2020 taxes: 93.2%
Here:
93%
State:
92%
(% for various income ranges: 91.0% for AGIs below $25k, 94.6% for AGIs $25k-50k, 94.1% for AGIs $50k-75k, 95.7% for AGIs $75k-100k, 91.7% for AGIs $100k-200k, 100.0% for AGIs over 200k)
Averages for the 2012 tax year for zip code 16242, filed in 2013:
Average Adjusted Gross Income (AGI) in 2012: $44,908 (Individual Income Tax Returns)
Here:
$44,908
State:
$61,346
Salary/wage: $39,451 (reported on 80.3% of returns)
Here:
$39,451
State:
$51,902
(% of AGI for various income ranges: 65.9% for AGIs below $25k, 74.8% for AGIs $25k-50k, 75.7% for AGIs $50k-75k, 83.7% for AGIs $75k-100k, 83.2% for AGIs $100k-200k)
Taxable interest for individuals: $1,298 (reported on 40.4% of returns)
This zip code:
$1,298
Pennsylvania:
$1,588
(% of AGI for various income ranges: 2.7% for AGIs below $25k, 1.0% for AGIs $25k-50k, 1.2% for AGIs $50k-75k, 0.5% for AGIs $75k-100k, 1.6% for AGIs $100k-200k)
Ordinary dividends: $2,078 (reported on 25.1% of returns)
Here:
$2,078
State:
$5,827
(% of AGI for various income ranges: 2.4% for AGIs below $25k, 0.8% for AGIs $25k-50k, 1.0% for AGIs $50k-75k, 0.8% for AGIs $75k-100k, 2.0% for AGIs $100k-200k)
Net capital gain/loss in AGI: +$5,622 (reported on 13.3% of returns)
Here:
+$5,622
State:
+$14,495
(% of AGI for various income ranges: 0.6% for AGIs $25k-50k, 1.3% for AGIs $50k-75k, 0.4% for AGIs $75k-100k, 6.3% for AGIs $100k-200k)
Profit/loss from business: +$10,929 (reported on 15.3% of returns)
Here:
+$10,929
State:
+$16,268
(% of AGI for various income ranges: 4.9% for AGIs below $25k, 4.2% for AGIs $25k-50k, 3.3% for AGIs $50k-75k, 1.8% for AGIs $75k-100k, 6.7% for AGIs $100k-200k)
Taxable individual retirement arrangement distribution: $8,168 (reported on 12.3% of returns)
16242:
$8,168
Pennsylvania:
$14,550
(% of AGI for various income ranges: 4.9% for AGIs below $25k, 2.8% for AGIs $25k-50k, 2.0% for AGIs $50k-75k, 1.5% for AGIs $75k-100k, 2.2% for AGIs $100k-200k)
Total itemized deductions: $18,483 (19% of AGI, reported on 14.3% of returns)
Here:
$18,483
State:
$23,538
Here:
19.3% of AGI
State:
18.4% of AGI
(% of AGI for various income ranges: 3.6% for AGIs below $25k, 3.8% for AGIs $25k-50k, 5.6% for AGIs $50k-75k, 6.3% for AGIs $75k-100k, 8.7% for AGIs $100k-200k, 7.4% for AGIs over 200k)
Charity contributions: $6,005 (reported on 9.9% of returns)
Here:
$6,005
State:
$4,025
(% of AGI for various income ranges: 0.9% for AGIs $25k-50k, 0.9% for AGIs $50k-75k, 1.3% for AGIs $75k-100k, 3.6% for AGIs $100k-200k)
Taxes paid: $5,561 (reported on 13.8% of returns)
16242:
$5,561
State:
$9,982
(% of AGI for various income ranges: 0.6% for AGIs below $25k, 0.6% for AGIs $25k-50k, 1.1% for AGIs $50k-75k, 2.0% for AGIs $75k-100k, 3.2% for AGIs $100k-200k, 3.3% for AGIs over 200k)
Earned income credit: $2,245 (reported on 15.3% of returns)
Here:
$2,245
State:
$2,106
(% of AGI for various income ranges: 5.5% for AGIs below $25k, 0.9% for AGIs $25k-50k)
Percentage of individuals using paid preparers for their 2012 taxes: 63.1%
Here:
63%
State:
53%
(% for various income ranges: 58.3% for AGIs below $25k, 62.0% for AGIs $25k-50k, 68.6% for AGIs $50k-75k, 68.4% for AGIs $75k-100k, 69.2% for AGIs $100k-200k, 100.0% for AGIs over 200k)
Averages for the 2004 tax year for zip code 16242, filed in 2005:
Average Adjusted Gross Income (AGI) in 2004: $34,034 (Individual Income Tax Returns)
Here:
$34,034
State:
$48,049
Salary/wage: $30,613 (reported on 80.4% of returns)
Here:
$30,613
State:
$42,646
(% of AGI for various income ranges: 106.0% for AGIs below $10k, 65.4% for AGIs $10k-25k, 77.0% for AGIs $25k-50k, 81.7% for AGIs $50k-75k, 81.3% for AGIs $75k-100k, 45.4% for AGIs over 100k)
Taxable interest for individuals: $1,683 (reported on 53.8% of returns)
This zip code:
$1,683
Pennsylvania:
$1,657
(% of AGI for various income ranges: 10.6% for AGIs below $10k, 4.2% for AGIs $10k-25k, 1.5% for AGIs $25k-50k, 1.4% for AGIs $50k-75k, 1.3% for AGIs $75k-100k, 5.3% for AGIs over 100k)
Taxable dividends: $1,522 (reported on 27.8% of returns)
Here:
$1,522
State:
$3,566
(% of AGI for various income ranges: 4.9% for AGIs below $10k, 1.3% for AGIs $10k-25k, 0.9% for AGIs $25k-50k, 1.0% for AGIs $50k-75k, 1.7% for AGIs $75k-100k, 1.5% for AGIs over 100k)
Net capital gain/loss: +$4,934 (reported on 18.8% of returns)
Here:
+$4,934
State:
+$9,716
(% of AGI for various income ranges: -3.2% for AGIs below $10k, 1.0% for AGIs $10k-25k, 0.6% for AGIs $25k-50k, 1.5% for AGIs $50k-75k, 0.2% for AGIs $75k-100k, 12.2% for AGIs over 100k)
Profit/loss from business: +$9,242 (reported on 15.4% of returns)
Here:
+$9,242
State:
+$14,267
(% of AGI for various income ranges: 9.5% for AGIs below $10k, 5.9% for AGIs $10k-25k, 4.5% for AGIs $25k-50k, 0.7% for AGIs $50k-75k, -0.0% for AGIs $75k-100k, 9.5% for AGIs over 100k)
IRA payment deduction: $2,990 (reported on 5.2% of returns)
16242:
$2,990
Pennsylvania:
$2,903
(% of AGI for various income ranges: 0.5% for AGIs $10k-25k, 0.6% for AGIs $25k-50k, 0.5% for AGIs $50k-75k, 0.7% for AGIs $75k-100k)
Total itemized deductions: $14,070 (19% of AGI, reported on 13.5% of returns)
Here:
$14,070
State:
$18,804
Here:
18.6% of AGI
State:
19.5% of AGI
(% of AGI for various income ranges: 4.3% for AGIs $10k-25k, 4.0% for AGIs $25k-50k, 5.6% for AGIs $50k-75k, 8.5% for AGIs $75k-100k, 7.9% for AGIs over 100k)
Charity contributions deductions: $4,066 (5% of AGI, reported on 11.3% of returns)
Here:
$4,066
State:
$3,337
Here:
5.1% of AGI
State:
3.3% of AGI
(% of AGI for various income ranges: 0.8% for AGIs $10k-25k, 0.7% for AGIs $25k-50k, 1.2% for AGIs $50k-75k, 2.3% for AGIs $75k-100k, 2.7% for AGIs over 100k)
Total tax: $4,240 (reported on 72.7% of returns)
16242:
$4,240
State:
$8,008
(% of AGI for various income ranges: 3.0% for AGIs below $10k, 4.0% for AGIs $10k-25k, 6.2% for AGIs $25k-50k, 8.5% for AGIs $50k-75k, 10.0% for AGIs $75k-100k, 19.0% for AGIs over 100k)
Earned income credit: $1,475 (reported on 15.0% of returns)
Here:
$1,475
State:
$1,643
Percentage of individuals using paid preparers for their 2004 taxes: 67.0%
Here:
67%
State:
56%
(% for various income ranges: 60.0% for AGIs below $10k, 66.2% for AGIs $10k-25k, 71.1% for AGIs $25k-50k, 66.5% for AGIs $50k-75k, 69.1% for AGIs $75k-100k, 82.4% for AGIs over 100k)
Likely homosexual households (counted as self-reported same-sex unmarried-partner households)
Lesbian couples: 0.2% of all households
Gay men: 0.0% of all households
Household received Food Stamps/SNAP in the past 12 months: 252 Household did not receive Food Stamps/SNAP in the past 12 months: 1,515
Women who had a birth in the past 12 months: 97 (93 now married, 8 unmarried) Women who did not have a birth in the past 12 months: 741 (364 now married, 374 unmarried)
Housing units in zip code 16242 with a mortgage: 592 (67 second mortgage, 57 both second mortgage and home equity loan) Houses without a mortgage: 52
Median monthly owner costs for units with a mortgage: $1,056 Median monthly owner costs for units without a mortgage: $407
Residents with income below the poverty level in 2022:
This zip code:
15.7%
Whole state:
11.8%
Residents with income below 50% of the poverty level in 2022:
This zip code:
10.7%
Whole state:
6.1%
Median number of rooms in houses and condos:
Here:
6.6
State:
6.8
Median number of rooms in apartments:
Here:
4.8
State:
4.3
Notable locations in this zip code not listed on our city pages
Notable locations in zip code 16242: Junction Bostonia Branch Station (A), Colwell Station (B), Oakland Station (C), Reedy Station (D), Thayerton (E), Mahoning Station (F), Leatherwood Station (G), New Bethlehem Fire Company 1 (H), Distant Area Volunteer Fire Company (I). Display/hide their locations on the map
Churches in zip code 16242 include: Saint Marks Church (A), Jerusalem Church (B), Oak Grove Church (C), Oakland Church (D), Leatherwood Church (E). Display/hide their locations on the map
Streams, rivers, and creeks: Parsons Run (A), Mudlick Creek (B), Long Run (C), Leatherwood Creek (D), Jack Run (E), Leisure Run (F), Hamilton Run (G), Cave Run (H), Little Piney Creek (I). Display/hide their locations on the map
700 married couples with children.
114 single-parent households (67 men, 47 women).
98.7% of residents of 16242 zip code speak English at home.
0.3% of residents speak Spanish at home (100% very well).
0.3% of residents speak other Indo-European language at home (54% very well, 46% well).
0.3% of residents speak Asian or Pacific Island language at home (23% very well, 77% well).
Foreign born population: 35 (0.8%) (39.2% of them are naturalized citizens)
This zip code:
0.8%
Whole state:
7.5%
49%Malaysia
11%Cabo Verde
9%Armenia
6%France
3%El Salvador
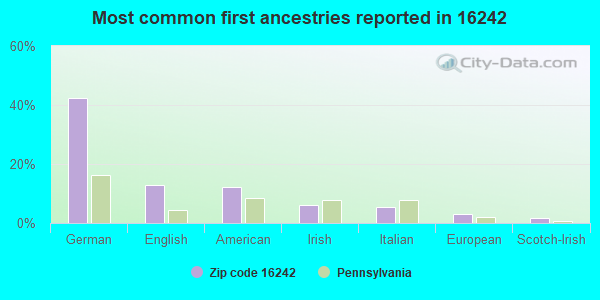
42%German
13%English
12%American
6%Irish
5%Italian
3%European
2%Scotch-Irish
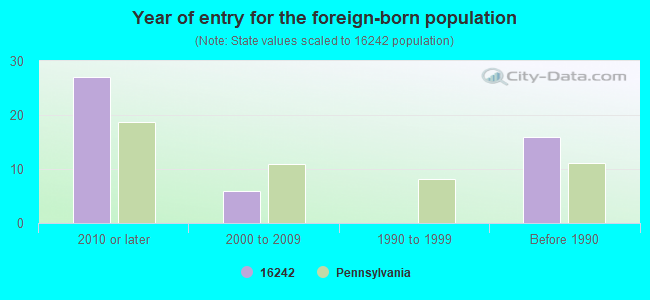
Year of entry for the foreign-born population
272010 or later
62000 to 2009
01990 to 1999
16Before 1990
Facilities with environmental interests located in this zip code:
ATLANTIC SERVICE STATION (200 LIBERTY-TANKS in NEW BETHLEHEM, PA)
Conditionally Exempt Small Quantity Generators, less than 100 kg/month of hazardous waste (Resource Conservation and Recovery Act (tracking hazardous waste)) - notification Organizations: OPERNAME (CONTACT/OPERATOR)
, ATLANTIC REFINING & MARKETING (CONTACT/OWNER)
Housing units lacking complete plumbing facilities: 2.4% Housing units lacking complete kitchen facilities: 5.6%
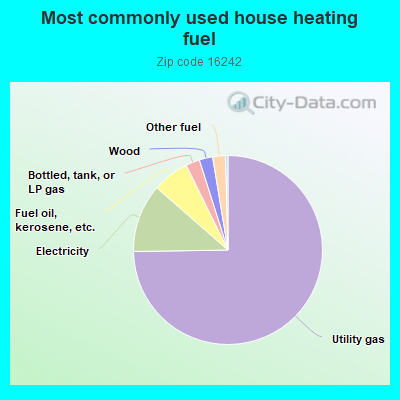
74.9%Utility gas
11.7%Electricity
6.3%Fuel oil, kerosene, etc.
2.4%Bottled, tank, or LP gas
2.3%Wood
2.2%Other fuel
Population in 1990: 4,698. Population change in the 1990s: +377 (+8.0%).
Place of birth for U.S.-born residents:
This state: 3,881
Northeast: 76
Midwest: 99
South: 77
West: 32
72% of the 16242 zip code residents lived in the same house 5 years ago. Out of people who lived in different houses, 50% lived in this county. Out of people who lived in different counties, 50% lived in Pennsylvania.
97% of the 16242 zip code residents lived in the same house 1 year ago. Out of people who lived in different houses, 67% moved from this county. Out of people who lived in different houses, 31% moved from different county within same state. Out of people who lived in different houses, 11% moved from different state.
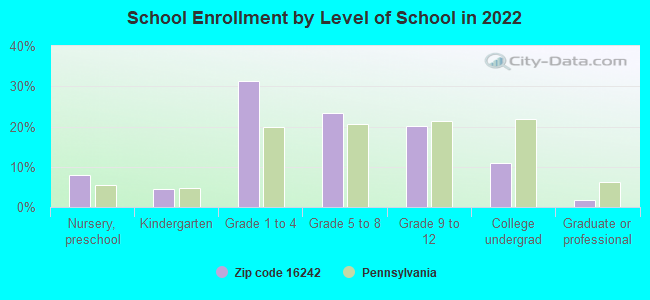
Private vs. public school enrollment:
Students in private schools in grades 1 to 8 (elementary and middle school): 41
Here:
10.2%
Pennsylvania:
15.7%
Students in private schools in grades 9 to 12 (high school): 2
Here:
1.4%
Pennsylvania:
13.4%
Students in private undergraduate colleges: 15
Here:
18.1%
Pennsylvania:
39.8%
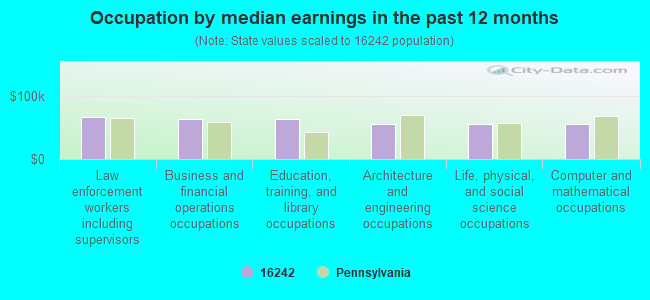
Occupation by median earnings in the past 12 months ($)
65,856Law enforcement workers including supervisors
63,919Business and financial operations occupations
63,278Education, training, and library occupations
56,174Architecture and engineering occupations
56,134Life, physical, and social science occupations
55,914Computer and mathematical occupations
Companies with federal contracts located in this zip code:
REICHARD CONTRACTING, INC (212 OLEAN TRAIL in NEW BETHLEHEM, PA; small business)
$546,723 with U.S. Army Corps of Engineers - civil program financing only for Maintenance, Repair or Alteration of Real Property -- Other Conservation and Development Facilities. Signed on 2001-06-29. Completion date: 2001-12-22.
KIRKS HAULING (R D 2, BOX287 in NEW BETHLEHEM, PA; small business) : $1,840 in 2 contractsin 2002
$1,840 with U.S. Army Corps of Engineers - civil program financing only for Trash/Garbage Collection Services - Including Portable Sanitation Services. Signed on 2002-10-30. Completion date: 2003-10-31.
$0, same as above.Signed on 2002-10-30. Completion date: 2003-10-31.
Top industries in this zip code by the number of employees in 2005:
Detailed PMIC statistics for the following Tracts:9801.00
2003 - 2018 National Fire Incident Reporting System (NFIRS) incidents
According to the data from the years 2003 - 2018 the average number of fire incidents per year is 15. The highest number of reported fires - 42 took place in 2003, and the least - 0 in 2010. The data has a declining trend.
When looking into fire subcategories, the most reports belonged to: Structure Fires (65.4%), and Outside Fires (16.9%).
Fire incident types reported to NFIRS in Zip Code 16242
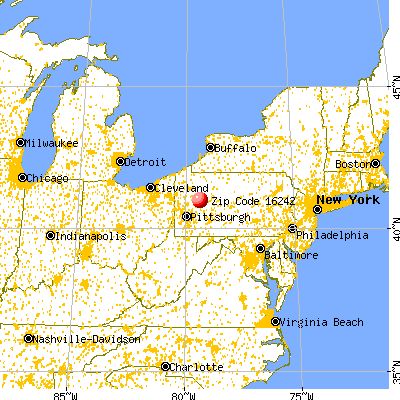


 Nearest zip codes: 16223, 16253, 16245, 16230, 16224, 16259.


 According to the data from the years 2003 - 2018 the average number of fire incidents per year is 15. The highest number of reported fires - 42 took place in 2003, and the least - 0 in 2010. The data has a declining trend.
 When looking into fire subcategories, the most reports belonged to: Structure Fires (65.4%), and Outside Fires (16.9%).