Estimated zip code population in 2022: 1,532 Zip code population in 2010: 2,238 Zip code population in 2000: 2,438
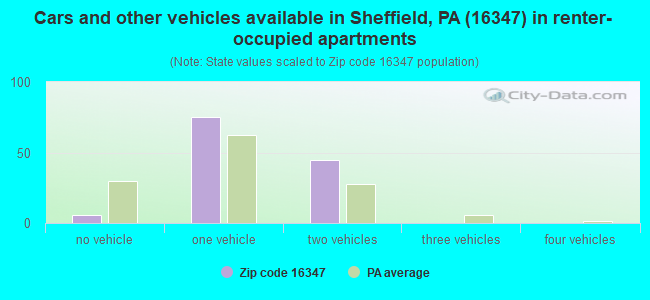
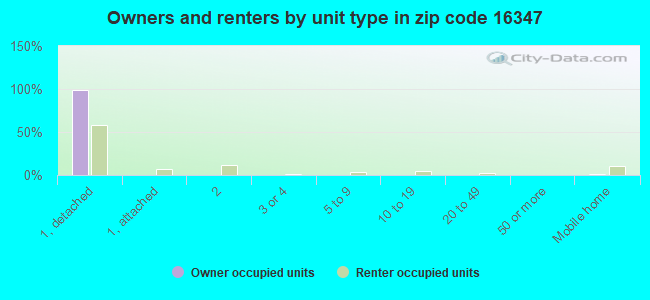
Houses and condos: 1,333 Renter-occupied apartments: 125
% of renters here:
20%
State:
31%
March 2022 cost of living index in zip code 16347: 89.5 (less than average, U.S. average is 100)
Land area: 102.9 sq. mi. Water area: 0.0 sq. mi.
Population density: 15 people per square mile
(very low).
OSM Map
General Map
Google Map
MSN Map
OSM Map
General Map
Google Map
MSN Map
OSM Map
General Map
Google Map
MSN Map
OSM Map
General Map
Google Map
MSN Map
Please wait while loading the map...
Real estate property taxes paid for housing units in 2022:
This zip code:
0.9% ($958)
Pennsylvania:
1.3% ($3,094)
Median real estate property taxes paid for housing units with mortgages in 2022: $917 (0.9%) Median real estate property taxes paid for housing units with no mortgage in 2022: $1,049 (1.1%)
Business Search- 14 Million verified businesses
Males: 810
(52.9%)
Females: 722
(47.1%)
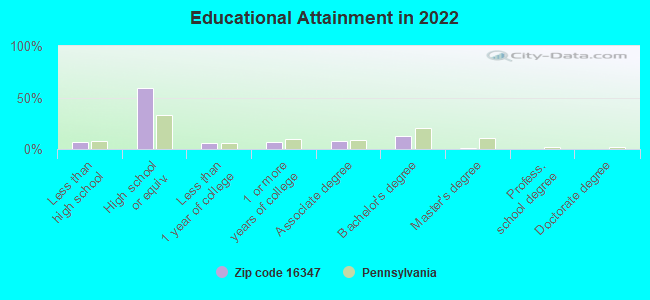
For population 25 years and over in 16347:
High school or higher: 92.1%
Bachelor's degree or higher: 13.9%
Graduate or professional degree: 1.2%
Unemployed: 2.1%
Mean travel time to work (commute): 18.9 minutes
For population 15 years and over in 16347:
Never married: 32.2%
Now married: 45.6%
Separated: 0.1%
Widowed: 11.9%
Divorced: 10.3%
Zip code 16347 compared to state average:
Median house value significantly below state average.
Unemployed percentage below state average.
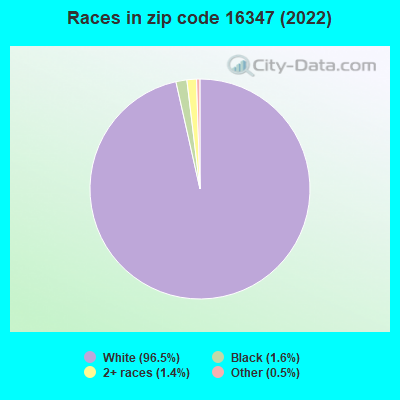
Black race population percentage significantly below state average.
Hispanic race population percentage significantly below state average.
Foreign-born population percentage significantly below state average.
Renting percentage below state average.
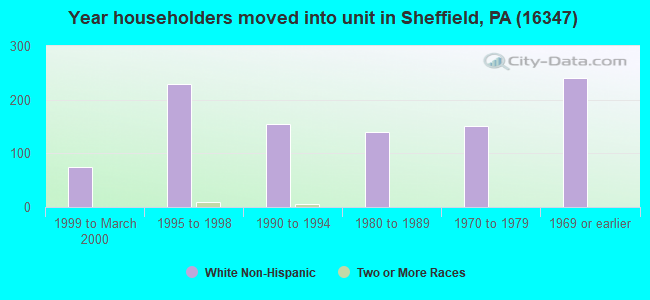
Length of stay since moving in significantly above state average.
Number of rooms per house below state average.
Number of college students below state average.
Percentage of population with a bachelor's degree or higher significantly below state average.
Estimated median house/condo value in 2022: $101,478
16347:
$101,478
Pennsylvania:
$245,500
According to our research of Pennsylvania and other state lists, there were 3 registered sex offenders living in 16347 zip code as of April 27, 2024. The ratio of all residents to sex offenders in zip code 16347 is 853 to 1. The ratio of registered sex offenders to all residents in this zip code is lower than the state average.
Median resident age:
This zip code:
43.4 years
Pennsylvania median age:
40.9 years
Average household size:
This zip code:
2.5 people
Pennsylvania:
2.4 people
Averages for the 2020 tax year for zip code 16347, filed in 2021:
Average Adjusted Gross Income (AGI) in 2020: $44,160 (Individual Income Tax Returns)
Here:
$44,160
State:
$75,707
Salary/wage: $39,070 (reported on 78.6% of returns)
Here:
$39,070
State:
$62,806
(% of AGI for various income ranges: 1074.6% for AGIs below $25k, 3333.0% for AGIs $25k-50k, 6005.5% for AGIs $50k-75k, 8205.7% for AGIs $75k-100k, 14978.0% for AGIs $100k-200k)
Taxable interest for individuals: $384 (reported on 25.5% of returns)
This zip code:
$384
Pennsylvania:
$1,633
(% of AGI for various income ranges: 17.9% for AGIs below $25k, 4.3% for AGIs $25k-50k, 21.8% for AGIs $50k-75k, 12.9% for AGIs $75k-100k, 20.0% for AGIs $100k-200k)
Ordinary dividends: $1,735 (reported on 17.3% of returns)
Here:
$1,735
State:
$7,382
(% of AGI for various income ranges: 31.7% for AGIs below $25k, 20.4% for AGIs $25k-50k, 37.3% for AGIs $50k-75k, 65.7% for AGIs $75k-100k, 170.0% for AGIs $100k-200k)
Net capital gain/loss in AGI: +$2,589 (reported on 9.2% of returns)
Here:
+$2,589
State:
+$23,522
(% of AGI for various income ranges: 6.2% for AGIs below $25k, 42.6% for AGIs $25k-50k, 171.4% for AGIs $75k-100k)
Profit/loss from business: +$4,400 (reported on 7.1% of returns)
Here:
+$4,400
State:
+$16,274
(% of AGI for various income ranges: 120.0% for AGIs below $25k, 18.2% for AGIs $50k-75k)
Taxable individual retirement arrangement distribution: $11,507 (reported on 14.3% of returns)
16347:
$11,507
Pennsylvania:
$18,583
(% of AGI for various income ranges: 125.4% for AGIs below $25k, 157.4% for AGIs $25k-50k, 362.7% for AGIs $50k-75k, 784.3% for AGIs $75k-100k)
Earned income credit: $2,088 (reported on 16.3% of returns)
Here:
$2,088
State:
$2,100
(% of AGI for various income ranges: 83.3% for AGIs below $25k, 58.3% for AGIs $25k-50k)
Percentage of individuals using paid preparers for their 2020 taxes: 92.9%
Here:
93%
State:
92%
(% for various income ranges: 91.9% for AGIs below $25k, 96.4% for AGIs $25k-50k, 93.3% for AGIs $50k-75k, 90.0% for AGIs $75k-100k, 87.5% for AGIs $100k-200k)
Averages for the 2012 tax year for zip code 16347, filed in 2013:
Average Adjusted Gross Income (AGI) in 2012: $39,018 (Individual Income Tax Returns)
Here:
$39,018
State:
$61,346
Salary/wage: $34,557 (reported on 79.0% of returns)
Here:
$34,557
State:
$51,902
(% of AGI for various income ranges: 66.4% for AGIs below $25k, 77.3% for AGIs $25k-50k, 80.0% for AGIs $50k-75k, 79.4% for AGIs $75k-100k, 47.2% for AGIs $100k-200k)
Taxable interest for individuals: $482 (reported on 31.4% of returns)
This zip code:
$482
Pennsylvania:
$1,588
(% of AGI for various income ranges: 0.8% for AGIs below $25k, 0.3% for AGIs $25k-50k, 0.5% for AGIs $50k-75k, 0.3% for AGIs $100k-200k)
Ordinary dividends: $1,781 (reported on 20.0% of returns)
Here:
$1,781
State:
$5,827
(% of AGI for various income ranges: 2.1% for AGIs below $25k, 1.2% for AGIs $25k-50k, 0.8% for AGIs $50k-75k, 0.6% for AGIs $100k-200k)
Net capital gain/loss in AGI: +$270 (reported on 9.5% of returns)
Here:
+$270
State:
+$14,495
(% of AGI for various income ranges: 0.9% for AGIs $75k-100k)
Profit/loss from business: +$12,980 (reported on 9.5% of returns)
Here:
+$12,980
State:
+$16,268
(% of AGI for various income ranges: 7.7% for AGIs below $25k, 1.2% for AGIs $50k-75k, 12.3% for AGIs $75k-100k)
Taxable individual retirement arrangement distribution: $7,656 (reported on 15.2% of returns)
16347:
$7,656
Pennsylvania:
$14,550
(% of AGI for various income ranges: 4.9% for AGIs below $25k, 3.2% for AGIs $25k-50k, 3.0% for AGIs $50k-75k, 5.5% for AGIs $75k-100k)
Total itemized deductions: $18,825 (20% of AGI, reported on 7.6% of returns)
Here:
$18,825
State:
$23,538
Here:
19.6% of AGI
State:
18.4% of AGI
(% of AGI for various income ranges: 7.4% for AGIs below $25k, 4.6% for AGIs $50k-75k, 6.7% for AGIs $100k-200k)
Charity contributions: $2,983 (reported on 5.7% of returns)
Here:
$2,983
State:
$4,025
Taxes paid: $4,775 (reported on 7.6% of returns)
16347:
$4,775
State:
$9,982
(% of AGI for various income ranges: 1.0% for AGIs below $25k, 1.2% for AGIs $50k-75k, 2.2% for AGIs $100k-200k)
Earned income credit: $1,989 (reported on 18.1% of returns)
Here:
$1,989
State:
$2,106
(% of AGI for various income ranges: 4.9% for AGIs below $25k, 1.0% for AGIs $25k-50k)
Percentage of individuals using paid preparers for their 2012 taxes: 50.5%
Here:
50%
State:
53%
(% for various income ranges: 44.7% for AGIs below $25k, 51.9% for AGIs $25k-50k, 52.9% for AGIs $50k-75k, 57.1% for AGIs $75k-100k, 71.4% for AGIs $100k-200k)
Averages for the 2004 tax year for zip code 16347, filed in 2005:
Average Adjusted Gross Income (AGI) in 2004: $32,689 (Individual Income Tax Returns)
Here:
$32,689
State:
$48,049
Salary/wage: $27,142 (reported on 79.9% of returns)
Here:
$27,142
State:
$42,646
(% of AGI for various income ranges: 96.7% for AGIs below $10k, 67.9% for AGIs $10k-25k, 73.8% for AGIs $25k-50k, 80.5% for AGIs $50k-75k, 72.5% for AGIs $75k-100k, 25.6% for AGIs over 100k)
Taxable interest for individuals: $836 (reported on 44.9% of returns)
This zip code:
$836
Pennsylvania:
$1,657
(% of AGI for various income ranges: 5.2% for AGIs below $10k, 1.7% for AGIs $10k-25k, 0.9% for AGIs $25k-50k, 0.4% for AGIs $50k-75k, 0.8% for AGIs $75k-100k, 1.7% for AGIs over 100k)
Taxable dividends: $1,417 (reported on 24.6% of returns)
Here:
$1,417
State:
$3,566
(% of AGI for various income ranges: 4.1% for AGIs below $10k, 1.0% for AGIs $10k-25k, 1.1% for AGIs $25k-50k, 0.6% for AGIs $50k-75k, 0.3% for AGIs $75k-100k, 1.7% for AGIs over 100k)
Net capital gain/loss: +$12,353 (reported on 14.2% of returns)
Here:
+$12,353
State:
+$9,716
(% of AGI for various income ranges: -1.8% for AGIs below $10k, -0.5% for AGIs $10k-25k, 1.2% for AGIs $25k-50k, 0.5% for AGIs $50k-75k, 4.5% for AGIs $75k-100k, 25.8% for AGIs over 100k)
Profit/loss from business: +$2,458 (reported on 12.2% of returns)
Here:
+$2,458
State:
+$14,267
(% of AGI for various income ranges: 3.6% for AGIs below $10k, 2.9% for AGIs $10k-25k, 1.9% for AGIs $25k-50k, 0.0% for AGIs $50k-75k, -1.3% for AGIs over 100k)
Total itemized deductions: $13,284 (17% of AGI, reported on 10.1% of returns)
Here:
$13,284
State:
$18,804
Here:
16.9% of AGI
State:
19.5% of AGI
(% of AGI for various income ranges: 2.6% for AGIs $10k-25k, 3.1% for AGIs $25k-50k, 5.6% for AGIs $50k-75k, 4.9% for AGIs $75k-100k, 5.4% for AGIs over 100k)
Charity contributions deductions: $2,816 (4% of AGI, reported on 8.1% of returns)
Here:
$2,816
State:
$3,337
Here:
3.6% of AGI
State:
3.3% of AGI
(% of AGI for various income ranges: 0.3% for AGIs $10k-25k, 0.6% for AGIs $25k-50k, 0.6% for AGIs $50k-75k, 1.2% for AGIs $75k-100k, 1.1% for AGIs over 100k)
Total tax: $4,143 (reported on 72.2% of returns)
16347:
$4,143
State:
$8,008
(% of AGI for various income ranges: 2.7% for AGIs below $10k, 4.0% for AGIs $10k-25k, 6.7% for AGIs $25k-50k, 8.5% for AGIs $50k-75k, 11.5% for AGIs $75k-100k, 18.6% for AGIs over 100k)
Earned income credit: $1,681 (reported on 19.6% of returns)
Here:
$1,681
State:
$1,643
Percentage of individuals using paid preparers for their 2004 taxes: 59.2%
Here:
59%
State:
56%
(% for various income ranges: 55.1% for AGIs below $10k, 59.0% for AGIs $10k-25k, 59.9% for AGIs $25k-50k, 61.6% for AGIs $50k-75k, 52.5% for AGIs $75k-100k, 84.8% for AGIs over 100k)
Household received Food Stamps/SNAP in the past 12 months: 107 Household did not receive Food Stamps/SNAP in the past 12 months: 506
Women who had a birth in the past 12 months: 49 (0 now married, 42 unmarried) Women who did not have a birth in the past 12 months: 256 (149 now married, 105 unmarried)
Housing units in zip code 16347 with a mortgage: 160 (26 second mortgage, 26 both second mortgage and home equity loan) Houses without a mortgage: 35
Median monthly owner costs for units with a mortgage: $1,049 Median monthly owner costs for units without a mortgage: $425
Residents with income below the poverty level in 2022:
This zip code:
12.4%
Whole state:
11.8%
Residents with income below 50% of the poverty level in 2022:
This zip code:
9.8%
Whole state:
6.1%
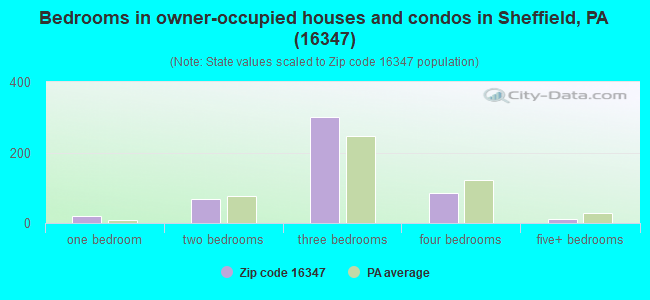
Median number of rooms in houses and condos:
Here:
7.3
State:
6.8
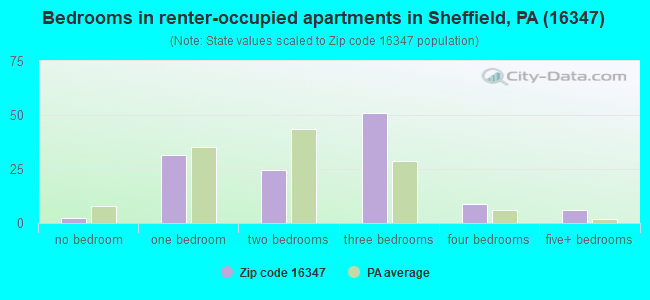
Median number of rooms in apartments:
Here:
4.9
State:
4.3
Notable locations in this zip code not listed on our city pages
Notable locations in zip code 16347: Cherry Run (A), Sheffield Ranger District Headquarters (B), Martin (C), Sheffield Volunteer Fire Department Station 72 (D), Sheffield Station (E). Display/hide their locations on the map
Streams, rivers, and creeks: Twomile Run (A), South Branch Tionesta Creek (B), Roystone Run (C), Pigeon Run (D), Phillips Run (E), East Branch Tionesta Creek (F), Dodge Run (G), Deer Lick Run (H), County Line Run (I). Display/hide their locations on the map
Size of family households: 145 2-persons, 184 3-persons, 60 4-persons, 6 5-persons
Size of nonfamily households: 198 1-person, 14 2-persons
191 married couples with children.
61 single-parent households (61 women).
98.9% of residents of 16347 zip code speak English at home.
0.5% of residents speak other Indo-European language at home (100% very well).
Foreign born population: 0 (0.0%)
:
0.0%
Whole state:
7.5%
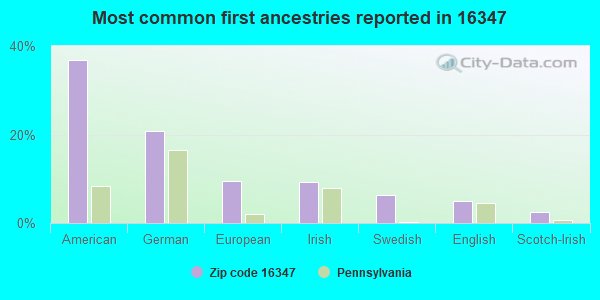
37%American
21%German
9%European
9%Irish
6%Swedish
5%English
3%Scotch-Irish
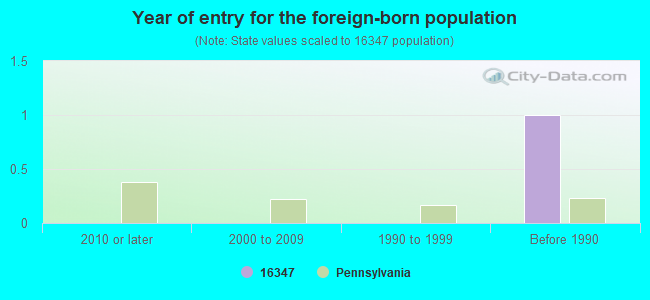
Year of entry for the foreign-born population
02010 or later
02000 to 2009
01990 to 1999
1Before 1990
Housing units lacking complete plumbing facilities: 19.4% Housing units lacking complete kitchen facilities: 14.2%
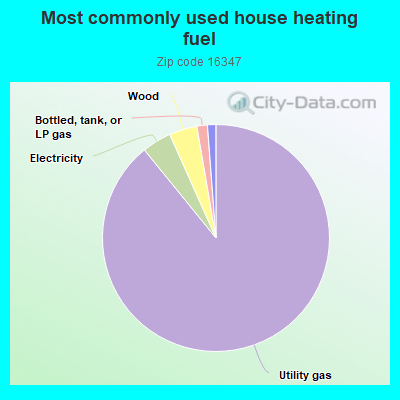
89.4%Utility gas
4.2%Electricity
4.0%Wood
1.5%Bottled, tank, or LP gas
1.2%Fuel oil, kerosene, etc.
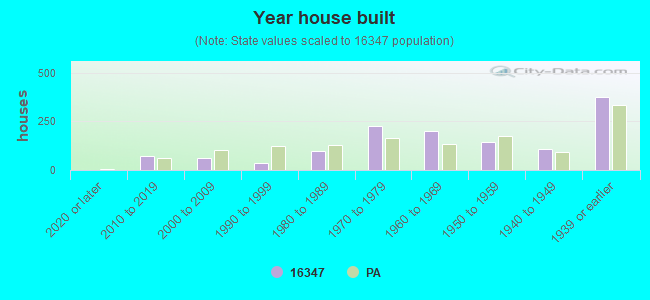
Population in 1990: 2,382. Population change in the 1990s: +56 (+2.4%).
Place of birth for U.S.-born residents:
This state: 1,368
Northeast: 59
Midwest: 4
South: 56
West: 32
67% of the 16347 zip code residents lived in the same house 5 years ago. Out of people who lived in different houses, 81% lived in this county. Out of people who lived in different counties, 50% lived in Pennsylvania.
95% of the 16347 zip code residents lived in the same house 1 year ago. Out of people who lived in different houses, 75% moved from this county. Out of people who lived in different houses, 25% moved from different county within same state. Out of people who lived in different houses, 2% moved from different state.
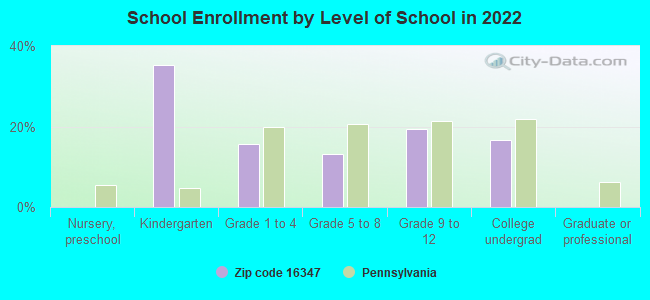
Private vs. public school enrollment:
Students in private schools in grades 1 to 8 (elementary and middle school):
Here:
0.0%
Pennsylvania:
15.7%
Students in private schools in grades 9 to 12 (high school): 7
Here:
13.7%
Pennsylvania:
13.4%
Students in private undergraduate colleges:
Here:
0.0%
Pennsylvania:
39.8%
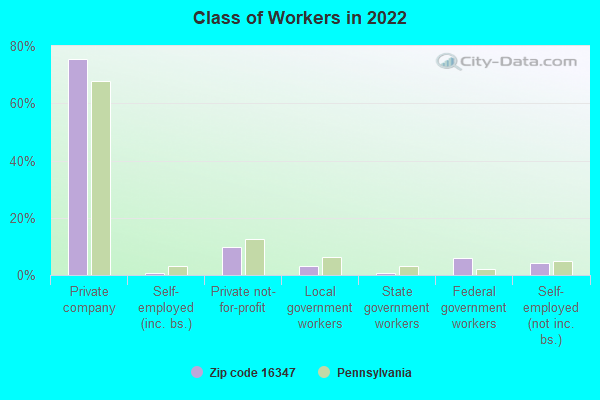
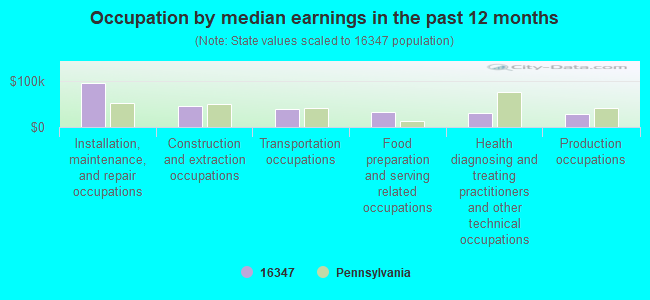
Occupation by median earnings in the past 12 months ($)
94,829Installation, maintenance, and repair occupations
46,100Construction and extraction occupations
39,380Transportation occupations
31,317Food preparation and serving related occupations
30,727Health diagnosing and treating practitioners and other technical occupations
28,687Production occupations
Companies with federal contracts located in this zip code:
LARRY HIGHHOUSE (AUSTIN HILL RD in SHEFFIELD, PA; small business)
$20,000 with Forest Service (disused code: now 12C2) for Tree Thinning Services. Signed on 2000-06-15. Completion date: 2000-11-15.
ROBERT SCHRECENGOST (316 HORTON AVE in SHEFFIELD, PA; small business)
$16,065 with Forest Service for Natural Resource Studies. Signed on 2003-09-15. Completion date: 2003-09-15.
Top industries in this zip code by the number of employees in 2005:
Health Care and Social Assistance: Homes for the Elderly (20-49 employees: 1 establishment)
Other Services (except Public Administration): Civic and Social Organizations (10-19: 1)
Arts, Entertainment, and Recreation: Bowling Centers (10-19: 1)
Utilities: Natural Gas Distribution (10-19: 1)
Other Services (except Public Administration): Religious Organizations (5-9: 1, 1-4: 3)
People in group quarters in 2000:
20 people in nursing homes
Fatal accident statistics in 2013:
Fatal accident count: 1
Vehicles involved in fatal accidents: 1
Fatal accidents caused by drunken drivers: 0
Fatalities: 1
Persons involved in fatal accidents: 2
Pedestrians involved in fatal accidents: 0
Fatal accident statistics in 2012:
Fatal accident count: 1
Vehicles involved in fatal accidents: 1
Fatal accidents caused by drunken drivers: 1
Fatalities: 1
Persons involved in fatal accidents: 1
Pedestrians involved in fatal accidents: 0
Most common first names in zip code 16347 among deceased individuals
Name
Count
Lived (average)
John
41
78.2 years
Robert
23
71.5 years
George
22
77.7 years
William
21
75.9 years
Mary
21
77.2 years
Helen
20
79.1 years
Joseph
18
75.9 years
Charles
17
75.3 years
Margaret
17
80.1 years
Anna
15
83.1 years
Most common last names in zip code 16347 among deceased individuals
Last name
Count
Lived (average)
Anderson
17
79.6 years
Johnson
15
73.6 years
Miller
15
71.4 years
Stanko
11
76.3 years
Peterson
10
82.3 years
Moore
10
82.0 years
Nelson
10
75.2 years
Henry
10
79.2 years
Carlson
10
70.0 years
Thomas
9
76.0 years
Discuss Sheffield, Pennsylvania (PA) on our hugely popular Pennsylvania forum.

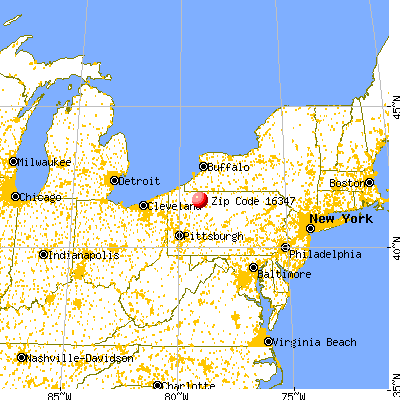


 Nearest zip codes: 16313, 16352, 16333, 16728, 16239, 16365.