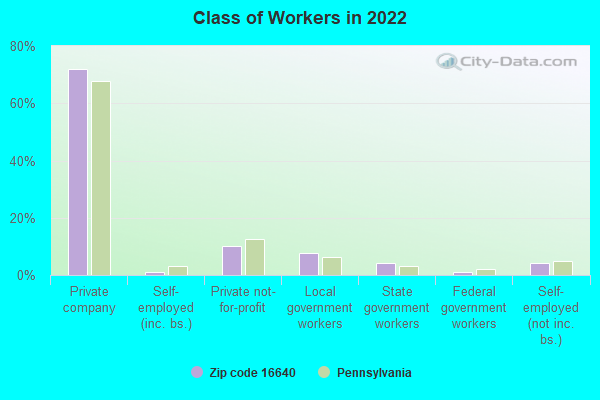
Estimated zip code population in 2022: 887 Zip code population in 2010: 817 Zip code population in 2000: 841
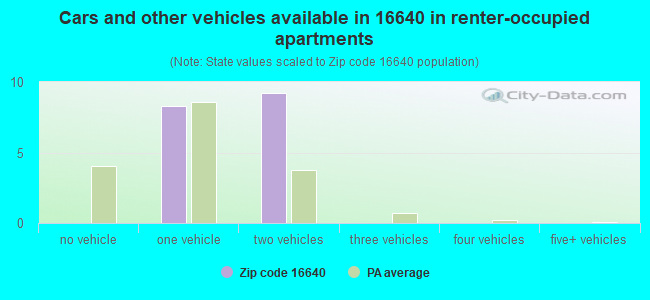
Houses and condos: 577 Renter-occupied apartments: 17
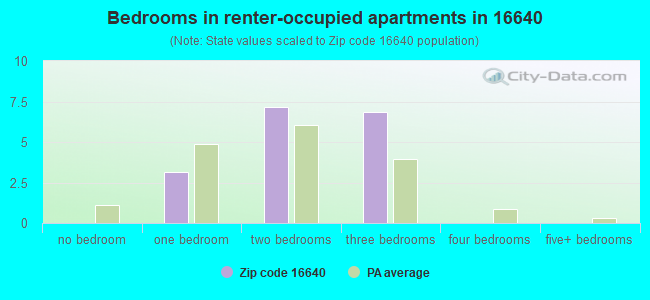
% of renters here:
5%
State:
31%
March 2022 cost of living index in zip code 16640: 91.9 (less than average, U.S. average is 100)
Land area: 13.2 sq. mi. Water area: 0.1 sq. mi.
Population density: 67 people per square mile
(very low).
OSM Map
General Map
Google Map
MSN Map
OSM Map
General Map
Google Map
MSN Map
OSM Map
General Map
Google Map
MSN Map
OSM Map
General Map
Google Map
MSN Map
Please wait while loading the map...
Real estate property taxes paid for housing units in 2022:
This zip code:
1.7% ($1,910)
Pennsylvania:
1.3% ($3,094)
Median real estate property taxes paid for housing units with mortgages in 2022: $2,135 (1.3%) Median real estate property taxes paid for housing units with no mortgage in 2022: $1,745 (2.1%)
Business Search- 14 Million verified businesses
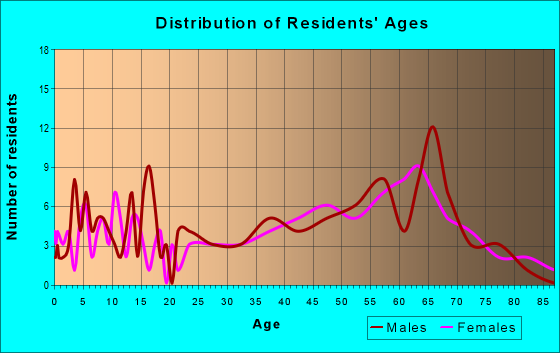
Males: 444
(50.0%)
Females: 443
(50.0%)
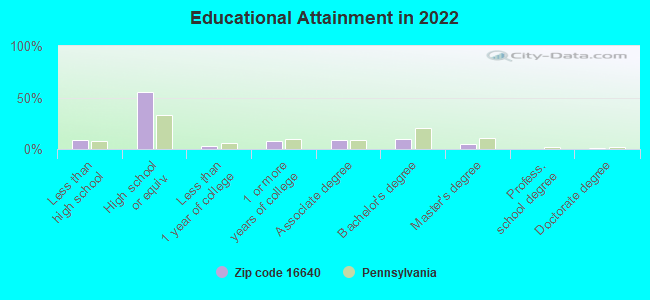
For population 25 years and over in 16640:
High school or higher: 88.8%
Bachelor's degree or higher: 15.2%
Graduate or professional degree: 6.0%
Unemployed: 3.5%
Mean travel time to work (commute): 43.6 minutes
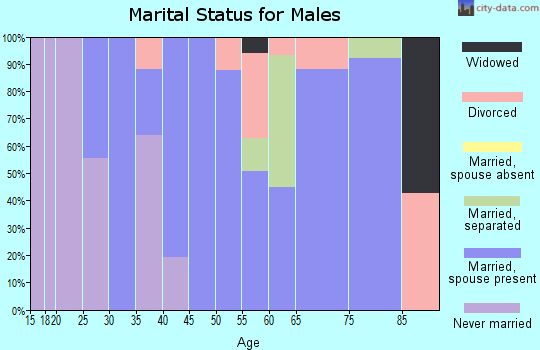
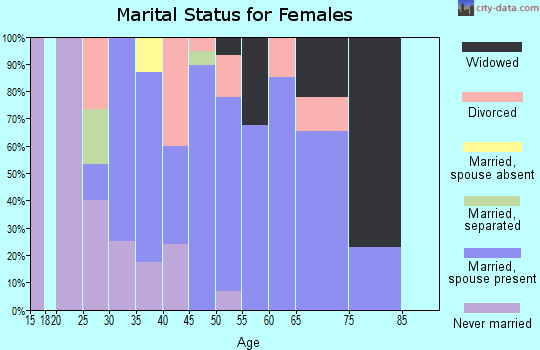
For population 15 years and over in 16640:
Never married: 25.8%
Now married: 52.3%
Separated: 0.7%
Widowed: 9.2%
Divorced: 12.1%
Zip code 16640 compared to state average:
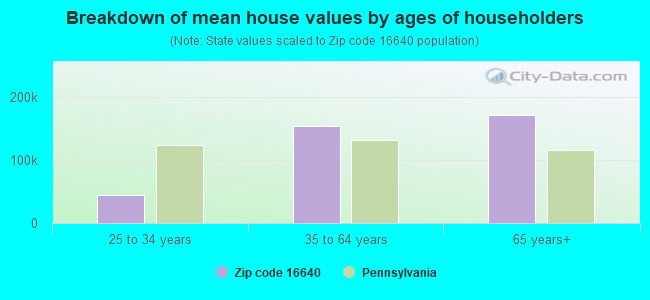
Median house value below state average.
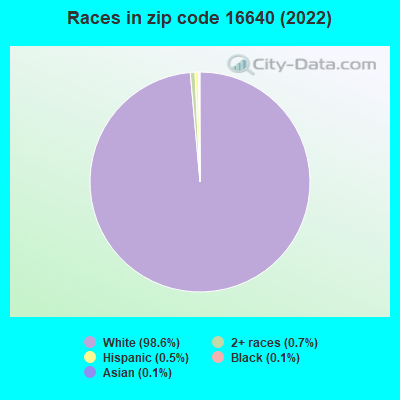
Black race population percentage significantly below state average.
Hispanic race population percentage significantly below state average.
Median age above state average.
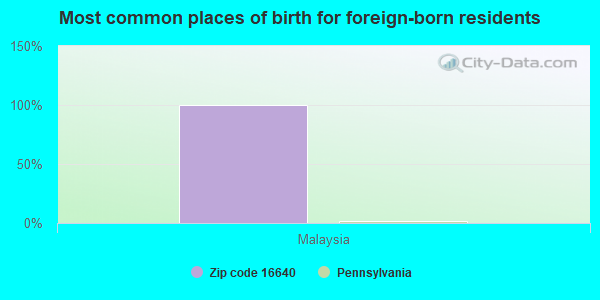
Foreign-born population percentage significantly below state average.
Renting percentage significantly below state average.
Length of stay since moving in significantly below state average.
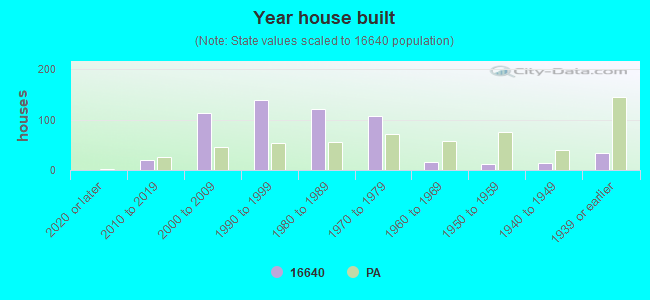
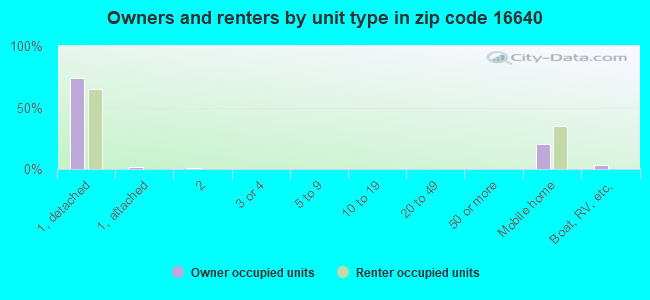
House age significantly below state average.
Percentage of population with a bachelor's degree or higher below state average.
Estimated median house/condo value in 2022: $114,176
16640:
$114,176
Pennsylvania:
$245,500
According to our research of Pennsylvania and other state lists, there were 5 registered sex offenders living in 16640 zip code as of April 27, 2024. The ratio of all residents to sex offenders in zip code 16640 is 159 to 1.
Median resident age:
This zip code:
46.9 years
Pennsylvania median age:
40.9 years
Average household size:
This zip code:
2.6 people
Pennsylvania:
2.4 people
Averages for the 2020 tax year for zip code 16640, filed in 2021:
Average Adjusted Gross Income (AGI) in 2020: $52,523 (Individual Income Tax Returns)
Here:
$52,523
State:
$75,707
Salary/wage: $47,679 (reported on 71.7% of returns)
Here:
$47,679
State:
$62,806
(% of AGI for various income ranges: 855.0% for AGIs below $25k, 2730.0% for AGIs $25k-50k, 4978.6% for AGIs $50k-75k, 9287.5% for AGIs $75k-100k, 14324.0% for AGIs $100k-200k)
Taxable interest for individuals: $423 (reported on 24.5% of returns)
This zip code:
$423
Pennsylvania:
$1,633
(% of AGI for various income ranges: 11.7% for AGIs below $25k, 28.6% for AGIs $50k-75k, 30.0% for AGIs $75k-100k, 18.0% for AGIs $100k-200k)
Ordinary dividends: $629 (reported on 13.2% of returns)
Here:
$629
State:
$7,382
(% of AGI for various income ranges: 28.0% for AGIs $25k-50k, 40.0% for AGIs $75k-100k)
Net capital gain/loss in AGI: +$4,480 (reported on 9.4% of returns)
Here:
+$4,480
State:
+$23,522
(% of AGI for various income ranges: 37.5% for AGIs below $25k, 447.5% for AGIs $75k-100k)
Profit/loss from business: +$10,420 (reported on 9.4% of returns)
Here:
+$10,420
State:
+$16,274
(% of AGI for various income ranges: 325.0% for AGIs $25k-50k, 490.0% for AGIs $75k-100k)
Taxable individual retirement arrangement distribution: $9,960 (reported on 9.4% of returns)
16640:
$9,960
Pennsylvania:
$18,583
(% of AGI for various income ranges: 233.3% for AGIs below $25k, 311.4% for AGIs $50k-75k)
Earned income credit: $2,180 (reported on 9.4% of returns)
Here:
$2,180
State:
$2,100
(% of AGI for various income ranges: 90.8% for AGIs below $25k)
Percentage of individuals using paid preparers for their 2020 taxes: 96.2%
Here:
96%
State:
92%
(% for various income ranges: 94.4% for AGIs below $25k, 100.0% for AGIs $25k-50k, 100.0% for AGIs $50k-75k, 100.0% for AGIs $75k-100k, 87.5% for AGIs $100k-200k)
Averages for the 2012 tax year for zip code 16640, filed in 2013:
Average Adjusted Gross Income (AGI) in 2012: $45,571 (Individual Income Tax Returns)
Here:
$45,571
State:
$61,346
Salary/wage: $41,176 (reported on 75.6% of returns)
Here:
$41,176
State:
$51,902
(% of AGI for various income ranges: 57.4% for AGIs below $25k, 69.9% for AGIs $25k-50k, 62.6% for AGIs $50k-75k, 78.0% for AGIs $75k-100k, 66.4% for AGIs $100k-200k)
Taxable interest for individuals: $364 (reported on 31.1% of returns)
This zip code:
$364
Pennsylvania:
$1,588
(% of AGI for various income ranges: 0.5% for AGIs below $25k, 0.3% for AGIs $25k-50k, 0.2% for AGIs $50k-75k, 0.2% for AGIs $75k-100k, 0.1% for AGIs $100k-200k)
Ordinary dividends: $717 (reported on 13.3% of returns)
Here:
$717
State:
$5,827
Net capital gain/loss in AGI: +$9,025 (reported on 8.9% of returns)
Here:
+$9,025
State:
+$14,495
Profit/loss from business: +$6,440 (reported on 11.1% of returns)
Here:
+$6,440
State:
+$16,268
Taxable individual retirement arrangement distribution: $10,325 (reported on 8.9% of returns)
16640:
$10,325
Pennsylvania:
$14,550
Total itemized deductions: $18,767 (20% of AGI, reported on 20.0% of returns)
Here:
$18,767
State:
$23,538
Here:
20.1% of AGI
State:
18.4% of AGI
(% of AGI for various income ranges: 15.0% for AGIs $25k-50k, 8.7% for AGIs $75k-100k, 11.4% for AGIs $100k-200k)
Charity contributions: $2,950 (reported on 13.3% of returns)
Here:
$2,950
State:
$4,025
Taxes paid: $6,222 (reported on 20.0% of returns)
16640:
$6,222
State:
$9,982
(% of AGI for various income ranges: 4.2% for AGIs $25k-50k, 2.9% for AGIs $75k-100k, 4.4% for AGIs $100k-200k)
Earned income credit: $2,243 (reported on 15.6% of returns)
Here:
$2,243
State:
$2,106
(% of AGI for various income ranges: 5.3% for AGIs below $25k, 1.2% for AGIs $25k-50k)
Percentage of individuals using paid preparers for their 2012 taxes: 62.2%
Here:
62%
State:
53%
(% for various income ranges: 58.8% for AGIs below $25k, 58.3% for AGIs $25k-50k, 66.7% for AGIs $50k-75k, 66.7% for AGIs $75k-100k, 75.0% for AGIs $100k-200k)
Averages for the 2004 tax year for zip code 16640, filed in 2005:
Average Adjusted Gross Income (AGI) in 2004: $34,870 (Individual Income Tax Returns)
Here:
$34,870
State:
$48,049
Salary/wage: $30,514 (reported on 81.3% of returns)
Here:
$30,514
State:
$42,646
(% of AGI for various income ranges: 68.8% for AGIs below $10k, 67.3% for AGIs $10k-25k, 76.1% for AGIs $25k-50k, 72.0% for AGIs $50k-75k, 79.3% for AGIs $75k-100k, 56.5% for AGIs over 100k)
Taxable interest for individuals: $773 (reported on 37.8% of returns)
This zip code:
$773
Pennsylvania:
$1,657
(% of AGI for various income ranges: 2.6% for AGIs below $10k, 2.5% for AGIs $10k-25k, 0.6% for AGIs $25k-50k, 0.6% for AGIs $50k-75k, 0.7% for AGIs $75k-100k)
Taxable dividends: $667 (reported on 15.5% of returns)
Here:
$667
State:
$3,566
(% of AGI for various income ranges: 0.8% for AGIs $10k-25k, 0.4% for AGIs $25k-50k, 0.1% for AGIs $50k-75k, 0.4% for AGIs $75k-100k)
Net capital gain/loss: +$800 (reported on 11.1% of returns)
Here:
+$800
State:
+$9,716
Profit/loss from business: +$8,532 (reported on 18.9% of returns)
Here:
+$8,532
State:
+$14,267
(% of AGI for various income ranges: 17.3% for AGIs below $10k, 7.2% for AGIs $10k-25k, 2.0% for AGIs $25k-50k, 8.3% for AGIs $50k-75k)
Total itemized deductions: $14,149 (23% of AGI, reported on 21.4% of returns)
Here:
$14,149
State:
$18,804
Here:
23.2% of AGI
State:
19.5% of AGI
Charity contributions deductions: $1,379 (2% of AGI, reported on 16.2% of returns)
Here:
$1,379
State:
$3,337
Here:
2.3% of AGI
State:
3.3% of AGI
Total tax: $4,260 (reported on 74.7% of returns)
16640:
$4,260
State:
$8,008
(% of AGI for various income ranges: 4.0% for AGIs below $10k, 3.8% for AGIs $10k-25k, 6.5% for AGIs $25k-50k, 10.0% for AGIs $50k-75k, 10.4% for AGIs $75k-100k, 16.2% for AGIs over 100k)
Earned income credit: $1,636 (reported on 18.9% of returns)
Here:
$1,636
State:
$1,643
Percentage of individuals using paid preparers for their 2004 taxes: 67.3%
Here:
67%
State:
56%
(% for various income ranges: 57.4% for AGIs below $10k, 64.4% for AGIs $10k-25k, 74.2% for AGIs $25k-50k, 73.0% for AGIs $50k-75k, 66.7% for AGIs $75k-100k, 85.7% for AGIs over 100k)
Household received Food Stamps/SNAP in the past 12 months: 57 Household did not receive Food Stamps/SNAP in the past 12 months: 284
Women who had a birth in the past 12 months: 8 (1 now married, 6 unmarried) Women who did not have a birth in the past 12 months: 144 (61 now married, 82 unmarried)
Housing units in zip code 16640 with a mortgage: 149 (12 second mortgage, 11 both second mortgage and home equity loan) Houses without a mortgage: 3
Median monthly owner costs for units with a mortgage: $1,133 Median monthly owner costs for units without a mortgage: $545
Residents with income below the poverty level in 2022:
This zip code:
23.2%
Whole state:
11.8%
Residents with income below 50% of the poverty level in 2022:
This zip code:
15.5%
Whole state:
6.1%
Median number of rooms in houses and condos:
Here:
5.3
State:
6.8
Median number of rooms in apartments:
Here:
5.6
State:
4.3
Notable locations in this zip code not listed on our city pages
Size of family households: 115 2-persons, 59 3-persons, 34 4-persons, 21 5-persons, 3 6-persons, 5 7-or-more-persons
Size of nonfamily households: 83 1-person, 17 2-persons
105 married couples with children.
41 single-parent households (41 women).
99.2% of residents of 16640 zip code speak English at home.
0.5% of residents speak Spanish at home (100% very well).
Foreign born population: 2 (0.2%) (100.0% of them are naturalized citizens)
This zip code:
0.2%
Whole state:
7.5%
100%Malaysia
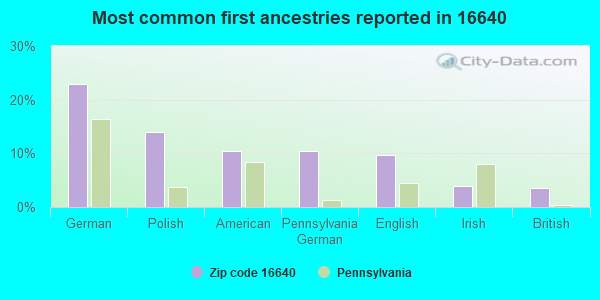
23%German
14%Polish
10%American
10%Pennsylvania German
10%English
4%Irish
3%British
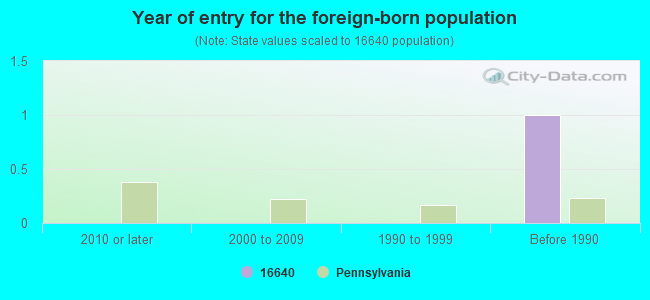
Year of entry for the foreign-born population
02010 or later
02000 to 2009
01990 to 1999
1Before 1990
Housing units lacking complete plumbing facilities: 4.5% Housing units lacking complete kitchen facilities: 5.2%
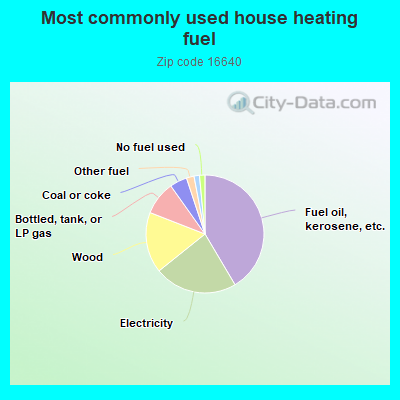
41.8%Fuel oil, kerosene, etc.
22.9%Electricity
16.8%Wood
9.3%Bottled, tank, or LP gas
4.8%Coal or coke
2.1%Other fuel
1.5%Utility gas
1.5%No fuel used
Population in 1990: 1,589.
Place of birth for U.S.-born residents:
This state: 789
Northeast: 21
Midwest: 17
South: 49
West: 1
68% of the 16640 zip code residents lived in the same house 5 years ago. Out of people who lived in different houses, 47% lived in this county. Out of people who lived in different counties, 50% lived in Pennsylvania.
87% of the 16640 zip code residents lived in the same house 1 year ago. Out of people who lived in different houses, 22% moved from this county. Out of people who lived in different houses, 74% moved from different county within same state.
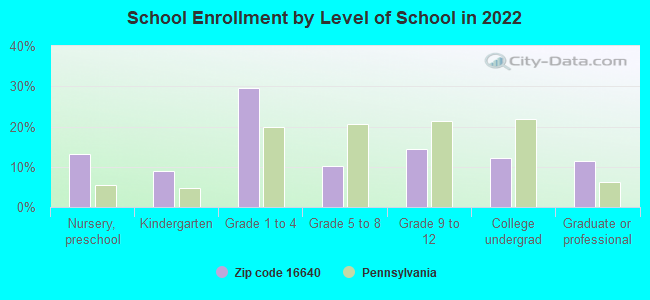
Private vs. public school enrollment:
Students in private schools in grades 1 to 8 (elementary and middle school): 3
Here:
4.9%
Pennsylvania:
15.7%
Students in private schools in grades 9 to 12 (high school):
Here:
0.0%
Pennsylvania:
13.4%
Students in private undergraduate colleges: 8
Here:
43.3%
Pennsylvania:
39.8%
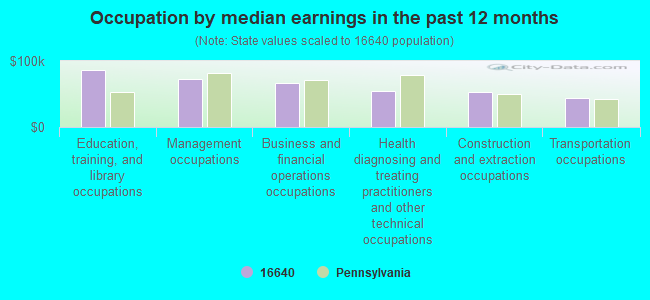
Occupation by median earnings in the past 12 months ($)
86,733Education, training, and library occupations
72,529Management occupations
67,345Business and financial operations occupations
53,926Health diagnosing and treating practitioners and other technical occupations
53,697Construction and extraction occupations
43,912Transportation occupations
Top industries in this zip code by the number of employees in 2005:
Construction: New Housing Operative Builders (10-19 employees: 1 establishment)
Real Estate and Rental and Leasing: Video Tape and Disc Rental (10-19: 1)
Utilities: Water Supply and Irrigation Systems (5-9: 1)
Professional, Scientific, and Technical Services: Other Accounting Services (5-9: 1)
Utilities: Sewage Treatment Facilities (5-9: 1)
Real Estate and Rental and Leasing: Nonresidential Property Managers (5-9: 1)
Accommodation and Food Services: Full-Service Restaurants (5-9: 1)
Construction: Power and Communication Line and Related Structures Construction (1-4: 1)
People in group quarters in 2000:
14 people in homes or halfway houses for drug/alcohol abuse
Fatal accident statistics in 2012:
Fatal accident count: 2
Vehicles involved in fatal accidents: 2
Fatal accidents caused by drunken drivers: 1
Fatalities: 2
Persons involved in fatal accidents: 2
Pedestrians involved in fatal accidents: 0
Fatal accident statistics in 2011:
Fatal accident count: 1
Vehicles involved in fatal accidents: 1
Fatal accidents caused by drunken drivers: 0
Fatalities: 1
Persons involved in fatal accidents: 1
Pedestrians involved in fatal accidents: 0
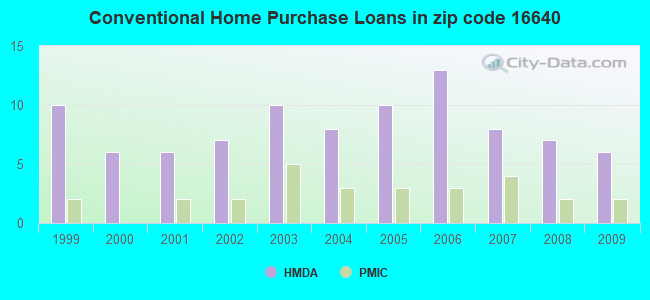
Home Mortgage Disclosure Act Aggregated Statistics For Year 2009 (Based on 2 partial tracts)
A) FHA, FSA/RHS & VA Home Purchase Loans
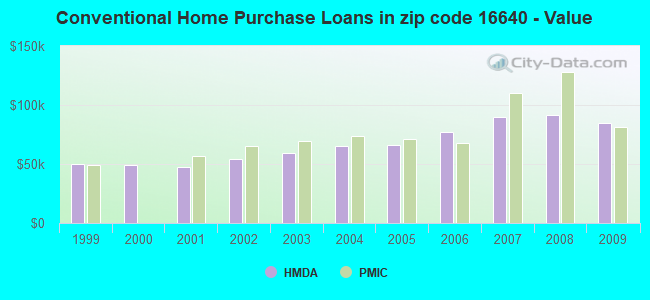
B) Conventional Home Purchase Loans
C) Refinancings
D) Home Improvement Loans
F) Non-occupant Loans on < 5 Family Dwellings (A B C & D)
G) Loans On Manufactured Home Dwelling (A B C & D)
Number
Average Value
Number
Average Value
Number
Average Value
Number
Average Value
Number
Average Value
Number
Average Value
LOANS ORIGINATED
1
$100,670
6
$84,597
8
$99,704
2
$12,670
2
$70,400
2
$43,295
APPLICATIONS APPROVED, NOT ACCEPTED
0
$0
0
$0
1
$98,910
1
$11,620
0
$0
0
$0
APPLICATIONS DENIED
0
$0
3
$84,713
5
$110,668
2
$33,265
1
$154,880
2
$49,630
APPLICATIONS WITHDRAWN
0
$0
1
$34,140
2
$90,110
0
$0
0
$0
1
$111,940
FILES CLOSED FOR INCOMPLETENESS
0
$0
0
$0
0
$0
0
$0
0
$0
0
$0
Aggregated Statistics For Year 2008 (Based on 2 partial tracts)
A) FHA, FSA/RHS & VA Home Purchase Loans
B) Conventional Home Purchase Loans
C) Refinancings
D) Home Improvement Loans
F) Non-occupant Loans on < 5 Family Dwellings (A B C & D)
G) Loans On Manufactured Home Dwelling (A B C & D)
Number
Average Value
Number
Average Value
Number
Average Value
Number
Average Value
Number
Average Value
Number
Average Value
LOANS ORIGINATED
1
$72,510
7
$91,620
10
$89,021
6
$20,240
4
$89,408
2
$61,425
APPLICATIONS APPROVED, NOT ACCEPTED
0
$0
1
$136,220
2
$54,560
0
$0
0
$0
1
$74,620
APPLICATIONS DENIED
1
$126,370
3
$84,713
12
$81,752
5
$43,084
2
$84,830
3
$67,113
APPLICATIONS WITHDRAWN
1
$65,820
1
$55,620
6
$117,803
1
$46,110
1
$27,460
1
$87,300
FILES CLOSED FOR INCOMPLETENESS
0
$0
0
$0
0
$0
0
$0
0
$0
0
$0
Aggregated Statistics For Year 2007 (Based on 2 partial tracts)
A) FHA, FSA/RHS & VA Home Purchase Loans
B) Conventional Home Purchase Loans
C) Refinancings
D) Home Improvement Loans
F) Non-occupant Loans on < 5 Family Dwellings (A B C & D)
G) Loans On Manufactured Home Dwelling (A B C & D)
Number
Average Value
Number
Average Value
Number
Average Value
Number
Average Value
Number
Average Value
Number
Average Value
LOANS ORIGINATED
1
$79,200
8
$89,892
10
$75,258
4
$47,872
1
$158,400
2
$55,790
APPLICATIONS APPROVED, NOT ACCEPTED
0
$0
4
$62,392
3
$52,567
1
$33,790
1
$31,680
1
$76,380
APPLICATIONS DENIED
0
$0
4
$46,288
18
$71,123
4
$60,192
0
$0
2
$75,150
APPLICATIONS WITHDRAWN
0
$0
1
$59,840
4
$95,040
0
$0
0
$0
0
$0
FILES CLOSED FOR INCOMPLETENESS
0
$0
0
$0
1
$175,300
0
$0
0
$0
0
$0
Aggregated Statistics For Year 2006 (Based on 2 partial tracts)
A) FHA, FSA/RHS & VA Home Purchase Loans
B) Conventional Home Purchase Loans
C) Refinancings
D) Home Improvement Loans
F) Non-occupant Loans on < 5 Family Dwellings (A B C & D)
G) Loans On Manufactured Home Dwelling (A B C & D)
Number
Average Value
Number
Average Value
Number
Average Value
Number
Average Value
Number
Average Value
Number
Average Value
LOANS ORIGINATED
2
$84,130
13
$77,196
10
$68,253
8
$31,020
2
$80,960
4
$51,480
APPLICATIONS APPROVED, NOT ACCEPTED
0
$0
2
$86,240
2
$56,145
1
$17,600
0
$0
1
$46,110
APPLICATIONS DENIED
1
$43,650
2
$51,215
14
$85,234
7
$44,251
1
$58,430
2
$32,030
APPLICATIONS WITHDRAWN
0
$0
1
$33,440
7
$72,461
1
$103,490
0
$0
1
$54,560
FILES CLOSED FOR INCOMPLETENESS
0
$0
0
$0
0
$0
0
$0
0
$0
0
$0
Aggregated Statistics For Year 2005 (Based on 2 partial tracts)
B) Conventional Home Purchase Loans
C) Refinancings
D) Home Improvement Loans
F) Non-occupant Loans on < 5 Family Dwellings (A B C & D)
G) Loans On Manufactured Home Dwelling (A B C & D)
Number
Average Value
Number
Average Value
Number
Average Value
Number
Average Value
Number
Average Value
LOANS ORIGINATED
10
$65,930
16
$66,616
6
$33,617
2
$64,945
5
$56,180
APPLICATIONS APPROVED, NOT ACCEPTED
3
$66,177
2
$69,345
0
$0
0
$0
0
$0
APPLICATIONS DENIED
6
$59,547
24
$85,448
7
$39,726
1
$1,060
7
$57,677
APPLICATIONS WITHDRAWN
3
$64,650
12
$78,789
1
$120,030
1
$86,940
1
$24,640
FILES CLOSED FOR INCOMPLETENESS
0
$0
3
$76,620
0
$0
0
$0
0
$0
Aggregated Statistics For Year 2004 (Based on 2 partial tracts)
B) Conventional Home Purchase Loans
C) Refinancings
D) Home Improvement Loans
F) Non-occupant Loans on < 5 Family Dwellings (A B C & D)
G) Loans On Manufactured Home Dwelling (A B C & D)
Number
Average Value
Number
Average Value
Number
Average Value
Number
Average Value
Number
Average Value
LOANS ORIGINATED
8
$65,340
17
$57,811
6
$37,840
1
$73,220
3
$49,397
APPLICATIONS APPROVED, NOT ACCEPTED
2
$73,920
4
$67,145
2
$16,720
0
$0
1
$79,200
APPLICATIONS DENIED
5
$53,716
25
$63,106
6
$23,173
1
$43,650
5
$50,688
APPLICATIONS WITHDRAWN
1
$86,590
13
$67,178
2
$45,585
1
$44,000
3
$53,270
FILES CLOSED FOR INCOMPLETENESS
0
$0
4
$76,912
0
$0
0
$0
0
$0
Aggregated Statistics For Year 2003 (Based on 2 partial tracts)
B) Conventional Home Purchase Loans
C) Refinancings
D) Home Improvement Loans
F) Non-occupant Loans on < 5 Family Dwellings (A B C & D)
Number
Average Value
Number
Average Value
Number
Average Value
Number
Average Value
LOANS ORIGINATED
10
$59,594
26
$58,825
4
$26,575
1
$38,720
APPLICATIONS APPROVED, NOT ACCEPTED
1
$51,740
6
$64,885
1
$21,470
0
$0
APPLICATIONS DENIED
2
$59,310
22
$57,744
6
$25,050
0
$0
APPLICATIONS WITHDRAWN
0
$0
10
$62,867
0
$0
0
$0
FILES CLOSED FOR INCOMPLETENESS
0
$0
2
$83,775
0
$0
0
$0
Aggregated Statistics For Year 2002 (Based on 2 partial tracts)
A) FHA, FSA/RHS & VA Home Purchase Loans
B) Conventional Home Purchase Loans
C) Refinancings
D) Home Improvement Loans
F) Non-occupant Loans on < 5 Family Dwellings (A B C & D)
Number
Average Value
Number
Average Value
Number
Average Value
Number
Average Value
Number
Average Value
LOANS ORIGINATED
1
$71,460
7
$54,157
15
$1,905,470
3
$16,660
1
$27,763,650
APPLICATIONS APPROVED, NOT ACCEPTED
0
$0
1
$22,530
4
$69,608
1
$28,510
0
$0
APPLICATIONS DENIED
0
$0
5
$42,592
14
$48,023
1
$22,880
1
$20,770
APPLICATIONS WITHDRAWN
0
$0
1
$85,180
8
$56,144
0
$0
0
$0
FILES CLOSED FOR INCOMPLETENESS
0
$0
0
$0
2
$62,130
0
$0
0
$0
Aggregated Statistics For Year 2001 (Based on 2 partial tracts)
A) FHA, FSA/RHS & VA Home Purchase Loans
B) Conventional Home Purchase Loans
C) Refinancings
D) Home Improvement Loans
F) Non-occupant Loans on < 5 Family Dwellings (A B C & D)
Number
Average Value
Number
Average Value
Number
Average Value
Number
Average Value
Number
Average Value
LOANS ORIGINATED
1
$81,660
6
$47,168
14
$46,590
4
$12,935
1
$23,230
APPLICATIONS APPROVED, NOT ACCEPTED
0
$0
1
$49,630
4
$50,952
0
$0
0
$0
APPLICATIONS DENIED
0
$0
4
$44,175
13
$37,177
4
$19,888
0
$0
APPLICATIONS WITHDRAWN
0
$0
0
$0
9
$45,096
1
$10,910
1
$40,830
FILES CLOSED FOR INCOMPLETENESS
0
$0
0
$0
2
$66,705
0
$0
0
$0
Aggregated Statistics For Year 2000 (Based on 2 partial tracts)
A) FHA, FSA/RHS & VA Home Purchase Loans
B) Conventional Home Purchase Loans
C) Refinancings
D) Home Improvement Loans
Number
Average Value
Number
Average Value
Number
Average Value
Number
Average Value
LOANS ORIGINATED
1
$48,580
6
$49,163
7
$38,167
7
$10,209
APPLICATIONS APPROVED, NOT ACCEPTED
0
$0
2
$35,025
5
$43,508
3
$8,683
APPLICATIONS DENIED
0
$0
3
$36,373
11
$36,736
7
$12,420
APPLICATIONS WITHDRAWN
0
$0
1
$72,160
5
$26,612
1
$9,860
FILES CLOSED FOR INCOMPLETENESS
0
$0
0
$0
0
$0
0
$0
Aggregated Statistics For Year 1999 (Based on 2 partial tracts)
A) FHA, FSA/RHS & VA Home Purchase Loans
B) Conventional Home Purchase Loans
C) Refinancings
D) Home Improvement Loans
F) Non-occupant Loans on < 5 Family Dwellings (A B C & D)


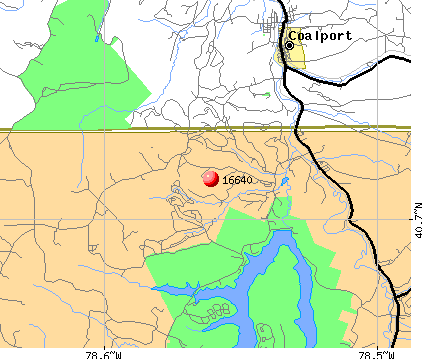 Nearest zip codes: 16668, 16627, 16656, 15753, 16645, 16639.