Estimated zip code population in 2022: 5,857 Zip code population in 2010: 5,813 Zip code population in 2000: 5,324
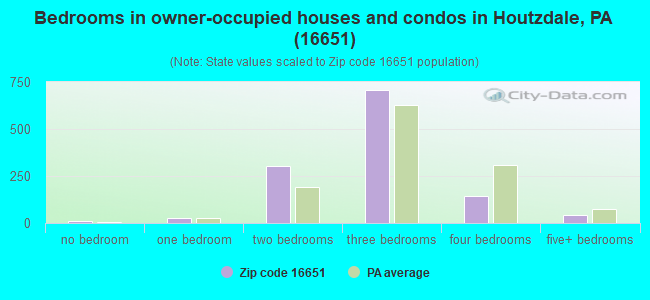
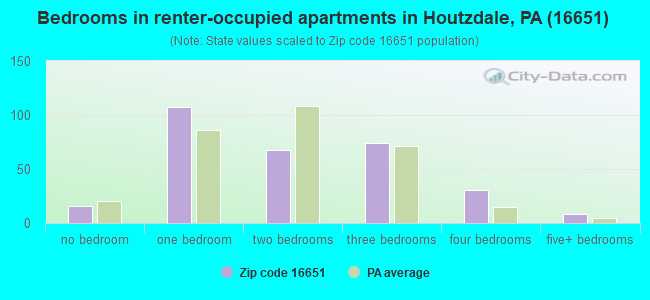
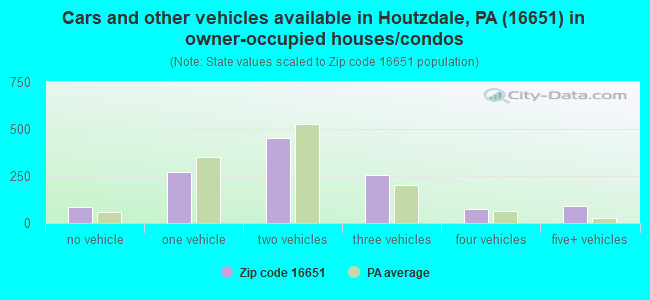
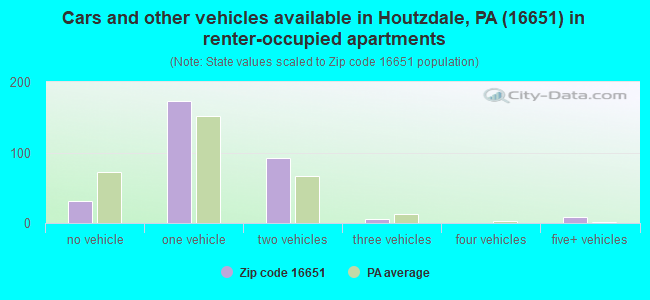
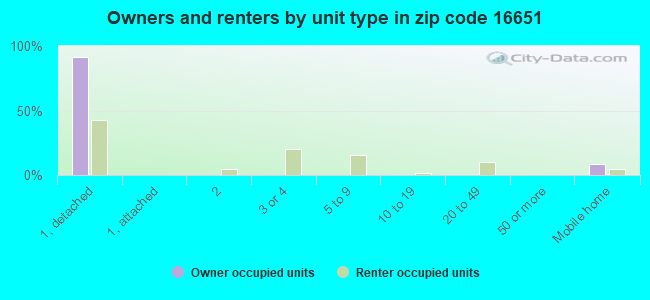
Houses and condos: 1,836 Renter-occupied apartments: 305
% of renters here:
20%
State:
31%
March 2022 cost of living index in zip code 16651: 81.0 (low, U.S. average is 100)
Land area: 42.4 sq. mi. Water area: 0.3 sq. mi.
Population density: 138 people per square mile
(very low).
OSM Map
General Map
Google Map
MSN Map
OSM Map
General Map
Google Map
MSN Map
OSM Map
General Map
Google Map
MSN Map
OSM Map
General Map
Google Map
MSN Map
Please wait while loading the map...
Real estate property taxes paid for housing units in 2022:
This zip code:
0.9% ($938)
Pennsylvania:
1.3% ($3,094)
Median real estate property taxes paid for housing units with mortgages in 2022: $983 (0.9%) Median real estate property taxes paid for housing units with no mortgage in 2022: $862 (0.9%)
Business Search- 14 Million verified businesses
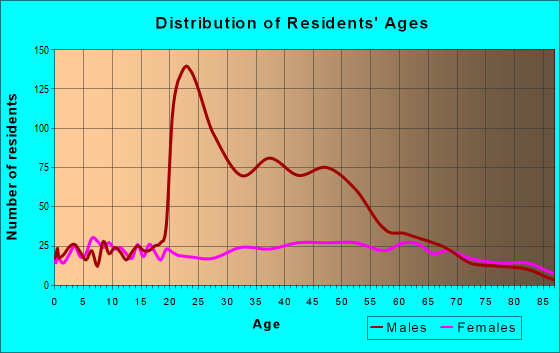
Males: 4,055
(69.2%)
Females: 1,801
(30.8%)
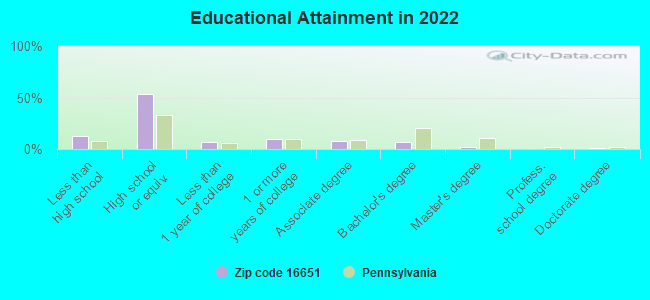
For population 25 years and over in 16651:
High school or higher: 86.0%
Bachelor's degree or higher: 9.1%
Graduate or professional degree: 2.7%
Unemployed: 4.7%
Mean travel time to work (commute): 32.5 minutes
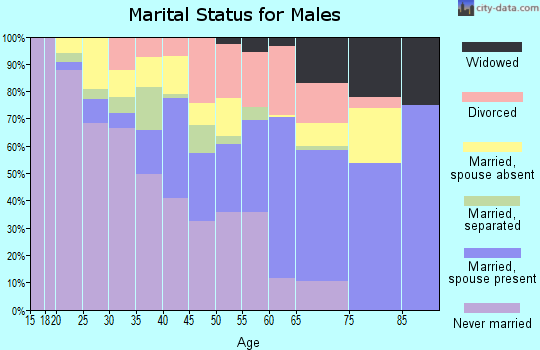
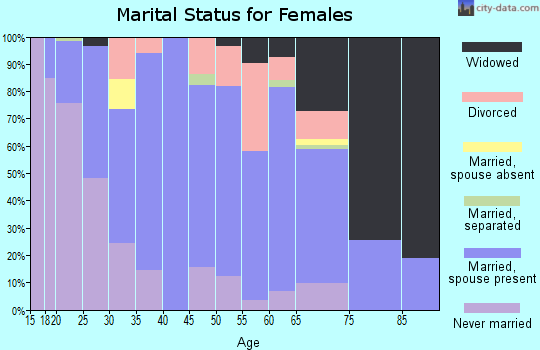
For population 15 years and over in 16651:
Never married: 38.8%
Now married: 37.6%
Separated: 4.0%
Widowed: 6.6%
Divorced: 12.9%
Zip code 16651 compared to state average:
Median house value significantly below state average.
Foreign-born population percentage significantly below state average.
Renting percentage below state average.
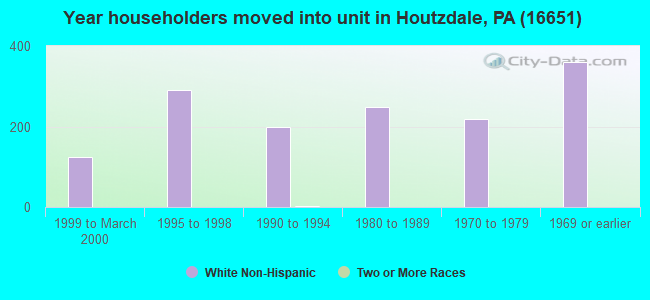
Length of stay since moving in above state average.
Number of college students below state average.
Percentage of population with a bachelor's degree or higher significantly below state average.
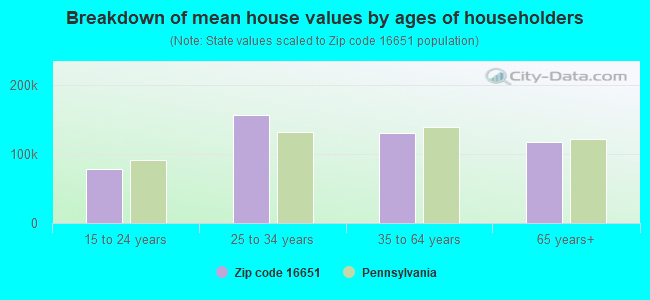
Estimated median house/condo value in 2022: $103,214
16651:
$103,214
Pennsylvania:
$245,500
According to our research of Pennsylvania and other state lists, there were 6 registered sex offenders living in 16651 zip code as of April 26, 2024. The ratio of all residents to sex offenders in zip code 16651 is 1,003 to 1. The ratio of registered sex offenders to all residents in this zip code is lower than the state average.
Median resident age:
This zip code:
43.9 years
Pennsylvania median age:
40.9 years
Average household size:
This zip code:
2.3 people
Pennsylvania:
2.4 people
Averages for the 2020 tax year for zip code 16651, filed in 2021:
Average Adjusted Gross Income (AGI) in 2020: $52,346 (Individual Income Tax Returns)
Here:
$52,346
State:
$75,707
Salary/wage: $48,008 (reported on 80.3% of returns)
Here:
$48,008
State:
$62,806
(% of AGI for various income ranges: 955.0% for AGIs below $25k, 3274.4% for AGIs $25k-50k, 5805.3% for AGIs $50k-75k, 8445.4% for AGIs $75k-100k, 14943.8% for AGIs $100k-200k)
Taxable interest for individuals: $585 (reported on 30.6% of returns)
This zip code:
$585
Pennsylvania:
$1,633
(% of AGI for various income ranges: 15.6% for AGIs below $25k, 15.3% for AGIs $25k-50k, 29.5% for AGIs $50k-75k, 17.7% for AGIs $75k-100k, 58.8% for AGIs $100k-200k)
Ordinary dividends: $2,058 (reported on 15.3% of returns)
Here:
$2,058
State:
$7,382
(% of AGI for various income ranges: 13.3% for AGIs below $25k, 25.9% for AGIs $25k-50k, 12.1% for AGIs $50k-75k, 34.6% for AGIs $75k-100k, 181.2% for AGIs $100k-200k)
Net capital gain/loss in AGI: +$5,413 (reported on 9.6% of returns)
Here:
+$5,413
State:
+$23,522
(% of AGI for various income ranges: 13.3% for AGIs below $25k, 50.3% for AGIs $25k-50k, 84.6% for AGIs $75k-100k, 301.9% for AGIs $100k-200k)
Profit/loss from business: +$6,479 (reported on 8.9% of returns)
Here:
+$6,479
State:
+$16,274
(% of AGI for various income ranges: 82.2% for AGIs below $25k, 55.6% for AGIs $25k-50k, 136.8% for AGIs $50k-75k, 101.2% for AGIs $100k-200k)
Taxable individual retirement arrangement distribution: $13,335 (reported on 10.8% of returns)
16651:
$13,335
Pennsylvania:
$18,583
(% of AGI for various income ranges: 86.9% for AGIs below $25k, 51.8% for AGIs $25k-50k, 283.7% for AGIs $50k-75k, 774.4% for AGIs $100k-200k)
Earned income credit: $2,338 (reported on 13.4% of returns)
Here:
$2,338
State:
$2,100
(% of AGI for various income ranges: 90.3% for AGIs below $25k, 48.8% for AGIs $25k-50k)
Percentage of individuals using paid preparers for their 2020 taxes: 94.9%
Here:
95%
State:
92%
(% for various income ranges: 94.2% for AGIs below $25k, 95.1% for AGIs $25k-50k, 92.0% for AGIs $50k-75k, 100.0% for AGIs $75k-100k, 104.8% for AGIs $100k-200k, 0.0% for AGIs over 200k)
Averages for the 2012 tax year for zip code 16651, filed in 2013:
Average Adjusted Gross Income (AGI) in 2012: $40,422 (Individual Income Tax Returns)
Here:
$40,422
State:
$61,346
Salary/wage: $38,134 (reported on 80.5% of returns)
Here:
$38,134
State:
$51,902
(% of AGI for various income ranges: 68.4% for AGIs below $25k, 76.9% for AGIs $25k-50k, 80.1% for AGIs $50k-75k, 76.2% for AGIs $75k-100k, 74.9% for AGIs $100k-200k)
Taxable interest for individuals: $1,085 (reported on 36.0% of returns)
This zip code:
$1,085
Pennsylvania:
$1,588
(% of AGI for various income ranges: 2.0% for AGIs below $25k, 1.3% for AGIs $25k-50k, 0.4% for AGIs $50k-75k, 0.6% for AGIs $75k-100k, 0.9% for AGIs $100k-200k)
Ordinary dividends: $1,304 (reported on 17.1% of returns)
Here:
$1,304
State:
$5,827
(% of AGI for various income ranges: 0.7% for AGIs below $25k, 0.5% for AGIs $25k-50k, 0.3% for AGIs $50k-75k, 0.4% for AGIs $75k-100k, 0.8% for AGIs $100k-200k)
Net capital gain/loss in AGI: +$2,825 (reported on 7.3% of returns)
Here:
+$2,825
State:
+$14,495
(% of AGI for various income ranges: 0.2% for AGIs $25k-50k, 0.3% for AGIs $50k-75k, 1.5% for AGIs $100k-200k)
Profit/loss from business: +$5,841 (reported on 10.4% of returns)
Here:
+$5,841
State:
+$16,268
(% of AGI for various income ranges: 4.2% for AGIs below $25k, 1.5% for AGIs $25k-50k, 0.3% for AGIs $50k-75k, 3.6% for AGIs $75k-100k)
Taxable individual retirement arrangement distribution: $8,935 (reported on 10.4% of returns)
16651:
$8,935
Pennsylvania:
$14,550
(% of AGI for various income ranges: 3.5% for AGIs below $25k, 2.1% for AGIs $25k-50k, 1.9% for AGIs $50k-75k, 6.0% for AGIs $75k-100k)
Total itemized deductions: $16,309 (21% of AGI, reported on 13.4% of returns)
Here:
$16,309
State:
$23,538
Here:
20.5% of AGI
State:
18.4% of AGI
(% of AGI for various income ranges: 4.2% for AGIs $25k-50k, 4.8% for AGIs $50k-75k, 7.6% for AGIs $75k-100k, 8.5% for AGIs $100k-200k)
Charity contributions: $2,246 (reported on 7.9% of returns)
Here:
$2,246
State:
$4,025
(% of AGI for various income ranges: 0.4% for AGIs below $25k, 0.5% for AGIs $50k-75k, 0.8% for AGIs $75k-100k, 0.7% for AGIs $100k-200k)
Taxes paid: $4,695 (reported on 13.4% of returns)
16651:
$4,695
State:
$9,982
(% of AGI for various income ranges: 0.9% for AGIs $25k-50k, 1.2% for AGIs $50k-75k, 2.3% for AGIs $75k-100k, 2.8% for AGIs $100k-200k)
Earned income credit: $1,975 (reported on 17.1% of returns)
Here:
$1,975
State:
$2,106
(% of AGI for various income ranges: 5.0% for AGIs below $25k, 0.9% for AGIs $25k-50k)
Percentage of individuals using paid preparers for their 2012 taxes: 59.1%
Here:
59%
State:
53%
(% for various income ranges: 53.5% for AGIs below $25k, 60.5% for AGIs $25k-50k, 60.0% for AGIs $50k-75k, 66.7% for AGIs $75k-100k, 76.9% for AGIs $100k-200k)
Averages for the 2004 tax year for zip code 16651, filed in 2005:
Average Adjusted Gross Income (AGI) in 2004: $32,547 (Individual Income Tax Returns)
Here:
$32,547
State:
$48,049
Salary/wage: $30,761 (reported on 83.1% of returns)
Here:
$30,761
State:
$42,646
(% of AGI for various income ranges: 95.7% for AGIs below $10k, 65.9% for AGIs $10k-25k, 81.9% for AGIs $25k-50k, 83.4% for AGIs $50k-75k, 83.6% for AGIs $75k-100k, 59.0% for AGIs over 100k)
Taxable interest for individuals: $1,252 (reported on 42.8% of returns)
This zip code:
$1,252
Pennsylvania:
$1,657
(% of AGI for various income ranges: 9.0% for AGIs below $10k, 2.6% for AGIs $10k-25k, 1.5% for AGIs $25k-50k, 1.1% for AGIs $50k-75k, 0.6% for AGIs $75k-100k, 2.0% for AGIs over 100k)
Taxable dividends: $1,027 (reported on 22.8% of returns)
Here:
$1,027
State:
$3,566
(% of AGI for various income ranges: 6.7% for AGIs below $10k, 0.8% for AGIs $10k-25k, 0.6% for AGIs $25k-50k, 0.3% for AGIs $50k-75k, 0.1% for AGIs $75k-100k, 1.6% for AGIs over 100k)
Net capital gain/loss: +$436 (reported on 14.0% of returns)
Here:
+$436
State:
+$9,716
(% of AGI for various income ranges: -3.7% for AGIs below $10k, 1.1% for AGIs $10k-25k, 0.4% for AGIs $25k-50k, -0.1% for AGIs $50k-75k, 0.1% for AGIs $75k-100k, 0.2% for AGIs over 100k)
Profit/loss from business: +$5,540 (reported on 12.1% of returns)
Here:
+$5,540
State:
+$14,267
(% of AGI for various income ranges: 4.4% for AGIs below $10k, 5.4% for AGIs $10k-25k, 1.2% for AGIs $25k-50k, -0.1% for AGIs $50k-75k, 6.5% for AGIs $75k-100k)
IRA payment deduction: $2,667 (reported on 2.5% of returns)
16651:
$2,667
Pennsylvania:
$2,903
Total itemized deductions: $13,734 (21% of AGI, reported on 12.6% of returns)
Here:
$13,734
State:
$18,804
Here:
21.1% of AGI
State:
19.5% of AGI
(% of AGI for various income ranges: 3.1% for AGIs $10k-25k, 4.2% for AGIs $25k-50k, 6.0% for AGIs $50k-75k, 8.4% for AGIs $75k-100k, 7.8% for AGIs over 100k)
Charity contributions deductions: $2,021 (3% of AGI, reported on 9.7% of returns)
Here:
$2,021
State:
$3,337
Here:
2.8% of AGI
State:
3.3% of AGI
(% of AGI for various income ranges: 0.9% for AGIs below $10k, 0.5% for AGIs $25k-50k, 0.5% for AGIs $50k-75k, 1.1% for AGIs $75k-100k, 1.6% for AGIs over 100k)
Total tax: $3,691 (reported on 73.3% of returns)
16651:
$3,691
State:
$8,008
(% of AGI for various income ranges: 3.0% for AGIs below $10k, 4.2% for AGIs $10k-25k, 6.7% for AGIs $25k-50k, 8.5% for AGIs $50k-75k, 10.6% for AGIs $75k-100k, 17.7% for AGIs over 100k)
Earned income credit: $1,520 (reported on 16.7% of returns)
Here:
$1,520
State:
$1,643
Percentage of individuals using paid preparers for their 2004 taxes: 60.5%
Here:
60%
State:
56%
(% for various income ranges: 52.7% for AGIs below $10k, 61.4% for AGIs $10k-25k, 62.3% for AGIs $25k-50k, 62.0% for AGIs $50k-75k, 70.4% for AGIs $75k-100k, 75.9% for AGIs over 100k)
Household received Food Stamps/SNAP in the past 12 months: 277 Household did not receive Food Stamps/SNAP in the past 12 months: 1,265
Women who had a birth in the past 12 months: 28 (26 now married, 3 unmarried) Women who did not have a birth in the past 12 months: 767 (423 now married, 339 unmarried)
Housing units in zip code 16651 with a mortgage: 692 (61 second mortgage, 3 home equity loan, 49 both second mortgage and home equity loan) Houses without a mortgage: 78
Median monthly owner costs for units with a mortgage: $987 Median monthly owner costs for units without a mortgage: $491
Residents with income below the poverty level in 2022:
This zip code:
10.1%
Whole state:
11.8%
Residents with income below 50% of the poverty level in 2022:
This zip code:
5.7%
Whole state:
6.1%
Median number of rooms in houses and condos:
Here:
6.5
State:
6.8
Median number of rooms in apartments:
Here:
4.7
State:
4.3
Notable locations in this zip code not listed on our city pages
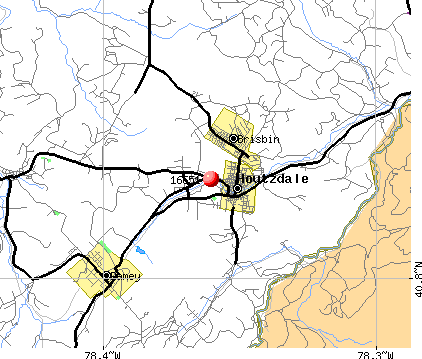
Churches in zip code 16651 include: Christ the King Church (A), Brisbin Baptist Church (B), Sanborn Church of God (C), Sanborn United Methodist Church (D), New Birth Church (E), First United Methodist Church Of Houtzdale (F). Display/hide their locations on the map
Cemeteries: Baughman Cemetery (1), Henderson Cemetery (2), Saint Barbara Cemetery (3), Sanborn Cemetery (4), Independent Order of Odd Fellows Cemetery (5). Display/hide their locations on the map
Streams, rivers, and creeks: Sanborn Run (A), Morgan Run (B), Goss Run (C), Lytle Run (D), Wolf Run (E), Little Beaver Run (F), Camp Hope Run (G), Raccoon Run (H). Display/hide their locations on the map
In group quarters: 2,398 (-1 institutionalized population)
Size of family households: 531 2-persons, 260 3-persons, 217 4-persons, 42 5-persons, 13 6-persons
Size of nonfamily households: 392 1-person, 66 2-persons, 9 3-persons
448 married couples with children.
133 single-parent households (66 men, 67 women).
92.3% of residents of 16651 zip code speak English at home.
4.8% of residents speak Spanish at home (75% very well, 14% well, 11% not well).
1.0% of residents speak other Indo-European language at home (91% very well, 9% well).
0.6% of residents speak Asian or Pacific Island language at home (84% very well, 16% well).
0.6% of residents speak other language at home (88% very well, 12% not well).
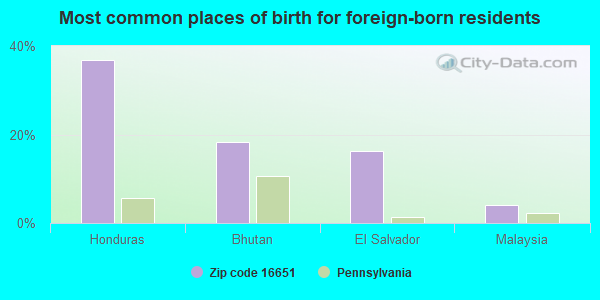
Foreign born population: 49 (0.8%) (36.3% of them are naturalized citizens)
This zip code:
0.8%
Whole state:
7.5%
37%Honduras
18%Bhutan
16%El Salvador
4%Malaysia
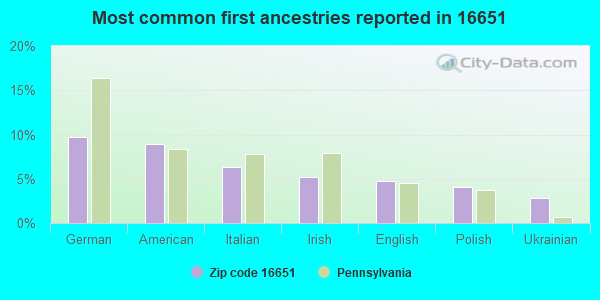
10%German
9%American
6%Italian
5%Irish
5%English
4%Polish
3%Ukrainian
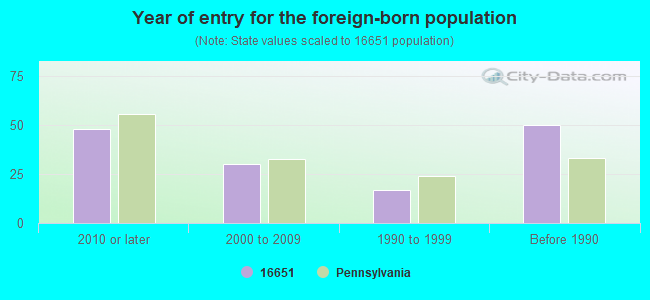
Year of entry for the foreign-born population
482010 or later
302000 to 2009
171990 to 1999
50Before 1990
Facilities with environmental interests located in this zip code:
A.R. WITKOSKY AUTO WRECKING (ROUTE 153 in HOUTZDALE, PA)
COMPLIANCE ACTIVITY (Tracking inspections of insecticide, fungicide, and rodenticide, and toxic substances) Business SIC classification: MISCELLANEOUS RETAIL STORES
Housing units lacking complete plumbing facilities: 4.8% Housing units lacking complete kitchen facilities: 3.1%
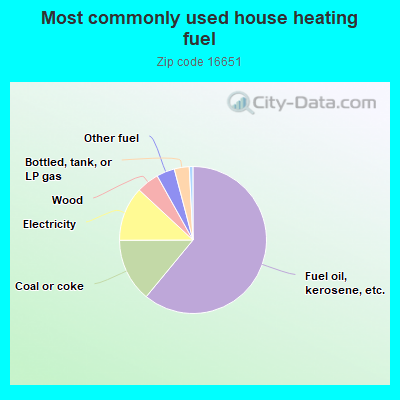
61.1%Fuel oil, kerosene, etc.
14.0%Coal or coke
12.0%Electricity
5.0%Wood
4.0%Other fuel
3.3%Bottled, tank, or LP gas
Population in 1990: 2,825. Population change in the 1990s: +2,499 (+88.5%).
Place of birth for U.S.-born residents:
This state: 4,818
Northeast: 308
Midwest: 108
South: 332
West: 114
83% of the 16651 zip code residents lived in the same house 5 years ago. Out of people who lived in different houses, 77% lived in this county. Out of people who lived in different counties, 50% lived in Pennsylvania.
90% of the 16651 zip code residents lived in the same house 1 year ago. Out of people who lived in different houses, 36% moved from this county. Out of people who lived in different houses, 58% moved from different county within same state. Out of people who lived in different houses, 2% moved from different state. Out of people who lived in different houses, 2% moved from abroad.
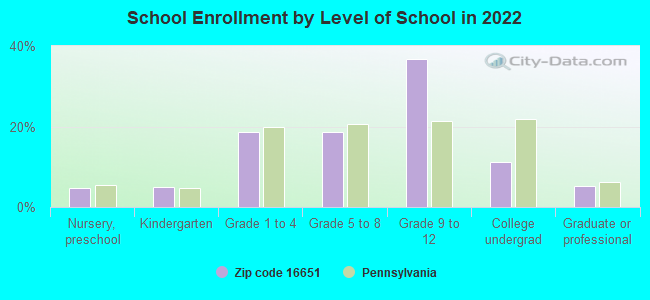
Private vs. public school enrollment:
Students in private schools in grades 1 to 8 (elementary and middle school):
Here:
0.0%
Pennsylvania:
15.7%
Students in private schools in grades 9 to 12 (high school): 15
Here:
7.2%
Pennsylvania:
13.4%
Students in private undergraduate colleges: 9
Here:
15.1%
Pennsylvania:
39.8%
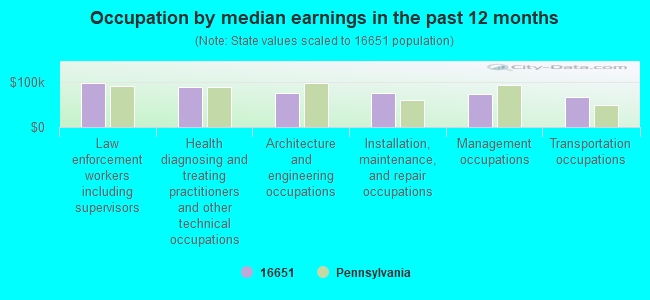
Occupation by median earnings in the past 12 months ($)
97,075Law enforcement workers including supervisors
89,217Health diagnosing and treating practitioners and other technical occupations
75,594Architecture and engineering occupations
74,960Installation, maintenance, and repair occupations
73,864Management occupations
65,366Transportation occupations
Top industries in this zip code by the number of employees in 2005:
Other Services (except Public Administration): Automotive Body, Paint, and Interior Repair and Maintenance (20-49: 1, 1-4: 1)
Other Services (except Public Administration): Religious Organizations (10-19: 1, 1-4: 1)
Finance and Insurance: Commercial Banking (5-9: 2, 1-4: 1)
Health Care and Social Assistance: Ambulance Services (10-19: 1)
People in group quarters in 2010:
2,237 people in state prisons
People in group quarters in 2000:
1,801 people in state prisons
2 people in religious group quarters
Fatal accident statistics in 2011:
Fatal accident count: 1
Vehicles involved in fatal accidents: 1
Fatal accidents caused by drunken drivers: 1
Fatalities: 1
Persons involved in fatal accidents: 1
Pedestrians involved in fatal accidents: 0
2004 - 2018 National Fire Incident Reporting System (NFIRS) incidents
According to the data from the years 2004 - 2018 the average number of fires per year is 9. The highest number of fires - 27 took place in 2012, and the least - 0 in 2007. The data has a rising trend.
When looking into fire subcategories, the most incidents belonged to: Structure Fires (79.6%), and Outside Fires (12.4%).
Fire incident types reported to NFIRS in Zip Code 16651


 Nearest zip codes: 16620, 16671, 16666, 16661, 16616, 16680.
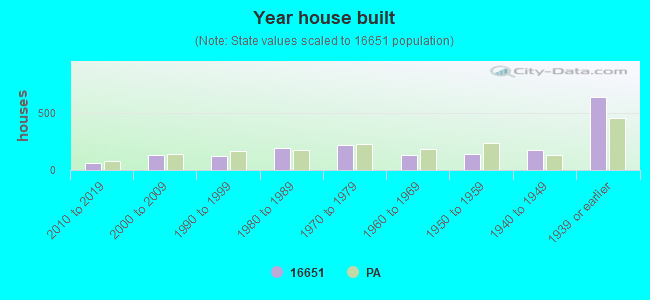


 According to the data from the years 2004 - 2018 the average number of fires per year is 9. The highest number of fires - 27 took place in 2012, and the least - 0 in 2007. The data has a rising trend.
 When looking into fire subcategories, the most incidents belonged to: Structure Fires (79.6%), and Outside Fires (12.4%).