Estimated zip code population in 2022: 31,926 Zip code population in 2010: 29,602 Zip code population in 2000: 26,955
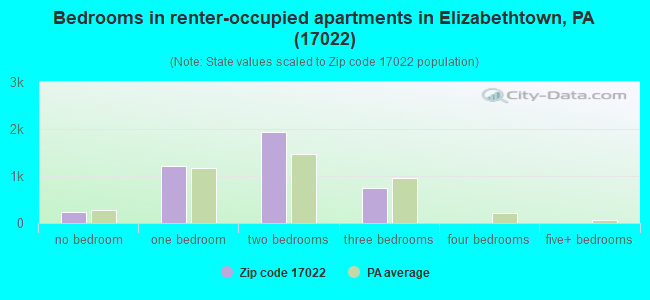
Houses and condos: 12,812 Renter-occupied apartments: 4,135
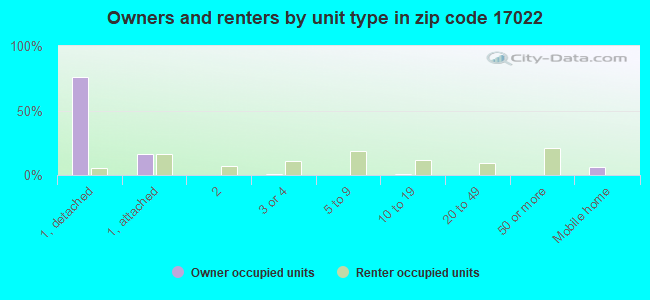
% of renters here:
33%
State:
31%
March 2022 cost of living index in zip code 17022: 96.3 (near average, U.S. average is 100)
Land area: 55.0 sq. mi. Water area: 0.2 sq. mi.
Population density: 580 people per square mile
(low).
OSM Map
General Map
Google Map
MSN Map
OSM Map
General Map
Google Map
MSN Map
OSM Map
General Map
Google Map
MSN Map
OSM Map
General Map
Google Map
MSN Map
Please wait while loading the map...
Real estate property taxes paid for housing units in 2022:
This zip code:
1.4% ($3,992)
Pennsylvania:
1.3% ($3,094)
Median real estate property taxes paid for housing units with mortgages in 2022: $4,214 (1.4%) Median real estate property taxes paid for housing units with no mortgage in 2022: $3,573 (1.3%)
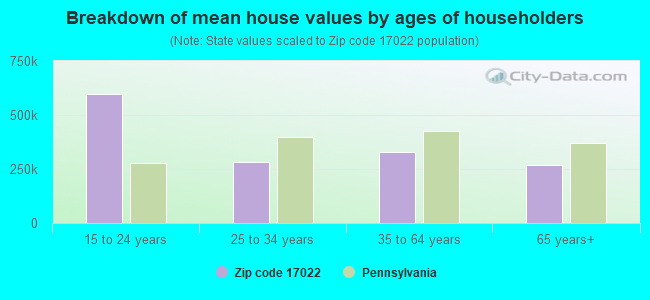
Estimated median house/condo value in 2022: $288,153
17022:
$288,153
Pennsylvania:
$245,500
According to our research of Pennsylvania and other state lists, there were 26 registered sex offenders living in 17022 zip code as of April 27, 2024. The ratio of all residents to sex offenders in zip code 17022 is 1,169 to 1. The ratio of registered sex offenders to all residents in this zip code is lower than the state average.
Median resident age:
This zip code:
41.2 years
Pennsylvania median age:
40.9 years
Average household size:
This zip code:
2.3 people
Pennsylvania:
2.4 people
Averages for the 2020 tax year for zip code 17022, filed in 2021:
Average Adjusted Gross Income (AGI) in 2020: $73,346 (Individual Income Tax Returns)
Here:
$73,346
State:
$75,707
Salary/wage: $60,715 (reported on 80.3% of returns)
Here:
$60,715
State:
$62,806
(% of AGI for various income ranges: 1102.6% for AGIs below $25k, 3424.9% for AGIs $25k-50k, 6164.4% for AGIs $50k-75k, 8679.9% for AGIs $75k-100k, 15800.7% for AGIs $100k-200k, 62800.9% for AGIs over 200k)
Taxable interest for individuals: $1,446 (reported on 34.6% of returns)
This zip code:
$1,446
Pennsylvania:
$1,633
(% of AGI for various income ranges: 21.3% for AGIs below $25k, 24.1% for AGIs $25k-50k, 54.3% for AGIs $50k-75k, 90.5% for AGIs $75k-100k, 131.9% for AGIs $100k-200k, 982.3% for AGIs over 200k)
Ordinary dividends: $4,746 (reported on 25.5% of returns)
Here:
$4,746
State:
$7,382
(% of AGI for various income ranges: 38.6% for AGIs below $25k, 49.1% for AGIs $25k-50k, 110.5% for AGIs $50k-75k, 195.5% for AGIs $75k-100k, 360.8% for AGIs $100k-200k, 2621.8% for AGIs over 200k)
Net capital gain/loss in AGI: +$11,967 (reported on 21.2% of returns)
Here:
+$11,967
State:
+$23,522
(% of AGI for various income ranges: 12.9% for AGIs below $25k, 32.1% for AGIs $25k-50k, 99.6% for AGIs $50k-75k, 202.9% for AGIs $75k-100k, 580.3% for AGIs $100k-200k, 10838.2% for AGIs over 200k)
Profit/loss from business: +$15,628 (reported on 12.0% of returns)
Here:
+$15,628
State:
+$16,274
(% of AGI for various income ranges: 71.4% for AGIs below $25k, 79.2% for AGIs $25k-50k, 189.3% for AGIs $50k-75k, 288.8% for AGIs $75k-100k, 539.1% for AGIs $100k-200k, 3916.4% for AGIs over 200k)
Taxable individual retirement arrangement distribution: $18,128 (reported on 13.5% of returns)
17022:
$18,128
Pennsylvania:
$18,583
(% of AGI for various income ranges: 88.1% for AGIs below $25k, 152.4% for AGIs $25k-50k, 265.4% for AGIs $50k-75k, 520.0% for AGIs $75k-100k, 857.7% for AGIs $100k-200k, 2395.9% for AGIs over 200k)
Self-employed (Keogh) retirement plans: $17,171 (reported on 0.4% of returns)
17022:
$17,171
Pennsylvania:
$25,407
(% of AGI for various income ranges: 20.5% for AGIs $100k-200k, 381.4% for AGIs over 200k)
Total itemized deductions: $41,333 (reported on 7.5% of returns)
Here:
$41,333
State:
$34,850
(% of AGI for various income ranges: 83.9% for AGIs below $25k, 98.4% for AGIs $25k-50k, 274.9% for AGIs $50k-75k, 376.6% for AGIs $75k-100k, 739.0% for AGIs $100k-200k, 9430.0% for AGIs over 200k)
Charity contributions: $18,688 (reported on 5.7% of returns)
Here:
$18,688
State:
$12,392
(% of AGI for various income ranges: 3.6% for AGIs below $25k, 13.5% for AGIs $25k-50k, 53.5% for AGIs $50k-75k, 84.0% for AGIs $75k-100k, 238.5% for AGIs $100k-200k, 4527.3% for AGIs over 200k)
Taxes paid: $7,489 (reported on 7.4% of returns)
17022:
$7,489
State:
$8,200
(% of AGI for various income ranges: 4.5% for AGIs below $25k, 14.7% for AGIs $25k-50k, 60.5% for AGIs $50k-75k, 93.9% for AGIs $75k-100k, 195.8% for AGIs $100k-200k, 1087.3% for AGIs over 200k)
Earned income credit: $1,932 (reported on 8.6% of returns)
Here:
$1,932
State:
$2,100
(% of AGI for various income ranges: 52.0% for AGIs below $25k, 40.6% for AGIs $25k-50k, 1.0% for AGIs $50k-75k)
Percentage of individuals using paid preparers for their 2020 taxes: 93.3%
Here:
93%
State:
92%
(% for various income ranges: 91.5% for AGIs below $25k, 94.6% for AGIs $25k-50k, 94.4% for AGIs $50k-75k, 92.7% for AGIs $75k-100k, 94.1% for AGIs $100k-200k, 91.3% for AGIs over 200k)
Averages for the 2012 tax year for zip code 17022, filed in 2013:
Average Adjusted Gross Income (AGI) in 2012: $57,673 (Individual Income Tax Returns)
Here:
$57,673
State:
$61,346
Salary/wage: $50,088 (reported on 82.8% of returns)
Here:
$50,088
State:
$51,902
(% of AGI for various income ranges: 69.9% for AGIs below $25k, 75.8% for AGIs $25k-50k, 76.0% for AGIs $50k-75k, 73.5% for AGIs $75k-100k, 76.8% for AGIs $100k-200k, 54.6% for AGIs over 200k)
Taxable interest for individuals: $1,215 (reported on 40.3% of returns)
This zip code:
$1,215
Pennsylvania:
$1,588
(% of AGI for various income ranges: 1.5% for AGIs below $25k, 0.7% for AGIs $25k-50k, 0.6% for AGIs $50k-75k, 0.6% for AGIs $75k-100k, 0.7% for AGIs $100k-200k, 1.4% for AGIs over 200k)
Ordinary dividends: $3,413 (reported on 26.6% of returns)
Here:
$3,413
State:
$5,827
(% of AGI for various income ranges: 2.2% for AGIs below $25k, 1.2% for AGIs $25k-50k, 1.3% for AGIs $50k-75k, 1.3% for AGIs $75k-100k, 1.7% for AGIs $100k-200k, 2.0% for AGIs over 200k)
Net capital gain/loss in AGI: +$7,139 (reported on 18.5% of returns)
Here:
+$7,139
State:
+$14,495
(% of AGI for various income ranges: 0.4% for AGIs $25k-50k, 0.5% for AGIs $50k-75k, 1.0% for AGIs $75k-100k, 1.8% for AGIs $100k-200k, 9.4% for AGIs over 200k)
Profit/loss from business: +$13,664 (reported on 12.4% of returns)
Here:
+$13,664
State:
+$16,268
(% of AGI for various income ranges: 4.2% for AGIs below $25k, 2.8% for AGIs $25k-50k, 2.5% for AGIs $50k-75k, 2.6% for AGIs $75k-100k, 2.7% for AGIs $100k-200k, 3.9% for AGIs over 200k)
Taxable individual retirement arrangement distribution: $12,704 (reported on 13.5% of returns)
17022:
$12,704
Pennsylvania:
$14,550
(% of AGI for various income ranges: 4.5% for AGIs below $25k, 3.0% for AGIs $25k-50k, 2.5% for AGIs $50k-75k, 3.4% for AGIs $75k-100k, 2.9% for AGIs $100k-200k, 2.5% for AGIs over 200k)
Self-employment retirement plans: $20,640 (reported on 0.4% of returns)
17022:
$20,640
Pennsylvania:
$20,922
Total itemized deductions: $20,760 (20% of AGI, reported on 35.2% of returns)
Here:
$20,760
State:
$23,538
Here:
20.2% of AGI
State:
18.4% of AGI
(% of AGI for various income ranges: 10.0% for AGIs below $25k, 9.4% for AGIs $25k-50k, 12.6% for AGIs $50k-75k, 14.3% for AGIs $75k-100k, 14.6% for AGIs $100k-200k, 11.8% for AGIs over 200k)
Charity contributions: $5,008 (reported on 28.1% of returns)
Here:
$5,008
State:
$4,025
(% of AGI for various income ranges: 0.8% for AGIs below $25k, 1.2% for AGIs $25k-50k, 1.9% for AGIs $50k-75k, 2.3% for AGIs $75k-100k, 2.8% for AGIs $100k-200k, 4.2% for AGIs over 200k)
Taxes paid: $7,814 (reported on 35.1% of returns)
17022:
$7,814
State:
$9,982
(% of AGI for various income ranges: 1.6% for AGIs below $25k, 2.7% for AGIs $25k-50k, 4.4% for AGIs $50k-75k, 5.3% for AGIs $75k-100k, 6.3% for AGIs $100k-200k, 5.2% for AGIs over 200k)
Earned income credit: $1,950 (reported on 10.1% of returns)
Here:
$1,950
State:
$2,106
(% of AGI for various income ranges: 3.5% for AGIs below $25k, 0.7% for AGIs $25k-50k)
Percentage of individuals using paid preparers for their 2012 taxes: 52.4%
Here:
52%
State:
53%
(% for various income ranges: 47.3% for AGIs below $25k, 52.0% for AGIs $25k-50k, 55.8% for AGIs $50k-75k, 56.7% for AGIs $75k-100k, 55.6% for AGIs $100k-200k, 70.6% for AGIs over 200k)
Averages for the 2004 tax year for zip code 17022, filed in 2005:
Average Adjusted Gross Income (AGI) in 2004: $49,151 (Individual Income Tax Returns)
Here:
$49,151
State:
$48,049
Salary/wage: $43,474 (reported on 84.8% of returns)
Here:
$43,474
State:
$42,646
(% of AGI for various income ranges: 103.4% for AGIs below $10k, 72.0% for AGIs $10k-25k, 78.6% for AGIs $25k-50k, 80.6% for AGIs $50k-75k, 82.1% for AGIs $75k-100k, 64.2% for AGIs over 100k)
Taxable interest for individuals: $1,596 (reported on 50.7% of returns)
This zip code:
$1,596
Pennsylvania:
$1,657
(% of AGI for various income ranges: 5.3% for AGIs below $10k, 2.7% for AGIs $10k-25k, 1.7% for AGIs $25k-50k, 1.2% for AGIs $50k-75k, 1.2% for AGIs $75k-100k, 1.8% for AGIs over 100k)
Taxable dividends: $2,706 (reported on 29.9% of returns)
Here:
$2,706
State:
$3,566
(% of AGI for various income ranges: 4.6% for AGIs below $10k, 1.8% for AGIs $10k-25k, 1.2% for AGIs $25k-50k, 1.3% for AGIs $50k-75k, 1.0% for AGIs $75k-100k, 2.4% for AGIs over 100k)
Net capital gain/loss: +$6,322 (reported on 21.6% of returns)
Here:
+$6,322
State:
+$9,716
(% of AGI for various income ranges: -1.7% for AGIs below $10k, 0.2% for AGIs $10k-25k, 0.5% for AGIs $25k-50k, 0.9% for AGIs $50k-75k, 1.6% for AGIs $75k-100k, 6.8% for AGIs over 100k)
Profit/loss from business: +$13,716 (reported on 12.8% of returns)
Here:
+$13,716
State:
+$14,267
(% of AGI for various income ranges: 5.2% for AGIs below $10k, 4.0% for AGIs $10k-25k, 3.3% for AGIs $25k-50k, 2.5% for AGIs $50k-75k, 2.9% for AGIs $75k-100k, 4.7% for AGIs over 100k)
Profit/loss from farming: +$304 (reported on 1.1% of returns)
Here:
+$304
State:
+$274
(% of AGI for various income ranges: -6.6% for AGIs below $10k, 0.1% for AGIs $10k-25k, 0.1% for AGIs $25k-50k, 0.3% for AGIs $50k-75k, 0.1% for AGIs $75k-100k, -0.0% for AGIs over 100k)
IRA payment deduction: $2,901 (reported on 2.6% of returns)
17022:
$2,901
Pennsylvania:
$2,903
(% of AGI for various income ranges: 0.2% for AGIs $10k-25k, 0.3% for AGIs $25k-50k, 0.2% for AGIs $50k-75k, 0.1% for AGIs $75k-100k, 0.1% for AGIs over 100k)
Self-employed pension: $9,304 (reported on 0.8% of returns)
Here:
$9,304
Pennsylvania:
$14,674
(% of AGI for various income ranges: 0.1% for AGIs $10k-25k, 0.0% for AGIs $50k-75k, 0.1% for AGIs $75k-100k, 0.3% for AGIs over 100k)
Total itemized deductions: $16,655 (20% of AGI, reported on 37.6% of returns)
Here:
$16,655
State:
$18,804
Here:
19.8% of AGI
State:
19.5% of AGI
(% of AGI for various income ranges: 10.3% for AGIs below $10k, 10.7% for AGIs $10k-25k, 10.7% for AGIs $25k-50k, 14.1% for AGIs $50k-75k, 15.5% for AGIs $75k-100k, 12.0% for AGIs over 100k)
Charity contributions deductions: $3,786 (4% of AGI, reported on 31.9% of returns)
Here:
$3,786
State:
$3,337
Here:
4.2% of AGI
State:
3.3% of AGI
(% of AGI for various income ranges: 0.8% for AGIs below $10k, 1.3% for AGIs $10k-25k, 1.6% for AGIs $25k-50k, 2.2% for AGIs $50k-75k, 2.6% for AGIs $75k-100k, 3.4% for AGIs over 100k)
Total tax: $7,068 (reported on 79.8% of returns)
17022:
$7,068
State:
$8,008
(% of AGI for various income ranges: 2.4% for AGIs below $10k, 4.6% for AGIs $10k-25k, 7.4% for AGIs $25k-50k, 8.6% for AGIs $50k-75k, 10.3% for AGIs $75k-100k, 18.5% for AGIs over 100k)
Earned income credit: $1,574 (reported on 8.4% of returns)
Here:
$1,574
State:
$1,643
Percentage of individuals using paid preparers for their 2004 taxes: 54.5%
Here:
55%
State:
56%
(% for various income ranges: 45.2% for AGIs below $10k, 56.4% for AGIs $10k-25k, 57.3% for AGIs $25k-50k, 54.9% for AGIs $50k-75k, 54.2% for AGIs $75k-100k, 61.2% for AGIs over 100k)
Likely homosexual households (counted as self-reported same-sex unmarried-partner households)
Lesbian couples: 0.2% of all households
Gay men: 0.0% of all households
Household received Food Stamps/SNAP in the past 12 months: 686 Household did not receive Food Stamps/SNAP in the past 12 months: 11,913
Women who had a birth in the past 12 months: 273 (292 now married, 0 unmarried) Women who did not have a birth in the past 12 months: 6,972 (3,285 now married, 3,668 unmarried)
Housing units in zip code 17022 with a mortgage: 5,405 (792 second mortgage, 28 home equity loan, 710 both second mortgage and home equity loan) Houses without a mortgage: 421
Median monthly owner costs for units with a mortgage: $1,753 Median monthly owner costs for units without a mortgage: $632
Residents with income below the poverty level in 2022:
This zip code:
6.4%
Whole state:
11.8%
Residents with income below 50% of the poverty level in 2022:
This zip code:
4.0%
Whole state:
6.1%
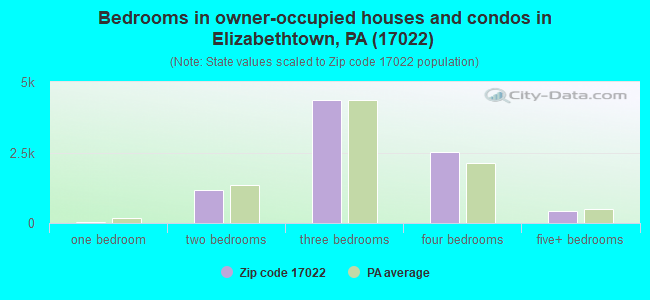
Median number of rooms in houses and condos:
Here:
7.1
State:
6.8
Median number of rooms in apartments:
Here:
4.3
State:
4.3
Notable locations in this zip code not listed on our city pages
Notable locations in zip code 17022: Conewago Industrial Park (A), Shawntree Golf Course (B), Masonic Homes (C), Rheems Fire Company 1 Station 7 - 11 (D), Friendship Fire and Hose Company 1 Station 7 - 4 (E), Eilzabethtown Borough Wastewater Treatment Plant (F), Conoy Township Municipal Building (G). Display/hide their locations on the map
Churches in zip code 17022 include: Alliance Church (A), Goods Church (B), West Greentree Church (C), Church of Christ (D), Falmouth United Methodist Church (E), Cedar Hill Community Church (F), Newville Bible Church (G), Goods Mennonite Church (H), Rissers Church (I). Display/hide their locations on the map
Cemeteries: Oberholtzer Cemetery (1), Goods Cemetery (2), Mount Tunnel Cemetery (3), Mount Ober Cemetery (4), Milton Grove Cemetery (5). Display/hide their locations on the map
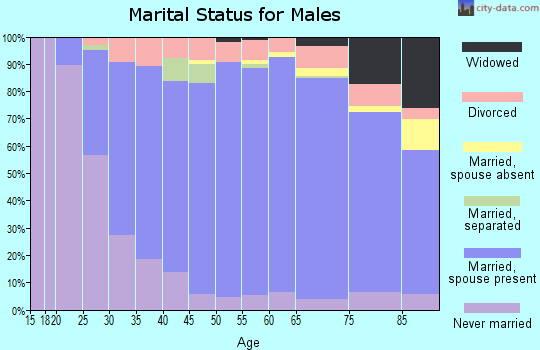
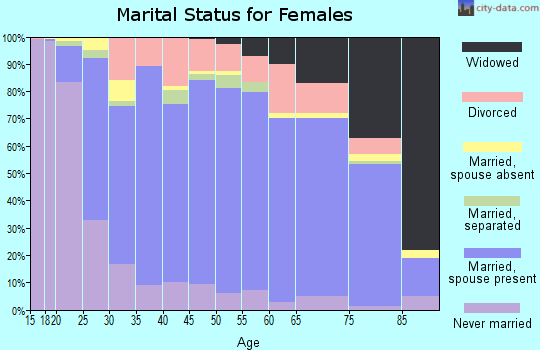
4,981 married couples with children.
877 single-parent households (303 men, 574 women).
95.0% of residents of 17022 zip code speak English at home.
2.3% of residents speak Spanish at home (55% very well, 17% well, 26% not well, 2% not at all).
1.0% of residents speak other Indo-European language at home (79% very well, 11% well, 9% not well).
0.5% of residents speak Asian or Pacific Island language at home (54% very well, 46% well).
1.1% of residents speak other language at home (45% very well, 55% well).
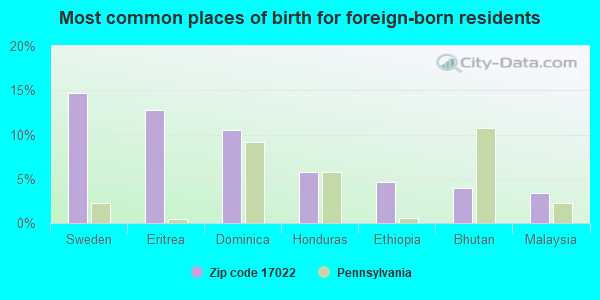
Foreign born population: 1,465 (4.6%) (52.0% of them are naturalized citizens)
This zip code:
4.6%
Whole state:
7.5%
15%Sweden
13%Eritrea
11%Dominica
6%Honduras
5%Ethiopia
4%Bhutan
3%Malaysia
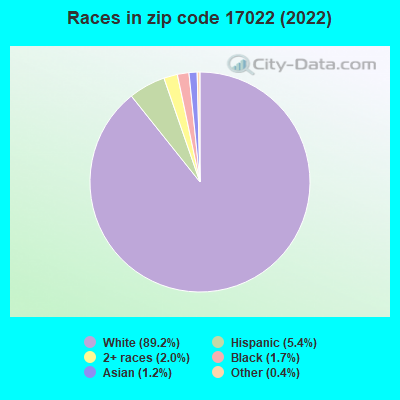
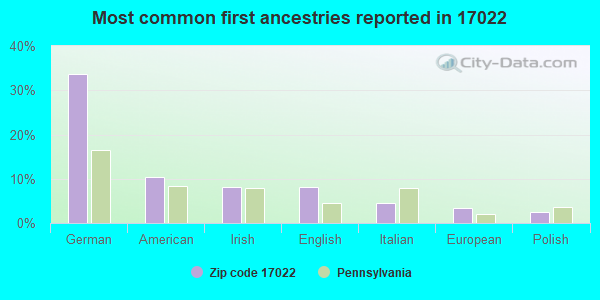
34%German
10%American
8%Irish
8%English
4%Italian
3%European
2%Polish
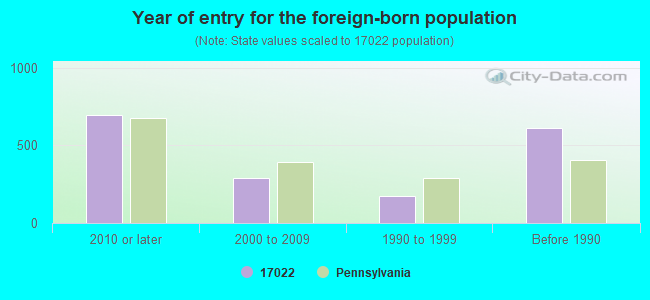
Year of entry for the foreign-born population
6962010 or later
2872000 to 2009
1731990 to 1999
614Before 1990
Facilities with environmental interests located in this zip code:
AAF INTL (33 INDUSTRIAL RD in ELIZABETHTOWN, PA)
(Integrated Compliance Information System) - ICIS-03-1998-0318, FORMAL ENFORCEMENT ACTION COMPLIANCE ACTIVITY (Tracking inspections of insecticide, fungicide, and rodenticide, and toxic substances) Business SIC classification: AIR-CONDITIONING AND WARM AIR HEATING EQUIPMENT AND COMMERCIAL AND INDUSTRIAL REFRIGERATION EQUIPMENT; WARM AIR HEATING AND AIR-CONDITIONING EQUIPMENT AND SUPPLIES; REFRIGERATION AND AIR-CONDITIONING SERVICE AND REPAIR SHOPS Alternative names: AAF-MCQUAY INC.
BILL MILLER FORD (1533 S MARKET ST in ELIZABETHTOWN, PA)
BIO-ENVRON SVCS (2107 OLD HERSHEY RD in ELIZABETHTOWN, PA)
TRANSPORTER (Resource Conservation and Recovery Act (tracking hazardous waste)) Organizations: HAGY BRIAN CHARLES (CONTACT/OWNER)
Housing units lacking complete plumbing facilities: 1.0% Housing units lacking complete kitchen facilities: 2.3%
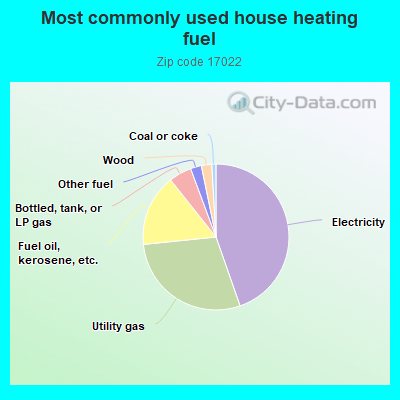
44.3%Electricity
28.5%Utility gas
15.8%Fuel oil, kerosene, etc.
5.0%Bottled, tank, or LP gas
2.4%Other fuel
2.3%Wood
0.9%Coal or coke
Population in 1990: 21,808. Population change in the 1990s: +5,147 (+23.6%).
Place of birth for U.S.-born residents:
This state: 24,426
Northeast: 1,970
Midwest: 1,094
South: 1,914
West: 675
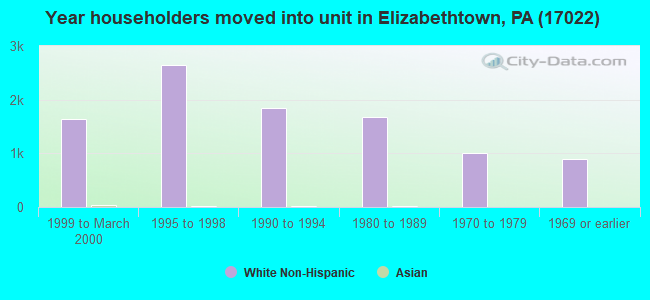
58% of the 17022 zip code residents lived in the same house 5 years ago. Out of people who lived in different houses, 53% lived in this county. Out of people who lived in different counties, 50% lived in Pennsylvania.
93% of the 17022 zip code residents lived in the same house 1 year ago. Out of people who lived in different houses, 47% moved from this county. Out of people who lived in different houses, 36% moved from different county within same state. Out of people who lived in different houses, 17% moved from different state. Out of people who lived in different houses, 1% moved from abroad.
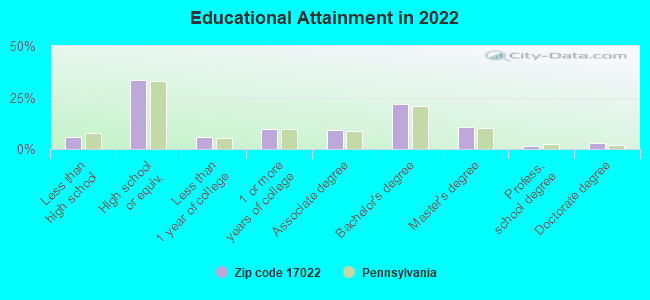
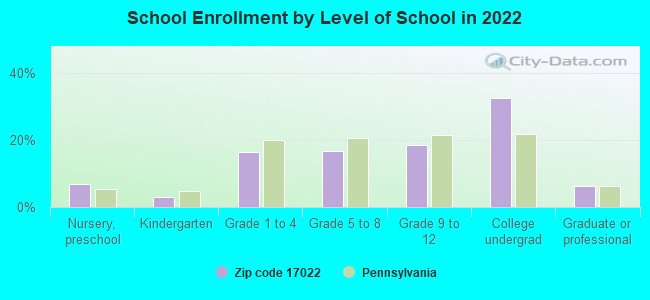
Private vs. public school enrollment:
Students in private schools in grades 1 to 8 (elementary and middle school): 354
Here:
14.0%
Pennsylvania:
15.7%
Students in private schools in grades 9 to 12 (high school): 231
Here:
16.3%
Pennsylvania:
13.4%
Students in private undergraduate colleges: 1,552
Here:
61.8%
Pennsylvania:
39.8%
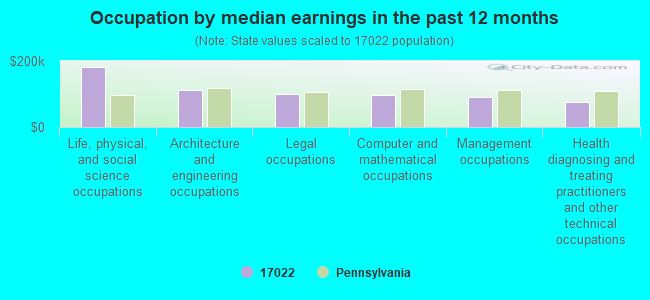
Occupation by median earnings in the past 12 months ($)
181,010Life, physical, and social science occupations
110,722Architecture and engineering occupations
100,823Legal occupations
95,857Computer and mathematical occupations
92,144Management occupations
76,511Health diagnosing and treating practitioners and other technical occupations
Companies with federal contracts located in this zip code (ELIZABETHTOWN, PA):
VEREFI TECHNOLOGIES, INC (246 S MARKET ST; small business) : $294,870 in 4 contractsfrom 2002 to 2006
$99,999 with Army for Other Medical -- Operational Systems Development (R&D). Signed on 2005-09-06. Completion date: 2006-03-22.
$99,994 with Army for Biomedical -- Basic Research (R&D). Signed on 2006-01-10. Completion date: 2006-12-14.
$94,877 with Army for Other Medical -- Operational Systems Development (R&D). Signed on 2002-12-19. Completion date: 2003-07-30.
$0 with Army for Biomedical -- Basic Research (R&D). Signed on 2006-07-05. Effective on 2006-06-19. Completion date: 2006-12-14.
RUTT'S MACHINE SHOP, INC (300 JONLYN DR; small business) : $260,673 in 25 contractsfrom 2004 to 2006
Contracts for Maintenance, Repair and Rebuilding of Equipment -- Engines, Turbines, and Components, Gasoline Reciprocating Engines, Except Aircraft; and Components by Army Signed by year:2000: $0; 2001: $0; 2002: $0; 2003: $0; 2004: $138,500; 2005: $195,382; 2006: -$73,209.
Biggest contracts:
$139,700 with Army for Maintenance, Repair and Rebuilding of Equipment -- Engines, Turbines, and Components. Signed on 2005-09-06. Completion date: 2005-12-07.
$129,000, same as above.Signed on 2004-10-26. Completion date: 2004-11-24.
$20,781, same as above.Signed on 2005-07-14. Completion date: 2004-11-24.
$17,850, same as above.Signed on 2005-03-01. Completion date: 2005-04-07.
NEWCOMER OIL CORPORATION (101 CHERRY ST; small business) : $197,778 in 2 contractsfrom 2002 to 2005
$193,075 with Defense Logistics Agency for Fuel Oils. Signed on 2002-07-23. Completion date: 2004-05-31.
$4,703, same as above.Signed on 2005-12-22. Completion date: 2005-12-22.
LASER SUPPLY & DESIGN LLC (160 S POPLAR ST; small business) : $34,980 in 3 contractsfrom 2004 to 2005
$13,200 with Army for Office Supplies. Signed on 2005-02-28. Completion date: 2005-03-15.
$13,200 with Army for Miscellaneous Office Machines. Signed on 2004-04-22. Completion date: 2004-05-10.
$8,580, same as above.Signed on 2005-04-28. Completion date: 2005-05-06.
MESSICK FARM EQUIPMENT INC (RHEEMS EXIT RR 283; small business) : $16,843 in 2 contractsfrom 2003 to 2004
$13,083 with Army for Diesel Engines and Components. Signed on 2004-06-02. Completion date: 2004-07-02.
$3,760 with Army for Harvesting Equipment. Signed on 2003-09-11. Completion date: 2003-10-27.
ENGLE BUSINESS SYSTEMS LLC (910 NORTH HANOVER STREET; small business) : $14,255 in 2 contractsfrom 2003 to 2005
$9,800 with Defense Logistics Agency for Miscellaneous Items. Signed on 2005-09-14. Completion date: 2005-09-29.
$4,455 with Army for ADP Input/Output and Storage Devices. Signed on 2003-09-29. Completion date: 2004-09-30.
SHANK''S STRING INSTRUMENT RPR (308 W HIGH ST; small business)
$11,200 with Army for Musical Instruments. Taking place in MD. Signed on 2005-05-19. Completion date: 2005-06-01.
LARRY RUTT AIRSHOW ANNOUNCING (5625 RIDGE RD; small business) : $8,000 in 2 contractsfrom 2005 to 2006
$4,000 with Air Force for Public Relations Services(includes writing services, event planning and management, media relations, radio and television analysis, and press services). Signed on 2006-06-26. Completion date: 2006-07-10.
$4,000, same as above.Signed on 2005-04-11. Completion date: 2005-07-11.
PARA LOFT INC (26 W BAINBRIDGE ST; small business) : $5,480 in 2 contractsfrom 2004 to 2006
$2,870 with U.S. Special Operations Command for Other Education and Training Services. Signed on 2006-03-08. Completion date: 2006-03-23.
$2,610 with Department of Defense for Other Education and Training Services. Signed on 2004-12-20. Completion date: 2005-01-25.
DONNA M O''CONNELL (60 S TRAIL ROAD; small business)
$1,000 with Army for Education Services. Taking place in KS. Signed on 2003-02-11. Completion date: 2003-02-13.
Top industries in this zip code by the number of employees in 2005:
Health Care and Social Assistance: Continuing Care Retirement Communities (over 1000 employees: 1 establishment)
Educational Services: Colleges, Universities, and Professional Schools (500-999: 1)
2003 - 2018 National Fire Incident Reporting System (NFIRS) incidents
According to the data from the years 2003 - 2018 the average number of fires per year is 109. The highest number of reported fire incidents - 157 took place in 2005, and the least - 61 in 2013. The data has a growing trend.
When looking into fire subcategories, the most incidents belonged to: Structure Fires (72.4%), and Outside Fires (16.2%).
Fire incident types reported to NFIRS in Zip Code 17022

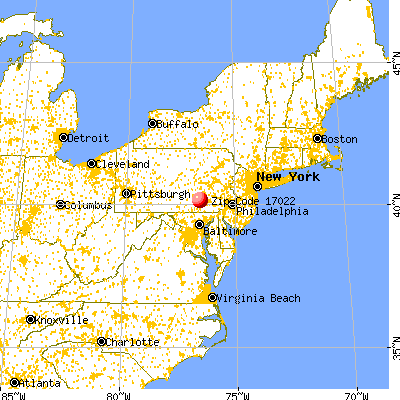


 Nearest zip codes: 17570, 17502, 17041, 17550, 17547, 17033.


 According to the data from the years 2003 - 2018 the average number of fires per year is 109. The highest number of reported fire incidents - 157 took place in 2005, and the least - 61 in 2013. The data has a growing trend.
 When looking into fire subcategories, the most incidents belonged to: Structure Fires (72.4%), and Outside Fires (16.2%).