Estimated zip code population in 2022: 2,184 Zip code population in 2010: 2,305 Zip code population in 2000: 2,338
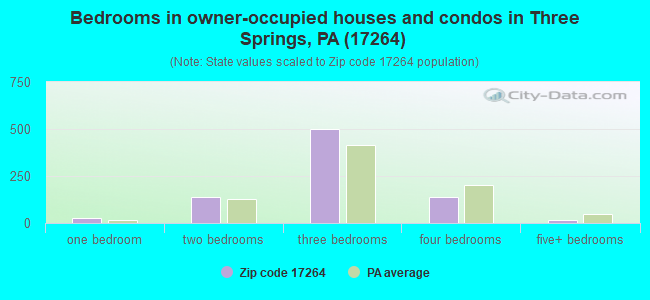
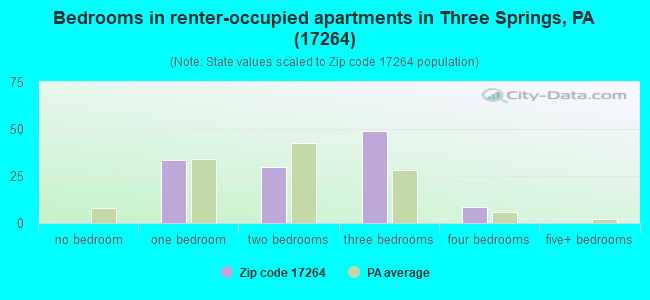
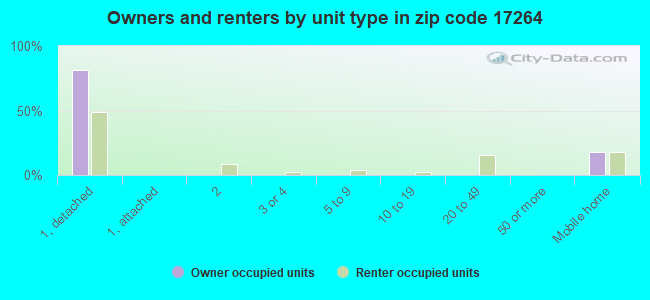
Houses and condos: 1,279 Renter-occupied apartments: 122
% of renters here:
13%
State:
31%
March 2022 cost of living index in zip code 17264: 91.5 (less than average, U.S. average is 100)
Land area: 54.4 sq. mi. Water area: 0.0 sq. mi.
Population density: 40 people per square mile
(very low).
OSM Map
General Map
Google Map
MSN Map
OSM Map
General Map
Google Map
MSN Map
OSM Map
General Map
Google Map
MSN Map
OSM Map
General Map
Google Map
MSN Map
Please wait while loading the map...
Real estate property taxes paid for housing units in 2022:
This zip code:
0.9% ($1,588)
Pennsylvania:
1.3% ($3,094)
Median real estate property taxes paid for housing units with mortgages in 2022: $1,690 (0.9%) Median real estate property taxes paid for housing units with no mortgage in 2022: $1,519 (1.0%)
Business Search- 14 Million verified businesses
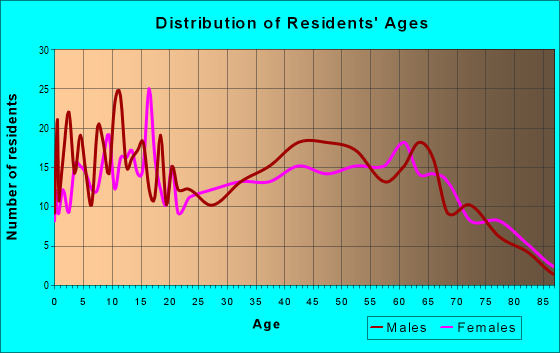
Males: 1,049
(48.0%)
Females: 1,134
(52.0%)
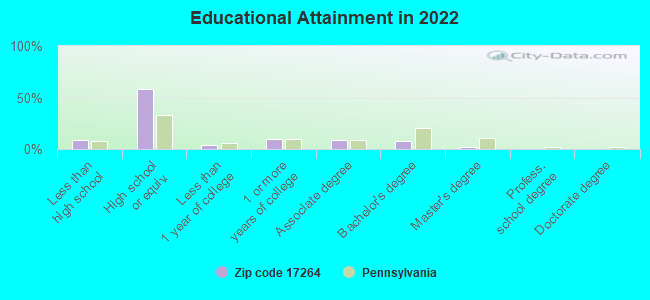
For population 25 years and over in 17264:
High school or higher: 90.0%
Bachelor's degree or higher: 10.3%
Graduate or professional degree: 3.0%
Unemployed: 7.4%
Mean travel time to work (commute): 43.8 minutes
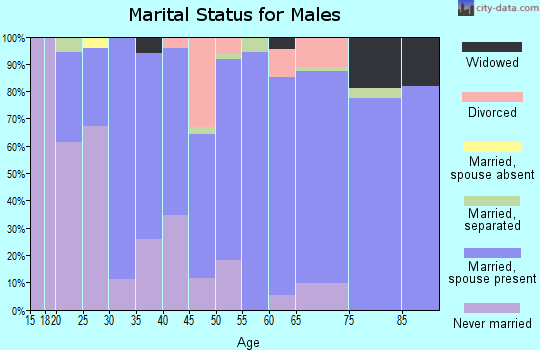
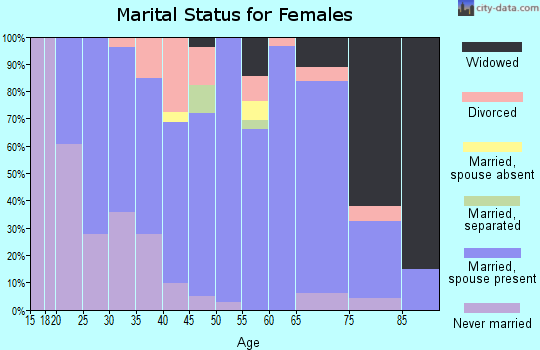
For population 15 years and over in 17264:
Never married: 22.7%
Now married: 57.8%
Separated: 2.8%
Widowed: 5.8%
Divorced: 10.8%
Zip code 17264 compared to state average:
Unemployed percentage above state average.
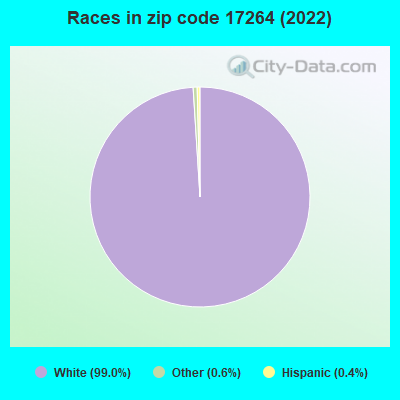
Black race population percentage significantly below state average.
Hispanic race population percentage significantly below state average.
Median age above state average.
Foreign-born population percentage significantly below state average.
Renting percentage significantly below state average.
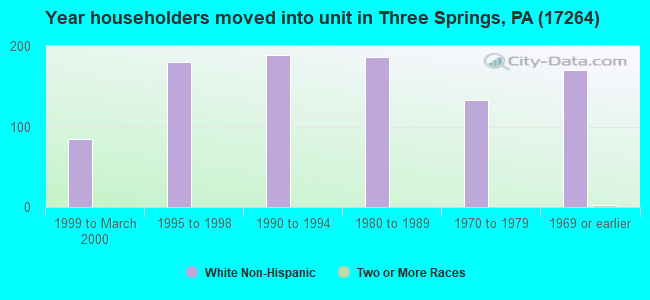
Length of stay since moving in significantly above state average.
Number of college students below state average.
Percentage of population with a bachelor's degree or higher significantly below state average.
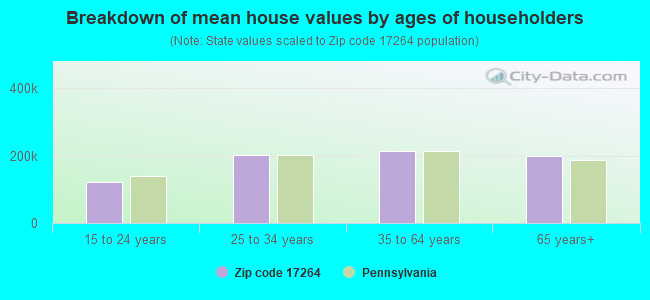
Estimated median house/condo value in 2022: $173,326
17264:
$173,326
Pennsylvania:
$245,500
According to our research of Pennsylvania and other state lists, there were 3 registered sex offenders living in 17264 zip code as of April 26, 2024. The ratio of all residents to sex offenders in zip code 17264 is 720 to 1. The ratio of registered sex offenders to all residents in this zip code is lower than the state average.
Median resident age:
This zip code:
45.4 years
Pennsylvania median age:
40.9 years
Average household size:
This zip code:
2.3 people
Pennsylvania:
2.4 people
Averages for the 2020 tax year for zip code 17264, filed in 2021:
Average Adjusted Gross Income (AGI) in 2020: $52,715 (Individual Income Tax Returns)
Here:
$52,715
State:
$75,707
Salary/wage: $46,332 (reported on 78.6% of returns)
Here:
$46,332
State:
$62,806
(% of AGI for various income ranges: 877.0% for AGIs below $25k, 2996.4% for AGIs $25k-50k, 6024.4% for AGIs $50k-75k, 7861.0% for AGIs $75k-100k, 15266.0% for AGIs $100k-200k)
Taxable interest for individuals: $720 (reported on 34.2% of returns)
This zip code:
$720
Pennsylvania:
$1,633
(% of AGI for various income ranges: 17.4% for AGIs below $25k, 25.6% for AGIs $25k-50k, 45.6% for AGIs $50k-75k, 50.0% for AGIs $75k-100k, 54.0% for AGIs $100k-200k)
Ordinary dividends: $1,158 (reported on 16.2% of returns)
Here:
$1,158
State:
$7,382
(% of AGI for various income ranges: 8.5% for AGIs below $25k, 7.2% for AGIs $25k-50k, 25.0% for AGIs $50k-75k, 28.0% for AGIs $75k-100k, 111.0% for AGIs $100k-200k)
Net capital gain/loss in AGI: +$2,745 (reported on 9.4% of returns)
Here:
+$2,745
State:
+$23,522
(% of AGI for various income ranges: 3.7% for AGIs below $25k, 14.0% for AGIs $25k-50k, 54.4% for AGIs $50k-75k, 170.0% for AGIs $100k-200k)
Profit/loss from business: +$16,269 (reported on 11.1% of returns)
Here:
+$16,269
State:
+$16,274
(% of AGI for various income ranges: 89.6% for AGIs below $25k, 177.6% for AGIs $25k-50k, 218.8% for AGIs $50k-75k, 554.0% for AGIs $75k-100k, 525.0% for AGIs $100k-200k)
Taxable individual retirement arrangement distribution: $8,636 (reported on 9.4% of returns)
17264:
$8,636
Pennsylvania:
$18,583
(% of AGI for various income ranges: 78.5% for AGIs below $25k, 74.0% for AGIs $25k-50k, 115.0% for AGIs $50k-75k, 369.0% for AGIs $75k-100k)
Earned income credit: $2,257 (reported on 12.0% of returns)
Here:
$2,257
State:
$2,100
(% of AGI for various income ranges: 65.6% for AGIs below $25k, 55.6% for AGIs $25k-50k)
Percentage of individuals using paid preparers for their 2020 taxes: 94.9%
Here:
95%
State:
92%
(% for various income ranges: 91.9% for AGIs below $25k, 93.3% for AGIs $25k-50k, 95.5% for AGIs $50k-75k, 100.0% for AGIs $75k-100k, 100.0% for AGIs $100k-200k)
Averages for the 2012 tax year for zip code 17264, filed in 2013:
Average Adjusted Gross Income (AGI) in 2012: $41,507 (Individual Income Tax Returns)
Here:
$41,507
State:
$61,346
Salary/wage: $38,795 (reported on 77.6% of returns)
Here:
$38,795
State:
$51,902
(% of AGI for various income ranges: 62.5% for AGIs below $25k, 68.6% for AGIs $25k-50k, 74.6% for AGIs $50k-75k, 79.7% for AGIs $75k-100k, 73.6% for AGIs $100k-200k)
Taxable interest for individuals: $969 (reported on 42.1% of returns)
This zip code:
$969
Pennsylvania:
$1,588
(% of AGI for various income ranges: 2.1% for AGIs below $25k, 1.1% for AGIs $25k-50k, 0.7% for AGIs $50k-75k, 1.4% for AGIs $75k-100k, 0.2% for AGIs $100k-200k)
Ordinary dividends: $829 (reported on 13.1% of returns)
Here:
$829
State:
$5,827
(% of AGI for various income ranges: 0.3% for AGIs below $25k, 0.4% for AGIs $25k-50k, 0.3% for AGIs $50k-75k, 0.4% for AGIs $75k-100k)
Net capital gain/loss in AGI: +$3,522 (reported on 8.4% of returns)
Here:
+$3,522
State:
+$14,495
(% of AGI for various income ranges: 0.2% for AGIs $25k-50k, 2.4% for AGIs $50k-75k)
Profit/loss from business: +$11,513 (reported on 14.0% of returns)
Here:
+$11,513
State:
+$16,268
(% of AGI for various income ranges: 8.0% for AGIs below $25k, 5.0% for AGIs $25k-50k, 4.7% for AGIs $50k-75k, 2.6% for AGIs $75k-100k)
Taxable individual retirement arrangement distribution: $9,300 (reported on 9.3% of returns)
17264:
$9,300
Pennsylvania:
$14,550
(% of AGI for various income ranges: 4.1% for AGIs below $25k, 2.9% for AGIs $25k-50k, 3.3% for AGIs $50k-75k)
Total itemized deductions: $16,989 (23% of AGI, reported on 16.8% of returns)
Here:
$16,989
State:
$23,538
Here:
22.8% of AGI
State:
18.4% of AGI
(% of AGI for various income ranges: 7.0% for AGIs $25k-50k, 6.9% for AGIs $50k-75k, 7.4% for AGIs $75k-100k, 10.2% for AGIs $100k-200k)
Charity contributions: $3,492 (reported on 12.1% of returns)
Here:
$3,492
State:
$4,025
(% of AGI for various income ranges: 0.8% for AGIs $25k-50k, 0.7% for AGIs $50k-75k, 1.6% for AGIs $75k-100k, 1.8% for AGIs $100k-200k)
Taxes paid: $4,806 (reported on 15.9% of returns)
17264:
$4,806
State:
$9,982
(% of AGI for various income ranges: 1.6% for AGIs $25k-50k, 1.8% for AGIs $50k-75k, 2.1% for AGIs $75k-100k, 3.1% for AGIs $100k-200k)
Earned income credit: $2,256 (reported on 15.0% of returns)
Here:
$2,256
State:
$2,106
(% of AGI for various income ranges: 4.6% for AGIs below $25k, 1.2% for AGIs $25k-50k)
Percentage of individuals using paid preparers for their 2012 taxes: 75.7%
Here:
76%
State:
53%
(% for various income ranges: 70.7% for AGIs below $25k, 80.6% for AGIs $25k-50k, 75.0% for AGIs $50k-75k, 77.8% for AGIs $75k-100k, 83.3% for AGIs $100k-200k)
Averages for the 2004 tax year for zip code 17264, filed in 2005:
Average Adjusted Gross Income (AGI) in 2004: $32,642 (Individual Income Tax Returns)
Here:
$32,642
State:
$48,049
Salary/wage: $31,496 (reported on 81.9% of returns)
Here:
$31,496
State:
$42,646
(% of AGI for various income ranges: 75.8% for AGIs below $10k, 64.9% for AGIs $10k-25k, 81.2% for AGIs $25k-50k, 83.3% for AGIs $50k-75k, 81.7% for AGIs $75k-100k, 72.0% for AGIs over 100k)
Taxable interest for individuals: $992 (reported on 49.7% of returns)
This zip code:
$992
Pennsylvania:
$1,657
(% of AGI for various income ranges: 5.0% for AGIs below $10k, 3.8% for AGIs $10k-25k, 1.1% for AGIs $25k-50k, 1.1% for AGIs $50k-75k, 1.0% for AGIs $75k-100k, 0.3% for AGIs over 100k)
Taxable dividends: $712 (reported on 15.8% of returns)
Here:
$712
State:
$3,566
(% of AGI for various income ranges: 3.1% for AGIs below $10k, 0.6% for AGIs $10k-25k, 0.3% for AGIs $25k-50k, 0.2% for AGIs $50k-75k, 0.2% for AGIs $75k-100k)
Net capital gain/loss: +$4,258 (reported on 9.0% of returns)
Here:
+$4,258
State:
+$9,716
(% of AGI for various income ranges: 0.7% for AGIs below $10k, 1.1% for AGIs $10k-25k, 0.3% for AGIs $25k-50k, 2.1% for AGIs $50k-75k, 2.1% for AGIs $75k-100k)
Profit/loss from business: +$8,466 (reported on 15.8% of returns)
Here:
+$8,466
State:
+$14,267
(% of AGI for various income ranges: 4.1% for AGIs below $10k, 7.7% for AGIs $10k-25k, 3.4% for AGIs $25k-50k, 3.5% for AGIs $50k-75k, 5.0% for AGIs $75k-100k)
IRA payment deduction: $2,867 (reported on 2.9% of returns)
17264:
$2,867
Pennsylvania:
$2,903
Total itemized deductions: $14,082 (24% of AGI, reported on 16.4% of returns)
Here:
$14,082
State:
$18,804
Here:
24.0% of AGI
State:
19.5% of AGI
(% of AGI for various income ranges: 4.0% for AGIs $10k-25k, 6.6% for AGIs $25k-50k, 7.5% for AGIs $50k-75k, 13.9% for AGIs $75k-100k)
Charity contributions deductions: $2,390 (4% of AGI, reported on 13.2% of returns)
Here:
$2,390
State:
$3,337
Here:
3.9% of AGI
State:
3.3% of AGI
Total tax: $3,382 (reported on 73.5% of returns)
17264:
$3,382
State:
$8,008
(% of AGI for various income ranges: 1.9% for AGIs below $10k, 4.3% for AGIs $10k-25k, 6.4% for AGIs $25k-50k, 8.3% for AGIs $50k-75k, 10.4% for AGIs $75k-100k, 16.2% for AGIs over 100k)
Earned income credit: $1,762 (reported on 16.6% of returns)
Here:
$1,762
State:
$1,643
Percentage of individuals using paid preparers for their 2004 taxes: 72.1%
Here:
72%
State:
56%
(% for various income ranges: 67.6% for AGIs below $10k, 71.9% for AGIs $10k-25k, 73.5% for AGIs $25k-50k, 73.9% for AGIs $50k-75k, 93.4% for AGIs $75k-100k)
Likely homosexual households (counted as self-reported same-sex unmarried-partner households)
Lesbian couples: 0.0% of all households
Gay men: 0.3% of all households
Household received Food Stamps/SNAP in the past 12 months: 131 Household did not receive Food Stamps/SNAP in the past 12 months: 807
Women who had a birth in the past 12 months: 10 (7 now married, 2 unmarried) Women who did not have a birth in the past 12 months: 396 (195 now married, 199 unmarried)
Housing units in zip code 17264 with a mortgage: 391 (28 second mortgage, 24 both second mortgage and home equity loan) Houses without a mortgage: 6
Median monthly owner costs for units with a mortgage: $1,210 Median monthly owner costs for units without a mortgage: $433
Residents with income below the poverty level in 2022:
This zip code:
13.5%
Whole state:
11.8%
Residents with income below 50% of the poverty level in 2022:
This zip code:
7.4%
Whole state:
6.1%
Median number of rooms in houses and condos:
Here:
6.2
State:
6.8
Median number of rooms in apartments:
Here:
5.2
State:
4.3
Notable locations in this zip code not listed on our city pages
Notable locations in zip code 17264: Hubelsville (A), Chilcote Corner (B), Wible Corner (C), Three Springs Volunteer Fire Company 12 (D). Display/hide their locations on the map
Churches in zip code 17264 include: McKendree Church (A), Meadow Green Church (B), Monroe Church (C), Mount Carmel Church (D), Cherry Grove Church (E), Oak Grove Church (F), Center Grove Church (G), Zion Church (H), Sugar Grove Church (I). Display/hide their locations on the map
Cemeteries: Ramsey Family Cemetery (1), Booth Family Cemetery (2), Flasher Family Cemetery (3), Kyler Family Cemetery (4), Chilcoat Family Cemetery (5), Saltillo Cemetery (6), Monroe Church Cemetery (7). Display/hide their locations on the map
Streams, rivers, and creeks: North Spring Branch (A), Sideling Hill Creek (B), Three Springs Creek (C), Elliot Run (D), Spring Creek (E), Sinking Run (F), Little Aughwick Creek (G), Carothers Gap Run (H), Laurel Run (I). Display/hide their locations on the map
Size of family households: 293 2-persons, 123 3-persons, 92 4-persons, 75 5-persons, 17 6-persons, 4 7-or-more-persons
Size of nonfamily households: 294 1-person, 30 2-persons, 6 3-persons
313 married couples with children.
74 single-parent households (44 men, 30 women).
98.8% of residents of 17264 zip code speak English at home.
0.1% of residents speak Spanish at home (100% very well).
0.5% of residents speak other Indo-European language at home (100% very well).
0.1% of residents speak other language at home (50% very well, 50% well).
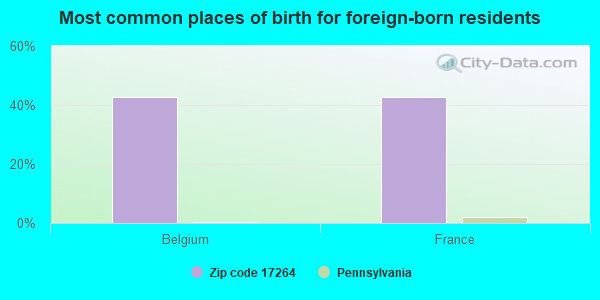
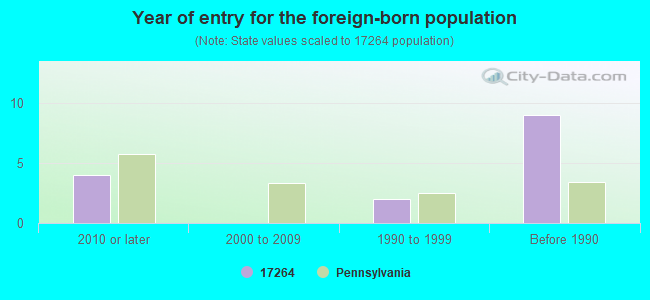
Foreign born population: 7 (0.3%) (43.9% of them are naturalized citizens)
This zip code:
0.3%
Whole state:
7.5%
43%Belgium
43%France
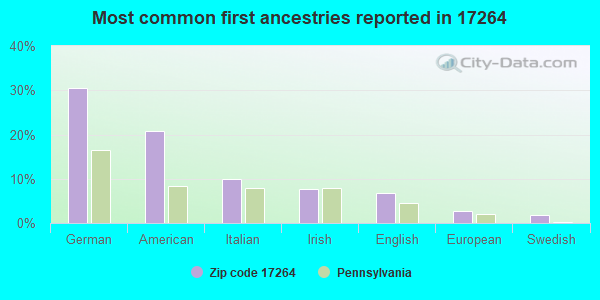
30%German
21%American
10%Italian
8%Irish
7%English
3%European
2%Swedish
Year of entry for the foreign-born population
42010 or later
02000 to 2009
21990 to 1999
9Before 1990
Housing units lacking complete plumbing facilities: 10.0% Housing units lacking complete kitchen facilities: 8.5%
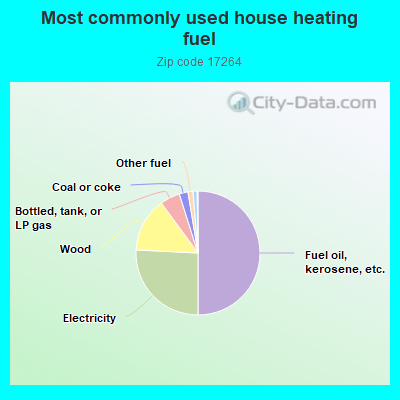
50.2%Fuel oil, kerosene, etc.
25.9%Electricity
14.2%Wood
5.2%Bottled, tank, or LP gas
2.3%Coal or coke
1.3%Other fuel
1.1%No fuel used
Population in 1990: 2,197. Population change in the 1990s: +141 (+6.4%).
Place of birth for U.S.-born residents:
This state: 1,979
Northeast: 53
Midwest: 10
South: 94
West: 11
78% of the 17264 zip code residents lived in the same house 5 years ago. Out of people who lived in different houses, 64% lived in this county. Out of people who lived in different counties, 50% lived in Pennsylvania.
96% of the 17264 zip code residents lived in the same house 1 year ago. Out of people who lived in different houses, 70% moved from this county. Out of people who lived in different houses, 16% moved from different county within same state. Out of people who lived in different houses, 16% moved from different state.
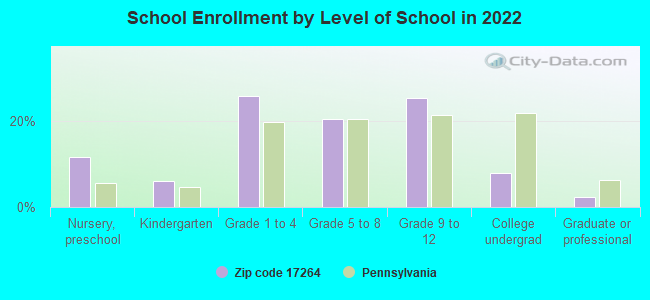
Private vs. public school enrollment:
Students in private schools in grades 1 to 8 (elementary and middle school): 19
Here:
9.7%
Pennsylvania:
15.7%
Students in private schools in grades 9 to 12 (high school): 27
Here:
25.4%
Pennsylvania:
13.4%
Students in private undergraduate colleges: 2
Here:
5.8%
Pennsylvania:
39.8%
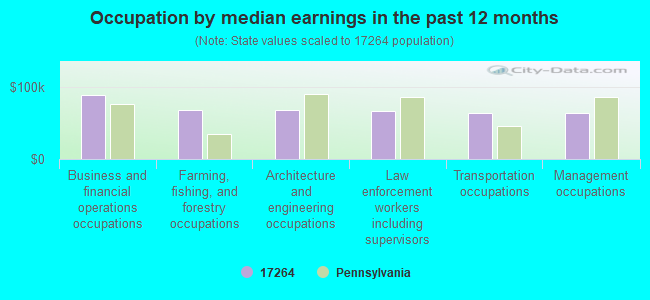
Occupation by median earnings in the past 12 months ($)
88,900Business and financial operations occupations
67,946Farming, fishing, and forestry occupations
67,888Architecture and engineering occupations
66,289Law enforcement workers including supervisors
63,758Transportation occupations
63,123Management occupations
Top industries in this zip code by the number of employees in 2005:
Accommodation and Food Services: Limited-Service Restaurants (5-9 employees: 2 establishments)
Wholesale Trade: Recyclable Material Merchant Wholesalers (5-9: 1)
Construction: Commercial and Institutional Building Construction (5-9: 1)
Other Services (except Public Administration): Religious Organizations (1-4: 2)
Construction: Residential Remodelers (1-4: 2)
Construction: Poured Concrete Foundation and Structure Contractors (1-4: 1)
Construction: Plumbing, Heating, and Air-Conditioning Contractors (1-4: 1)
Fatal accident statistics in 2010:
Fatal accident count: 2
Vehicles involved in fatal accidents: 2
Fatal accidents caused by drunken drivers: 0
Fatalities: 3
Persons involved in fatal accidents: 3
Pedestrians involved in fatal accidents: 0
2005 - 2018 National Fire Incident Reporting System (NFIRS) incidents
Based on the data from the years 2005 - 2018 the average number of fires per year is 9. The highest number of reported fire incidents - 18 took place in 2018, and the least - 1 in 2005. The data has a rising trend.
When looking into fire subcategories, the most reports belonged to: Structure Fires (58.1%), and Outside Fires (32.3%).
Fire incident types reported to NFIRS in Zip Code 17264
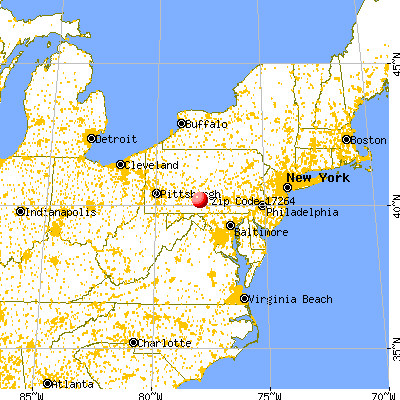


 Nearest zip codes: 17253, 16674, 17052, 17229, 17223, 16623.


 Based on the data from the years 2005 - 2018 the average number of fires per year is 9. The highest number of reported fire incidents - 18 took place in 2018, and the least - 1 in 2005. The data has a rising trend.
 When looking into fire subcategories, the most reports belonged to: Structure Fires (58.1%), and Outside Fires (32.3%).