Estimated zip code population in 2022: 15,031 Zip code population in 2010: 15,391 Zip code population in 2000: 14,154
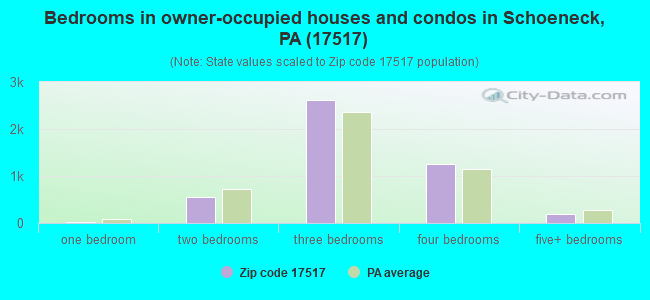
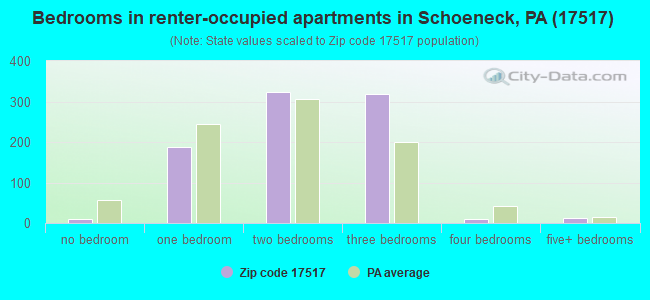
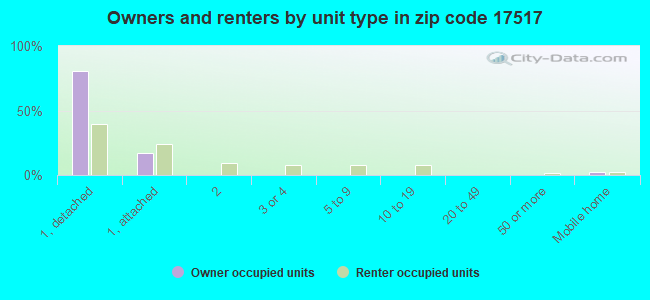
Houses and condos: 5,726 Renter-occupied apartments: 871
% of renters here:
16%
State:
31%
March 2022 cost of living index in zip code 17517: 94.7 (less than average, U.S. average is 100)
Land area: 34.9 sq. mi. Water area: 1.0 sq. mi.
Population density: 430 people per square mile
(low).
OSM Map
General Map
Google Map
MSN Map
OSM Map
General Map
Google Map
MSN Map
OSM Map
General Map
Google Map
MSN Map
OSM Map
General Map
Google Map
MSN Map
Please wait while loading the map...
Real estate property taxes paid for housing units in 2022:
This zip code:
1.4% ($3,925)
Pennsylvania:
1.3% ($3,094)
Median real estate property taxes paid for housing units with mortgages in 2022: $4,042 (1.5%) Median real estate property taxes paid for housing units with no mortgage in 2022: $3,777 (1.3%)
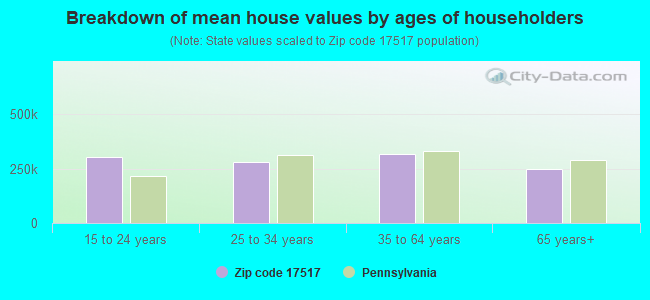
Estimated median house/condo value in 2022: $281,641
17517:
$281,641
Pennsylvania:
$245,500
According to our research of Pennsylvania and other state lists, there were 24 registered sex offenders living in 17517 zip code as of April 27, 2024. The ratio of all residents to sex offenders in zip code 17517 is 694 to 1. The ratio of registered sex offenders to all residents in this zip code is near the state average.
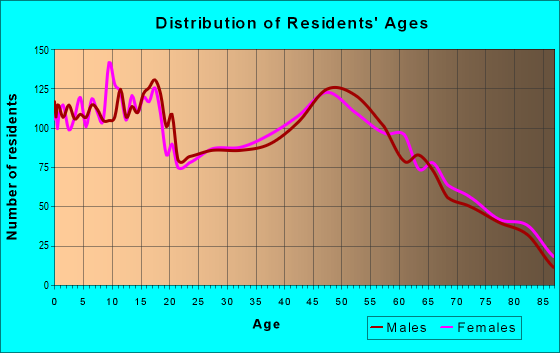
Median resident age:
This zip code:
40.7 years
Pennsylvania median age:
40.9 years
Average household size:
This zip code:
2.7 people
Pennsylvania:
2.4 people
Averages for the 2020 tax year for zip code 17517, filed in 2021:
Average Adjusted Gross Income (AGI) in 2020: $75,462 (Individual Income Tax Returns)
Here:
$75,462
State:
$75,707
Salary/wage: $59,651 (reported on 82.8% of returns)
Here:
$59,651
State:
$62,806
(% of AGI for various income ranges: 1224.3% for AGIs below $25k, 3587.7% for AGIs $25k-50k, 6949.6% for AGIs $50k-75k, 9865.4% for AGIs $75k-100k, 17623.8% for AGIs $100k-200k, 69512.2% for AGIs over 200k)
Taxable interest for individuals: $1,966 (reported on 33.0% of returns)
This zip code:
$1,966
Pennsylvania:
$1,633
(% of AGI for various income ranges: 34.8% for AGIs below $25k, 44.9% for AGIs $25k-50k, 46.6% for AGIs $50k-75k, 90.8% for AGIs $75k-100k, 121.9% for AGIs $100k-200k, 2357.8% for AGIs over 200k)
Ordinary dividends: $3,757 (reported on 21.2% of returns)
Here:
$3,757
State:
$7,382
(% of AGI for various income ranges: 39.5% for AGIs below $25k, 53.0% for AGIs $25k-50k, 85.7% for AGIs $50k-75k, 92.9% for AGIs $75k-100k, 195.5% for AGIs $100k-200k, 2426.7% for AGIs over 200k)
Net capital gain/loss in AGI: +$8,286 (reported on 18.3% of returns)
Here:
+$8,286
State:
+$23,522
(% of AGI for various income ranges: 12.7% for AGIs below $25k, 39.5% for AGIs $25k-50k, 66.3% for AGIs $50k-75k, 108.6% for AGIs $75k-100k, 517.2% for AGIs $100k-200k, 6575.6% for AGIs over 200k)
Profit/loss from business: +$22,642 (reported on 15.8% of returns)
Here:
+$22,642
State:
+$16,274
(% of AGI for various income ranges: 125.2% for AGIs below $25k, 226.4% for AGIs $25k-50k, 356.3% for AGIs $50k-75k, 623.5% for AGIs $75k-100k, 1021.6% for AGIs $100k-200k, 9345.6% for AGIs over 200k)
Taxable individual retirement arrangement distribution: $14,729 (reported on 11.4% of returns)
17517:
$14,729
Pennsylvania:
$18,583
(% of AGI for various income ranges: 116.9% for AGIs below $25k, 132.1% for AGIs $25k-50k, 205.8% for AGIs $50k-75k, 265.2% for AGIs $75k-100k, 503.2% for AGIs $100k-200k, 2726.7% for AGIs over 200k)
Self-employed (Keogh) retirement plans: $18,767 (reported on 0.4% of returns)
17517:
$18,767
Pennsylvania:
$25,407
(% of AGI for various income ranges: 70.4% for AGIs $100k-200k)
Total itemized deductions: $37,991 (reported on 7.3% of returns)
Here:
$37,991
State:
$34,850
(% of AGI for various income ranges: 42.7% for AGIs below $25k, 92.1% for AGIs $25k-50k, 222.8% for AGIs $50k-75k, 319.2% for AGIs $75k-100k, 814.6% for AGIs $100k-200k, 10837.8% for AGIs over 200k)
Charity contributions: $20,806 (reported on 6.1% of returns)
Here:
$20,806
State:
$12,392
(% of AGI for various income ranges: 24.5% for AGIs $25k-50k, 29.0% for AGIs $50k-75k, 88.7% for AGIs $75k-100k, 272.9% for AGIs $100k-200k, 7406.7% for AGIs over 200k)
Taxes paid: $8,322 (reported on 7.3% of returns)
17517:
$8,322
State:
$8,200
(% of AGI for various income ranges: 9.0% for AGIs below $25k, 22.8% for AGIs $25k-50k, 63.7% for AGIs $50k-75k, 95.4% for AGIs $75k-100k, 229.6% for AGIs $100k-200k, 1560.0% for AGIs over 200k)
Earned income credit: $2,043 (reported on 8.2% of returns)
Here:
$2,043
State:
$2,100
(% of AGI for various income ranges: 48.9% for AGIs below $25k, 51.1% for AGIs $25k-50k, 1.5% for AGIs $50k-75k)
Percentage of individuals using paid preparers for their 2020 taxes: 93.0%
Here:
93%
State:
92%
(% for various income ranges: 92.3% for AGIs below $25k, 93.1% for AGIs $25k-50k, 92.2% for AGIs $50k-75k, 93.7% for AGIs $75k-100k, 93.5% for AGIs $100k-200k, 97.0% for AGIs over 200k)
Averages for the 2012 tax year for zip code 17517, filed in 2013:
Average Adjusted Gross Income (AGI) in 2012: $55,701 (Individual Income Tax Returns)
Here:
$55,701
State:
$61,346
Salary/wage: $47,412 (reported on 83.7% of returns)
Here:
$47,412
State:
$51,902
(% of AGI for various income ranges: 69.8% for AGIs below $25k, 77.4% for AGIs $25k-50k, 77.8% for AGIs $50k-75k, 78.3% for AGIs $75k-100k, 77.7% for AGIs $100k-200k, 40.1% for AGIs over 200k)
Taxable interest for individuals: $1,456 (reported on 38.8% of returns)
This zip code:
$1,456
Pennsylvania:
$1,588
(% of AGI for various income ranges: 2.2% for AGIs below $25k, 1.0% for AGIs $25k-50k, 0.8% for AGIs $50k-75k, 0.8% for AGIs $75k-100k, 0.7% for AGIs $100k-200k, 1.5% for AGIs over 200k)
Ordinary dividends: $3,469 (reported on 22.0% of returns)
Here:
$3,469
State:
$5,827
(% of AGI for various income ranges: 2.0% for AGIs below $25k, 1.1% for AGIs $25k-50k, 0.8% for AGIs $50k-75k, 0.7% for AGIs $75k-100k, 1.3% for AGIs $100k-200k, 2.8% for AGIs over 200k)
Net capital gain/loss in AGI: +$6,269 (reported on 13.4% of returns)
Here:
+$6,269
State:
+$14,495
(% of AGI for various income ranges: 0.6% for AGIs $25k-50k, 0.5% for AGIs $50k-75k, 0.8% for AGIs $75k-100k, 1.7% for AGIs $100k-200k, 4.9% for AGIs over 200k)
Profit/loss from business: +$15,847 (reported on 15.8% of returns)
Here:
+$15,847
State:
+$16,268
(% of AGI for various income ranges: 7.1% for AGIs below $25k, 4.7% for AGIs $25k-50k, 4.3% for AGIs $50k-75k, 4.2% for AGIs $75k-100k, 4.2% for AGIs $100k-200k, 4.2% for AGIs over 200k)
Taxable individual retirement arrangement distribution: $10,384 (reported on 12.2% of returns)
17517:
$10,384
Pennsylvania:
$14,550
(% of AGI for various income ranges: 5.5% for AGIs below $25k, 2.6% for AGIs $25k-50k, 2.2% for AGIs $50k-75k, 2.4% for AGIs $75k-100k, 2.6% for AGIs $100k-200k)
Self-employment retirement plans: $11,733 (reported on 0.4% of returns)
17517:
$11,733
Pennsylvania:
$20,922
Total itemized deductions: $20,706 (21% of AGI, reported on 36.2% of returns)
Here:
$20,706
State:
$23,538
Here:
20.9% of AGI
State:
18.4% of AGI
(% of AGI for various income ranges: 9.2% for AGIs below $25k, 9.7% for AGIs $25k-50k, 13.8% for AGIs $50k-75k, 15.7% for AGIs $75k-100k, 16.4% for AGIs $100k-200k, 11.7% for AGIs over 200k)
Charity contributions: $4,949 (reported on 29.8% of returns)
Here:
$4,949
State:
$4,025
(% of AGI for various income ranges: 0.9% for AGIs below $25k, 1.4% for AGIs $25k-50k, 2.2% for AGIs $50k-75k, 2.7% for AGIs $75k-100k, 3.0% for AGIs $100k-200k, 4.5% for AGIs over 200k)
Taxes paid: $8,102 (reported on 36.1% of returns)
17517:
$8,102
State:
$9,982
(% of AGI for various income ranges: 2.6% for AGIs below $25k, 3.2% for AGIs $25k-50k, 5.1% for AGIs $50k-75k, 6.2% for AGIs $75k-100k, 6.9% for AGIs $100k-200k, 4.9% for AGIs over 200k)
Earned income credit: $1,876 (reported on 10.7% of returns)
Here:
$1,876
State:
$2,106
(% of AGI for various income ranges: 3.2% for AGIs below $25k, 0.9% for AGIs $25k-50k)
Percentage of individuals using paid preparers for their 2012 taxes: 58.9%
Here:
59%
State:
53%
(% for various income ranges: 52.5% for AGIs below $25k, 59.5% for AGIs $25k-50k, 64.8% for AGIs $50k-75k, 63.7% for AGIs $75k-100k, 59.5% for AGIs $100k-200k, 80.0% for AGIs over 200k)
Averages for the 2004 tax year for zip code 17517, filed in 2005:
Average Adjusted Gross Income (AGI) in 2004: $47,183 (Individual Income Tax Returns)
Here:
$47,183
State:
$48,049
Salary/wage: $41,942 (reported on 84.8% of returns)
Here:
$41,942
State:
$42,646
(% of AGI for various income ranges: 92.0% for AGIs below $10k, 70.7% for AGIs $10k-25k, 81.8% for AGIs $25k-50k, 83.0% for AGIs $50k-75k, 83.8% for AGIs $75k-100k, 59.1% for AGIs over 100k)
Taxable interest for individuals: $1,406 (reported on 53.0% of returns)
This zip code:
$1,406
Pennsylvania:
$1,657
(% of AGI for various income ranges: 8.3% for AGIs below $10k, 4.5% for AGIs $10k-25k, 1.5% for AGIs $25k-50k, 1.0% for AGIs $50k-75k, 1.0% for AGIs $75k-100k, 1.4% for AGIs over 100k)
Taxable dividends: $2,423 (reported on 26.3% of returns)
Here:
$2,423
State:
$3,566
(% of AGI for various income ranges: 3.8% for AGIs below $10k, 1.8% for AGIs $10k-25k, 0.9% for AGIs $25k-50k, 0.7% for AGIs $50k-75k, 0.5% for AGIs $75k-100k, 2.5% for AGIs over 100k)
Net capital gain/loss: +$10,217 (reported on 18.4% of returns)
Here:
+$10,217
State:
+$9,716
(% of AGI for various income ranges: -2.6% for AGIs below $10k, 0.3% for AGIs $10k-25k, 0.6% for AGIs $25k-50k, 0.4% for AGIs $50k-75k, 1.7% for AGIs $75k-100k, 12.4% for AGIs over 100k)
Profit/loss from business: +$17,009 (reported on 16.2% of returns)
Here:
+$17,009
State:
+$14,267
(% of AGI for various income ranges: 7.3% for AGIs below $10k, 7.0% for AGIs $10k-25k, 5.1% for AGIs $25k-50k, 5.1% for AGIs $50k-75k, 4.6% for AGIs $75k-100k, 7.4% for AGIs over 100k)
Profit/loss from farming: +$4,394 (reported on 1.4% of returns)
Here:
+$4,394
State:
+$274
(% of AGI for various income ranges: -0.3% for AGIs below $10k, 0.7% for AGIs $10k-25k, 0.3% for AGIs $25k-50k, 0.5% for AGIs $50k-75k, -0.7% for AGIs $75k-100k)
IRA payment deduction: $3,037 (reported on 3.7% of returns)
17517:
$3,037
Pennsylvania:
$2,903
(% of AGI for various income ranges: 0.4% for AGIs $10k-25k, 0.4% for AGIs $25k-50k, 0.2% for AGIs $50k-75k, 0.2% for AGIs $75k-100k, 0.1% for AGIs over 100k)
Self-employed pension: $11,891 (reported on 0.7% of returns)
Here:
$11,891
Pennsylvania:
$14,674
Total itemized deductions: $16,468 (21% of AGI, reported on 38.4% of returns)
Here:
$16,468
State:
$18,804
Here:
21.1% of AGI
State:
19.5% of AGI
(% of AGI for various income ranges: 10.5% for AGIs below $10k, 9.9% for AGIs $10k-25k, 10.9% for AGIs $25k-50k, 14.8% for AGIs $50k-75k, 15.7% for AGIs $75k-100k, 13.5% for AGIs over 100k)
Charity contributions deductions: $3,541 (4% of AGI, reported on 33.3% of returns)
Here:
$3,541
State:
$3,337
Here:
4.3% of AGI
State:
3.3% of AGI
(% of AGI for various income ranges: 0.7% for AGIs below $10k, 1.4% for AGIs $10k-25k, 1.6% for AGIs $25k-50k, 2.2% for AGIs $50k-75k, 2.5% for AGIs $75k-100k, 3.8% for AGIs over 100k)
Total tax: $6,169 (reported on 79.5% of returns)
17517:
$6,169
State:
$8,008
(% of AGI for various income ranges: 2.9% for AGIs below $10k, 5.0% for AGIs $10k-25k, 7.1% for AGIs $25k-50k, 8.3% for AGIs $50k-75k, 10.1% for AGIs $75k-100k, 16.6% for AGIs over 100k)
Earned income credit: $1,525 (reported on 7.5% of returns)
Here:
$1,525
State:
$1,643
Percentage of individuals using paid preparers for their 2004 taxes: 62.9%
Here:
63%
State:
56%
(% for various income ranges: 53.9% for AGIs below $10k, 63.5% for AGIs $10k-25k, 65.7% for AGIs $25k-50k, 64.3% for AGIs $50k-75k, 63.8% for AGIs $75k-100k, 68.6% for AGIs over 100k)
Likely homosexual households (counted as self-reported same-sex unmarried-partner households)
Lesbian couples: 0.3% of all households
Gay men: 0.0% of all households
Household received Food Stamps/SNAP in the past 12 months: 275 Household did not receive Food Stamps/SNAP in the past 12 months: 5,200
Women who had a birth in the past 12 months: 193 (184 now married, 18 unmarried) Women who did not have a birth in the past 12 months: 2,980 (1,589 now married, 1,376 unmarried)
Housing units in zip code 17517 with a mortgage: 2,712 (379 second mortgage, 3 home equity loan, 345 both second mortgage and home equity loan) Houses without a mortgage: 83
Median monthly owner costs for units with a mortgage: $1,663 Median monthly owner costs for units without a mortgage: $707
Residents with income below the poverty level in 2022:
This zip code:
5.7%
Whole state:
11.8%
Residents with income below 50% of the poverty level in 2022:
This zip code:
3.3%
Whole state:
6.1%
Median number of rooms in houses and condos:
Here:
6.9
State:
6.8
Median number of rooms in apartments:
Here:
5.2
State:
4.3
Notable locations in this zip code not listed on our city pages
Notable locations in zip code 17517: Hawk Valley Public Golf Course (A), Furnace Hills Camp (B), Cocalico Sportsman Club (C), Union House (D), Fivepointville Fire Company (E), Smokestown Fire Company 1 Station 1 - 11 (F), Denver Fire Company 1 Station 1 - 3 (G), Bowmansville Fire Company Station 3 - 3 (H). Display/hide their locations on the map
Churches in zip code 17517 include: White Oak Church (A), Grace Chapel (B), Saint Johns Chapel (C), Muddy Creek Church (D), Bible Conference Church (E). Display/hide their locations on the map
2,955 married couples with children.
316 single-parent households (190 men, 126 women).
89.9% of residents of 17517 zip code speak English at home.
2.6% of residents speak Spanish at home (68% very well, 10% well, 22% not well).
6.7% of residents speak other Indo-European language at home (65% very well, 26% well, 9% not well).
0.4% of residents speak Asian or Pacific Island language at home (46% very well, 54% well).
0.1% of residents speak other language at home (100% very well).
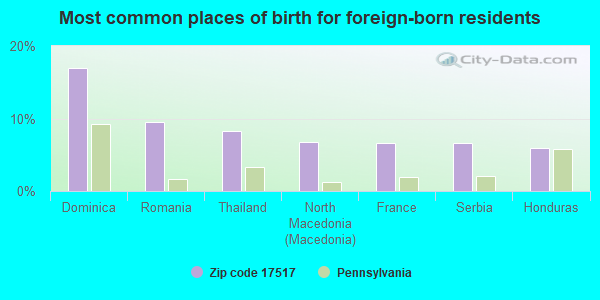
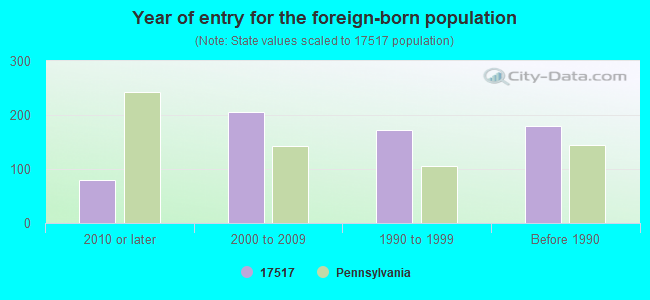
Foreign born population: 558 (3.7%) (52.2% of them are naturalized citizens)
This zip code:
3.7%
Whole state:
7.5%
17%Dominica
9%Romania
8%Thailand
7%North Macedonia (Macedonia)
7%France
7%Serbia
6%Honduras
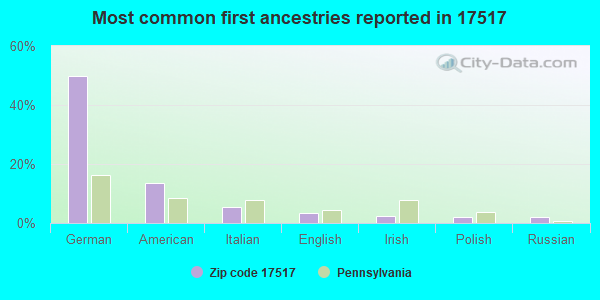
50%German
13%American
5%Italian
3%English
2%Irish
2%Polish
2%Russian
Year of entry for the foreign-born population
792010 or later
2052000 to 2009
1721990 to 1999
179Before 1990
Facilities with environmental interests located in this zip code:
BERKLEY PRODUCTS (230 WALLUPS HILL RD RD# 2 in DENVER, PA)
SUPERFUND NPL (Superfund database) (Integrated Compliance Information System) - ICIS-03-2001-0285, FORMAL ENFORCEMENT ACTION, ICIS-03-1999-0320, Small Quantity Generators, between 100 kg and 1000 kg of hazardous waste/month (Resource Conservation and Recovery Act (tracking hazardous waste)) - notification TRANSPORTER (Resource Conservation and Recovery Act (tracking hazardous waste)) - notification Business SIC classification: AIR AND WATER RESOURCE AND SOLID WASTE MANAGEMENT Organizations: OPERNAME (CONTACT/OPERATOR)
, CHARLES BEWLEY (CONTACT/OWNER)
Alternative names: BERKLEY PROD CO DUMP, SCHOENECK LANDFILL
BEILER PRINTING (115 N KING ST in DENVER, PA)
STATE MASTER (Pennsylvania database) - RCRIS-PA0000996777, HAZARDOUS WASTE PROGRAM Conditionally Exempt Small Quantity Generators, less than 100 kg/month of hazardous waste (Resource Conservation and Recovery Act (tracking hazardous waste)) Business NAICS classification: OTHER COMMERCIAL PRINTING.
ACME/COCALICO DIST CENTER (500 S MUDDY CREEK RD in DENVER, PA)
National Pollutant Discharge Elimination System NON-MAJOR (Tracking pollutant discharge elimination systems) - permit Business SIC classification: REFRIGERATED WAREHOUSING AND STORAGE Alternative names: ALBERTSONS INC, AMERICAN STORES PROPERTIES INC, ASP REALTY INC
ADAMSTOWN WWTP (235 E SWARTZVILLE RD in DENVER, PA)
National Pollutant Discharge Elimination System NON-MAJOR (Tracking pollutant discharge elimination systems) - permit Business SIC classification: SEWERAGE SYSTEMS Alternative names: ADAMSTOWN BORO AUTH OF LANCAST
AMERICAN FURNITURE RESTORATION (735 POPLAR ST in DENVER, PA)
Conditionally Exempt Small Quantity Generators, less than 100 kg/month of hazardous waste (Resource Conservation and Recovery Act (tracking hazardous waste)) - notification Organizations: FICK WILLIAM (CONTACT/OWNER)
Housing units lacking complete plumbing facilities: 0.4% Housing units lacking complete kitchen facilities: 0.6%
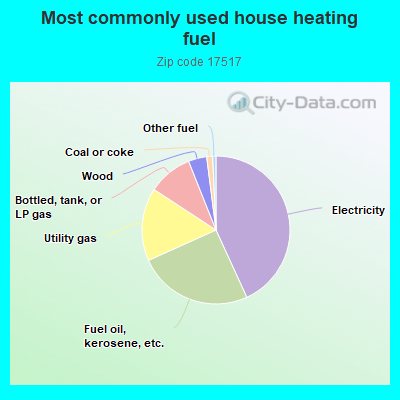
43.0%Electricity
25.0%Fuel oil, kerosene, etc.
15.9%Utility gas
9.7%Bottled, tank, or LP gas
4.0%Wood
1.3%Coal or coke
0.7%Other fuel
Population in 1990: 10,737. Population change in the 1990s: +3,417 (+31.8%).
Place of birth for U.S.-born residents:
This state: 12,140
Northeast: 775
Midwest: 389
South: 768
West: 222
63% of the 17517 zip code residents lived in the same house 5 years ago. Out of people who lived in different houses, 72% lived in this county. Out of people who lived in different counties, 50% lived in Pennsylvania.
95% of the 17517 zip code residents lived in the same house 1 year ago. Out of people who lived in different houses, 67% moved from this county. Out of people who lived in different houses, 27% moved from different county within same state. Out of people who lived in different houses, 9% moved from different state.
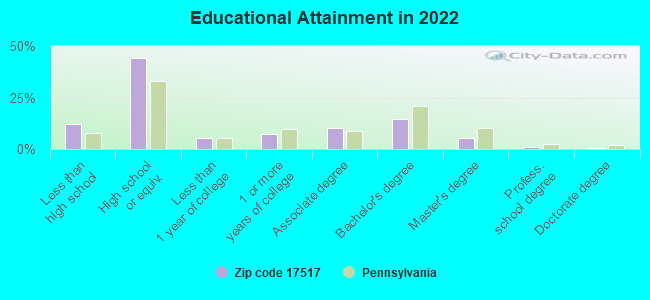
Private vs. public school enrollment:
Students in private schools in grades 1 to 8 (elementary and middle school): 500
Here:
26.4%
Pennsylvania:
15.7%
Students in private schools in grades 9 to 12 (high school): 117
Here:
16.0%
Pennsylvania:
13.4%
Students in private undergraduate colleges: 76
Here:
28.2%
Pennsylvania:
39.8%
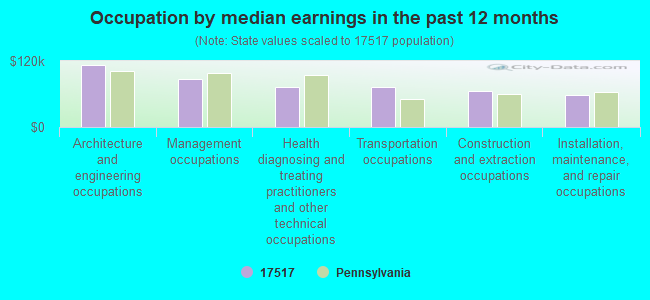
Occupation by median earnings in the past 12 months ($)
112,711Architecture and engineering occupations
86,485Management occupations
73,074Health diagnosing and treating practitioners and other technical occupations
73,066Transportation occupations
66,026Construction and extraction occupations
57,479Installation, maintenance, and repair occupations
Companies with federal contracts located in this zip code (DENVER, PA):
COVANCE RESEARCH PRODUCTS INC (310 SWAMPBRIDGE RD; small business) : $12,270,001 in 103 contractsfrom 2000 to 2006
Contracts for Miscellaneous Items, Live Animals, Not Raised for Food, Well Drilling/Exploratory Services, Other Professional Services, and moreby National Institutes of Health, Army, Department of Defense, Centers for Disease Control and Prevention, and others Signed by year:2000: $3,240,919; 2001: $2,005,600; 2002: $2,189,535; 2003: $297,681; 2004: $2,080,849; 2005: $1,174,274; 2006: $1,281,143.
Biggest contracts:
$3,091,000 with National Institutes of Health for Miscellaneous Items. Signed on 2000-03-15. Completion date: 2005-11-15.
$2,202,000, same as above.Signed on 2001-02-15. Completion date: 2005-11-15.
$1,015,000, same as above.Signed on 2002-01-15. Completion date: 2005-11-15.
$903,600 with Army for Live Animals, Not Raised for Food. Taking place in TX. Signed on 2004-11-05. Completion date: 2005-01-31.
BERNARD MORRISSEY INSURANCE (890 N READING RD; small business)
$147,000 with Agricultural Stabilization and Conservation Service (disused code) for Other Photographic, Mapping, Printing, and Publication Services. Taking place in DC. Signed on 2001-07-15. Completion date: 2001-09-15.
TOTAL WEED CONTROL INC (1380 READING RD; small business) : $79,214 in 4 contractsfrom 2001 to 2004
$39,223 with Navy for Landscaping/Groundskeeping Services. Taking place in NJ. Signed on 2002-12-30. Completion date: 2002-12-31.
$39,223, same as above.Signed on 2001-12-21. Completion date: 2002-12-31.
$39,223, same as above.Signed on 2001-08-09. Completion date: 2002-08-24.
-$38,455 with Navy for Insect and Rodent Control Services. Taking place in NJ. Signed on 2004-12-08. Completion date: 2005-12-31.
WEAVER INDUSTRIES INC (425 SOUTH 4TH STREET; small business) : $70,448 in 3 contractsfrom 2001 to 2005
$32,900 with Navy for Miscellaneous Maintenance and Repair Shop Specialized Equipment. Signed on 2002-05-08. Completion date: 2002-06-26.
$25,333 with Navy for Aircraft Ground Servicing Equipment. Signed on 2001-06-29. Completion date: 2001-07-25.
$12,215 with Navy for Miscellaneous Items. Signed on 2005-07-14. Completion date: 2005-08-12.
VISUAL INFORMATION SERVICES CO (105 HAWK VALLEY LN; small business)
$57,000 with Army for Signs, Advertising Displays, and Identification Plates. Signed on 2003-08-13. Completion date: 2003-10-01.
BRUNE ABRASIVE SERVICE CO INC (169 BONVIEW DR; small business) : $25,311 in 5 contractsfrom 2005 to 2006
Contracts for Disks and Stones, Abrasive, Machine Tool Accessories, Fans, Air Circulators, and Blower Equipment, Engine Electrical System Components, Aircraft Prime Moving by Defense Logistics Agency Signed by year:2000: $0; 2001: $0; 2002: $0; 2003: $0; 2004: $0; 2005: $13,925; 2006: $11,386.
Biggest contracts:
$5,718 with Defense Logistics Agency for Disks and Stones, Abrasive. Signed on 2006-05-11. Completion date: 2006-06-07.
$5,668 with Defense Logistics Agency for Machine Tool Accessories. Signed on 2006-05-09. Completion date: 2006-06-01.
$5,424 with Defense Logistics Agency for Fans, Air Circulators, and Blower Equipment. Signed on 2005-11-11. Completion date: 2005-12-09.
$4,444 with Defense Logistics Agency for Machine Tool Accessories. Signed on 2005-07-29. Completion date: 2005-08-25.
M G S INC (178 MUDDY CREEK CHURCH RD; small business)
$14,100 with Navy for Trailers. Signed on 2004-07-13. Completion date: 2004-10-15.
EMP OPERATING CORPORATION (1 DENVER ROAD; small business) : $4,547 in 3 contractsin 2004
$5,250 with Navy for Lease or Rental of Facilities -- Conference Space and Facilities. Signed on 2004-09-16. Completion date: 2004-09-30.
$1,489, same as above.Signed on 2004-09-13. Completion date: 2004-09-30.
-$2,192, same as above.Signed on 2004-10-01. Completion date: 2001-06-01.
Top industries in this zip code by the number of employees in 2005:
Wholesale Trade: Medical, Dental, and Hospital Equipment and Supplies Merchant Wholesalers (250-499 employees: 1 establishment)
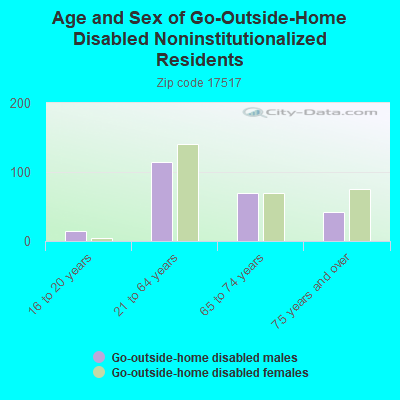
People in group quarters in 2010:
96 people in nursing facilities/skilled-nursing facilities
People in group quarters in 2000:
137 people in nursing homes
Fatal accident statistics in 2014:
Fatal accident count: 2
Vehicles involved in fatal accidents: 2
Fatal accidents caused by drunken drivers: 1
Fatalities: 2
Persons involved in fatal accidents: 2
Pedestrians involved in fatal accidents: 0
Fatal accident statistics in 2012:
Fatal accident count: 3
Vehicles involved in fatal accidents: 5
Fatal accidents caused by drunken drivers: 1
Fatalities: 4
Persons involved in fatal accidents: 11
Pedestrians involved in fatal accidents: 0
Home Mortgage Disclosure Act Aggregated Statistics For Year 2009 (Based on 2 full and 6 partial tracts)
A) FHA, FSA/RHS & VA Home Purchase Loans
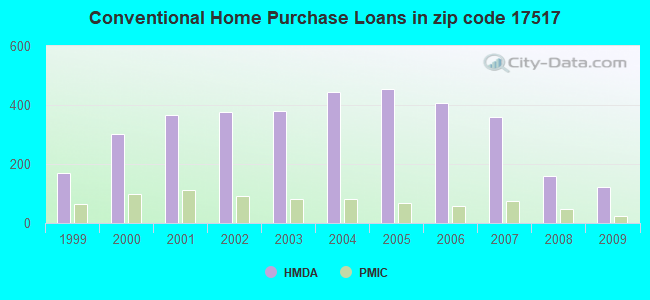
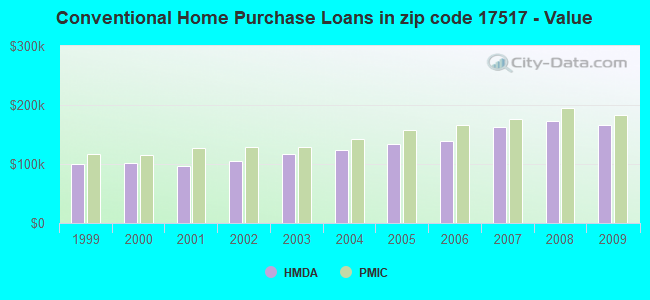
B) Conventional Home Purchase Loans
C) Refinancings
D) Home Improvement Loans
E) Loans on Dwellings For 5+ Families
F) Non-occupant Loans on < 5 Family Dwellings (A B C & D)
G) Loans On Manufactured Home Dwelling (A B C & D)
Number
Average Value
Number
Average Value
Number
Average Value
Number
Average Value
Number
Average Value
Number
Average Value
Number
Average Value
LOANS ORIGINATED
131
$165,529
122
$165,470
645
$158,558
93
$66,756
2
$88,380
23
$103,356
9
$63,948
APPLICATIONS APPROVED, NOT ACCEPTED
5
$144,438
7
$99,760
47
$146,766
7
$79,779
2
$298,730
1
$84,620
3
$58,017
APPLICATIONS DENIED
9
$94,710
10
$89,365
174
$178,714
30
$40,363
0
$0
9
$96,039
4
$27,570
APPLICATIONS WITHDRAWN
6
$179,093
8
$191,688
96
$191,152
8
$127,595
2
$218,620
1
$219,120
3
$34,580
FILES CLOSED FOR INCOMPLETENESS
2
$152,210
3
$57,357
19
$151,627
0
$0
0
$0
0
$0
1
$9,960
Aggregated Statistics For Year 2008 (Based on 2 full and 6 partial tracts)
A) FHA, FSA/RHS & VA Home Purchase Loans
B) Conventional Home Purchase Loans
C) Refinancings
D) Home Improvement Loans
E) Loans on Dwellings For 5+ Families
F) Non-occupant Loans on < 5 Family Dwellings (A B C & D)
G) Loans On Manufactured Home Dwelling (A B C & D)
Number
Average Value
Number
Average Value
Number
Average Value
Number
Average Value
Number
Average Value
Number
Average Value
Number
Average Value
LOANS ORIGINATED
63
$165,242
161
$173,188
386
$138,503
103
$56,914
0
$0
57
$173,311
12
$54,843
APPLICATIONS APPROVED, NOT ACCEPTED
0
$0
11
$164,200
49
$122,059
14
$23,431
0
$0
2
$158,810
3
$33,433
APPLICATIONS DENIED
7
$161,843
31
$150,306
214
$154,847
62
$51,699
0
$0
8
$143,414
8
$63,515
APPLICATIONS WITHDRAWN
2
$164,320
8
$180,945
83
$177,938
7
$49,667
2
$236,550
4
$129,338
1
$64,300
FILES CLOSED FOR INCOMPLETENESS
1
$158,670
7
$140,686
21
$152,853
2
$187,495
0
$0
2
$112,930
1
$49,800
Aggregated Statistics For Year 2007 (Based on 2 full and 6 partial tracts)
A) FHA, FSA/RHS & VA Home Purchase Loans
B) Conventional Home Purchase Loans
C) Refinancings
D) Home Improvement Loans
E) Loans on Dwellings For 5+ Families
F) Non-occupant Loans on < 5 Family Dwellings (A B C & D)
G) Loans On Manufactured Home Dwelling (A B C & D)
Number
Average Value
Number
Average Value
Number
Average Value
Number
Average Value
Number
Average Value
Number
Average Value
Number
Average Value
LOANS ORIGINATED
60
$164,535
359
$162,473
415
$132,068
215
$48,925
3
$89,073
38
$143,285
13
$43,612
APPLICATIONS APPROVED, NOT ACCEPTED
0
$0
25
$152,015
68
$133,292
28
$49,070
0
$0
9
$173,087
2
$67,165
APPLICATIONS DENIED
7
$153,769
36
$138,633
317
$155,985
73
$84,713
0
$0
11
$155,775
16
$34,524
APPLICATIONS WITHDRAWN
1
$93,090
21
$152,048
116
$162,433
17
$69,534
1
$494,600
7
$166,250
2
$34,125
FILES CLOSED FOR INCOMPLETENESS
0
$0
8
$152,891
41
$160,898
2
$17,805
0
$0
1
$204,760
0
$0
Aggregated Statistics For Year 2006 (Based on 2 full and 6 partial tracts)
A) FHA, FSA/RHS & VA Home Purchase Loans
B) Conventional Home Purchase Loans
C) Refinancings
D) Home Improvement Loans
E) Loans on Dwellings For 5+ Families
F) Non-occupant Loans on < 5 Family Dwellings (A B C & D)
G) Loans On Manufactured Home Dwelling (A B C & D)
Number
Average Value
Number
Average Value
Number
Average Value
Number
Average Value
Number
Average Value
Number
Average Value
Number
Average Value
LOANS ORIGINATED
35
$151,229
407
$138,953
614
$109,481
193
$49,572
5
$150,852
54
$126,458
16
$44,809
APPLICATIONS APPROVED, NOT ACCEPTED
0
$0
26
$105,690
95
$124,640
20
$48,647
0
$0
10
$137,851
4
$56,830
APPLICATIONS DENIED
7
$116,486
48
$168,796
282
$150,534
86
$73,557
0
$0
10
$238,236
7
$95,933
APPLICATIONS WITHDRAWN
1
$303,780
32
$140,215
222
$140,378
16
$61,563
0
$0
2
$160,945
1
$35,610
FILES CLOSED FOR INCOMPLETENESS
0
$0
11
$155,923
48
$139,480
8
$89,770
0
$0
1
$159,360
1
$46,490
Aggregated Statistics For Year 2005 (Based on 2 full and 6 partial tracts)
A) FHA, FSA/RHS & VA Home Purchase Loans
B) Conventional Home Purchase Loans
C) Refinancings
D) Home Improvement Loans
E) Loans on Dwellings For 5+ Families
F) Non-occupant Loans on < 5 Family Dwellings (A B C & D)
G) Loans On Manufactured Home Dwelling (A B C & D)
Number
Average Value
Number
Average Value
Number
Average Value
Number
Average Value
Number
Average Value
Number
Average Value
Number
Average Value
LOANS ORIGINATED
31
$170,014
455
$133,707
641
$107,718
187
$39,797
3
$1,746,677
37
$96,565
11
$64,890
APPLICATIONS APPROVED, NOT ACCEPTED
3
$164,340
25
$93,357
97
$101,211
18
$41,224
0
$0
8
$55,406
4
$40,545
APPLICATIONS DENIED
4
$144,798
43
$89,434
305
$122,137
59
$36,851
2
$2,887,080
23
$87,291
17
$48,911
APPLICATIONS WITHDRAWN
1
$113,760
26
$115,407
256
$141,817
31
$135,723
0
$0
6
$194,802
1
$139,440
FILES CLOSED FOR INCOMPLETENESS
0
$0
9
$183,300
30
$147,970
3
$60,757
0
$0
0
$0
0
$0
Aggregated Statistics For Year 2004 (Based on 2 full and 6 partial tracts)
A) FHA, FSA/RHS & VA Home Purchase Loans
B) Conventional Home Purchase Loans
C) Refinancings
D) Home Improvement Loans
E) Loans on Dwellings For 5+ Families
F) Non-occupant Loans on < 5 Family Dwellings (A B C & D)
G) Loans On Manufactured Home Dwelling (A B C & D)
Number
Average Value
Number
Average Value
Number
Average Value
Number
Average Value
Number
Average Value
Number
Average Value
Number
Average Value
LOANS ORIGINATED
62
$126,065
443
$124,376
646
$105,521
175
$31,747
1
$220,120
48
$108,971
11
$57,637
APPLICATIONS APPROVED, NOT ACCEPTED
1
$148,400
33
$102,128
83
$104,608
16
$46,362
0
$0
4
$89,365
2
$78,770
APPLICATIONS DENIED
12
$104,382
43
$112,305
288
$117,916
66
$42,364
0
$0
15
$140,144
13
$57,307
APPLICATIONS WITHDRAWN
0
$0
40
$115,855
323
$129,403
12
$44,262
2
$3,731,600
6
$83,515
1
$19,780
FILES CLOSED FOR INCOMPLETENESS
1
$151,350
4
$103,890
39
$137,882
3
$59,530
0
$0
0
$0
0
$0
Aggregated Statistics For Year 2003 (Based on 2 full and 6 partial tracts)
A) FHA, FSA/RHS & VA Home Purchase Loans
B) Conventional Home Purchase Loans
C) Refinancings
D) Home Improvement Loans
E) Loans on Dwellings For 5+ Families
F) Non-occupant Loans on < 5 Family Dwellings (A B C & D)
Number
Average Value
Number
Average Value
Number
Average Value
Number
Average Value
Number
Average Value
Number
Average Value
LOANS ORIGINATED
76
$122,699
378
$117,606
1,280
$105,709
121
$28,877
2
$111,550
58
$86,954
APPLICATIONS APPROVED, NOT ACCEPTED
1
$112,770
25
$100,394
179
$101,732
21
$58,151
0
$0
8
$62,026
APPLICATIONS DENIED
4
$117,228
37
$78,033
300
$110,354
36
$23,083
0
$0
14
$83,891
APPLICATIONS WITHDRAWN
7
$119,330
25
$118,387
275
$117,952
11
$38,725
0
$0
4
$98,315
FILES CLOSED FOR INCOMPLETENESS
1
$229,080
6
$81,563
32
$132,868
4
$57,308
0
$0
0
$0
Aggregated Statistics For Year 2002 (Based on 2 full and 6 partial tracts)
A) FHA, FSA/RHS & VA Home Purchase Loans
B) Conventional Home Purchase Loans
C) Refinancings
D) Home Improvement Loans
F) Non-occupant Loans on < 5 Family Dwellings (A B C & D)
Number
Average Value
Number
Average Value
Number
Average Value
Number
Average Value
Number
Average Value
LOANS ORIGINATED
95
$118,094
375
$104,534
724
$99,480
128
$22,804
57
$80,262
APPLICATIONS APPROVED, NOT ACCEPTED
4
$110,490
20
$57,683
131
$88,186
26
$25,441
7
$76,240
APPLICATIONS DENIED
3
$76,450
42
$58,381
253
$103,378
19
$47,196
7
$56,700
APPLICATIONS WITHDRAWN
2
$5,028,305
15
$90,093
195
$115,214
8
$30,846
2
$51,700
FILES CLOSED FOR INCOMPLETENESS
0
$0
5
$107,822
36
$114,444
3
$26,583
2
$96,570
Aggregated Statistics For Year 2001 (Based on 2 full and 6 partial tracts)
A) FHA, FSA/RHS & VA Home Purchase Loans
B) Conventional Home Purchase Loans
C) Refinancings
D) Home Improvement Loans
E) Loans on Dwellings For 5+ Families
F) Non-occupant Loans on < 5 Family Dwellings (A B C & D)
Number
Average Value
Number
Average Value
Number
Average Value
Number
Average Value
Number
Average Value
Number
Average Value
LOANS ORIGINATED
90
$111,471
366
$95,925
578
$96,524
165
$25,058
2
$556,960
28
$75,653
APPLICATIONS APPROVED, NOT ACCEPTED
1
$91,010
26
$75,173
90
$88,865
15
$26,715
0
$0
2
$80,880
APPLICATIONS DENIED
1
$126,490
50
$57,741
210
$84,018
38
$27,669
2
$196,400
4
$50,698
APPLICATIONS WITHDRAWN
7
$101,669
16
$85,835
188
$101,207
18
$18,417
0
$0
1
$87,440
FILES CLOSED FOR INCOMPLETENESS
1
$57,770
3
$70,727
18
$111,796
2
$16,855
0
$0
0
$0
Aggregated Statistics For Year 2000 (Based on 2 full and 6 partial tracts)
A) FHA, FSA/RHS & VA Home Purchase Loans
B) Conventional Home Purchase Loans
C) Refinancings
D) Home Improvement Loans
E) Loans on Dwellings For 5+ Families
F) Non-occupant Loans on < 5 Family Dwellings (A B C & D)
Number
Average Value
Number
Average Value
Number
Average Value
Number
Average Value
Number
Average Value
Number
Average Value
LOANS ORIGINATED
73
$105,224
301
$102,447
164
$80,900
187
$20,243
3
$135,377
30
$57,644
APPLICATIONS APPROVED, NOT ACCEPTED
3
$134,903
22
$83,825
65
$65,848
20
$29,138
0
$0
0
$0
APPLICATIONS DENIED
0
$0
44
$54,437
145
$84,293
37
$21,037
0
$0
4
$49,455
APPLICATIONS WITHDRAWN
3
$64,873
21
$94,933
80
$87,868
10
$26,170
0
$0
0
$0
FILES CLOSED FOR INCOMPLETENESS
0
$0
2
$167,920
24
$80,282
1
$24,900
0
$0
0
$0
Aggregated Statistics For Year 1999 (Based on 1 full and 3 partial tracts)
A) FHA, FSA/RHS & VA Home Purchase Loans
B) Conventional Home Purchase Loans
C) Refinancings
D) Home Improvement Loans
F) Non-occupant Loans on < 5 Family Dwellings (A B C & D)
2002 - 2018 National Fire Incident Reporting System (NFIRS) incidents
According to the data from the years 2002 - 2018 the average number of fire incidents per year is 66. The highest number of fires - 101 took place in 2009, and the least - 13 in 2002. The data has a rising trend.
When looking into fire subcategories, the most reports belonged to: Structure Fires (63.4%), and Outside Fires (19.2%).
Fire incident types reported to NFIRS in Zip Code 17517
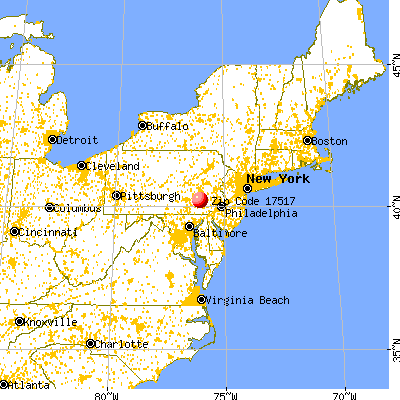


 Nearest zip codes: 17578, 17569, 19501, 17522, 19565, 17501.
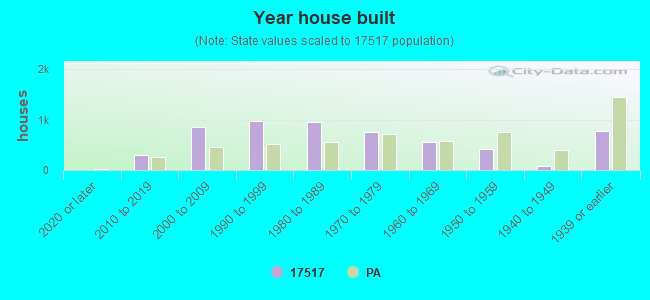


 According to the data from the years 2002 - 2018 the average number of fire incidents per year is 66. The highest number of fires - 101 took place in 2009, and the least - 13 in 2002. The data has a rising trend.
 When looking into fire subcategories, the most reports belonged to: Structure Fires (63.4%), and Outside Fires (19.2%).