Estimated zip code population in 2022: 17,470 Zip code population in 2010: 19,063 Zip code population in 2000: 18,429
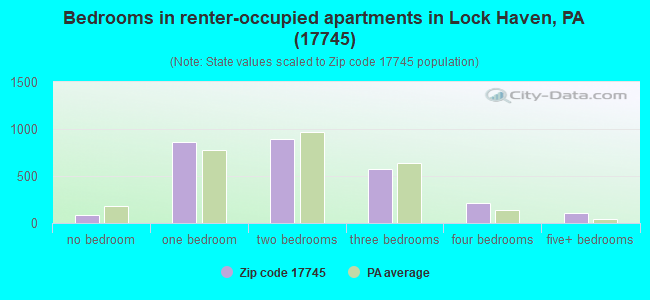
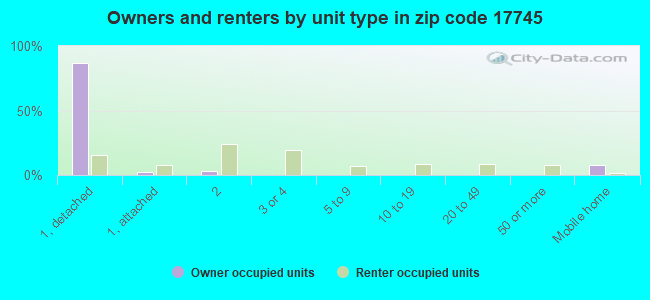
Houses and condos: 8,517 Renter-occupied apartments: 2,742
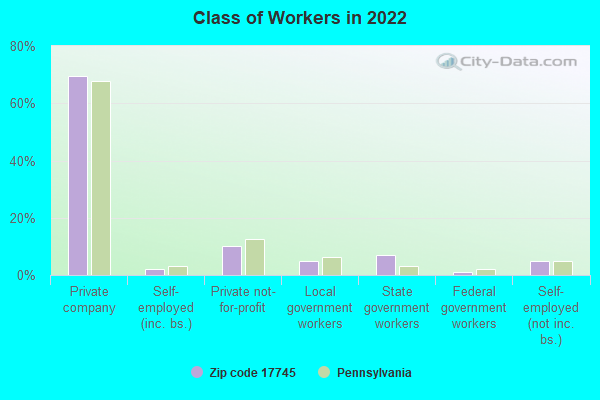
% of renters here:
38%
State:
31%
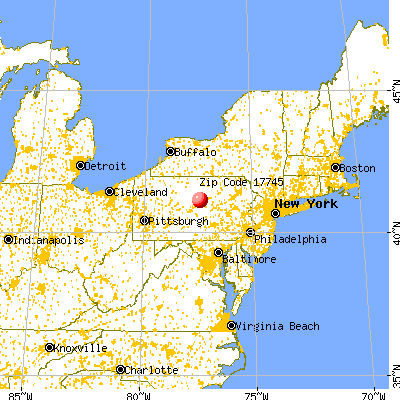
March 2022 cost of living index in zip code 17745: 86.4 (less than average, U.S. average is 100)
Land area: 215.9 sq. mi. Water area: 2.6 sq. mi.
Population density: 81 people per square mile
(very low).
OSM Map
General Map
Google Map
MSN Map
OSM Map
General Map
Google Map
MSN Map
OSM Map
General Map
Google Map
MSN Map
OSM Map
General Map
Google Map
MSN Map
Please wait while loading the map...
Real estate property taxes paid for housing units in 2022:
This zip code:
1.2% ($2,208)
Pennsylvania:
1.3% ($3,094)
Median real estate property taxes paid for housing units with mortgages in 2022: $2,221 (1.2%) Median real estate property taxes paid for housing units with no mortgage in 2022: $2,193 (1.3%)
Business Search- 14 Million verified businesses
Males: 8,537
(48.9%)
Females: 8,933
(51.1%)
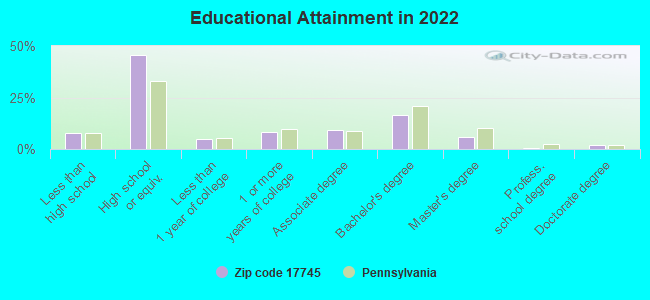
For population 25 years and over in 17745:
High school or higher: 91.6%
Bachelor's degree or higher: 24.5%
Graduate or professional degree: 8.3%
Unemployed: 4.3%
Mean travel time to work (commute): 22.4 minutes
For population 15 years and over in 17745:
Never married: 37.6%
Now married: 42.5%
Separated: 0.8%
Widowed: 8.5%
Divorced: 10.6%
Zip code 17745 compared to state average:
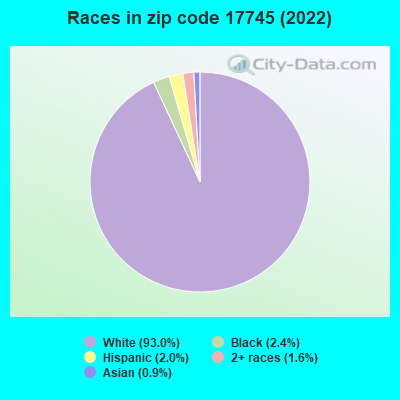
Black race population percentage significantly below state average.
Hispanic race population percentage significantly below state average.
Foreign-born population percentage significantly below state average.
Length of stay since moving in significantly above state average.
Percentage of population with a bachelor's degree or higher below state average.
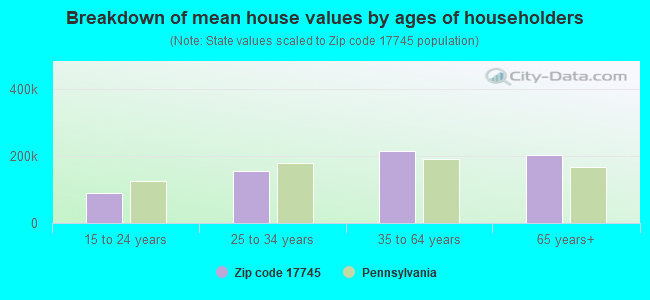
Estimated median house/condo value in 2022: $178,970
17745:
$178,970
Pennsylvania:
$245,500
According to our research of Pennsylvania and other state lists, there were 17 registered sex offenders living in 17745 zip code as of April 27, 2024. The ratio of all residents to sex offenders in zip code 17745 is 1,148 to 1. The ratio of registered sex offenders to all residents in this zip code is lower than the state average.
Median resident age:
This zip code:
37.9 years
Pennsylvania median age:
40.9 years
Average household size:
This zip code:
2.2 people
Pennsylvania:
2.4 people
Averages for the 2020 tax year for zip code 17745, filed in 2021:
Average Adjusted Gross Income (AGI) in 2020: $54,847 (Individual Income Tax Returns)
Here:
$54,847
State:
$75,707
Salary/wage: $44,487 (reported on 83.0% of returns)
Here:
$44,487
State:
$62,806
(% of AGI for various income ranges: 1093.1% for AGIs below $25k, 3303.3% for AGIs $25k-50k, 5828.7% for AGIs $50k-75k, 8568.6% for AGIs $75k-100k, 15068.4% for AGIs $100k-200k, 66143.3% for AGIs over 200k)
Taxable interest for individuals: $929 (reported on 23.9% of returns)
This zip code:
$929
Pennsylvania:
$1,633
(% of AGI for various income ranges: 10.7% for AGIs below $25k, 10.2% for AGIs $25k-50k, 23.7% for AGIs $50k-75k, 42.6% for AGIs $75k-100k, 90.5% for AGIs $100k-200k, 1190.0% for AGIs over 200k)
Ordinary dividends: $3,908 (reported on 15.5% of returns)
Here:
$3,908
State:
$7,382
(% of AGI for various income ranges: 19.5% for AGIs below $25k, 27.1% for AGIs $25k-50k, 45.3% for AGIs $50k-75k, 88.9% for AGIs $75k-100k, 280.2% for AGIs $100k-200k, 4406.7% for AGIs over 200k)
Net capital gain/loss in AGI: +$11,290 (reported on 11.4% of returns)
Here:
+$11,290
State:
+$23,522
(% of AGI for various income ranges: 6.6% for AGIs below $25k, 17.1% for AGIs $25k-50k, 80.3% for AGIs $50k-75k, 115.4% for AGIs $75k-100k, 342.7% for AGIs $100k-200k, 20773.3% for AGIs over 200k)
Profit/loss from business: +$9,129 (reported on 8.6% of returns)
Here:
+$9,129
State:
+$16,274
(% of AGI for various income ranges: 47.4% for AGIs below $25k, 53.8% for AGIs $25k-50k, 94.7% for AGIs $50k-75k, 137.7% for AGIs $75k-100k, 225.3% for AGIs $100k-200k, 4113.3% for AGIs over 200k)
Taxable individual retirement arrangement distribution: $13,300 (reported on 10.0% of returns)
17745:
$13,300
Pennsylvania:
$18,583
(% of AGI for various income ranges: 58.8% for AGIs below $25k, 88.6% for AGIs $25k-50k, 137.3% for AGIs $50k-75k, 239.3% for AGIs $75k-100k, 537.5% for AGIs $100k-200k, 6446.7% for AGIs over 200k)
Total itemized deductions: $39,771 (reported on 3.1% of returns)
Here:
$39,771
State:
$34,850
(% of AGI for various income ranges: 78.0% for AGIs $25k-50k, 89.5% for AGIs $50k-75k, 189.5% for AGIs $75k-100k, 429.3% for AGIs $100k-200k, 13190.0% for AGIs over 200k)
Charity contributions: $10,276 (reported on 2.2% of returns)
Here:
$10,276
State:
$12,392
(% of AGI for various income ranges: 12.4% for AGIs $50k-75k, 39.3% for AGIs $75k-100k, 138.5% for AGIs $100k-200k, 2160.0% for AGIs over 200k)
Taxes paid: $6,935 (reported on 3.0% of returns)
17745:
$6,935
State:
$8,200
(% of AGI for various income ranges: 9.6% for AGIs $25k-50k, 22.1% for AGIs $50k-75k, 45.8% for AGIs $75k-100k, 113.8% for AGIs $100k-200k, 1140.0% for AGIs over 200k)
Earned income credit: $2,029 (reported on 16.1% of returns)
Here:
$2,029
State:
$2,100
(% of AGI for various income ranges: 76.7% for AGIs below $25k, 53.9% for AGIs $25k-50k)
Percentage of individuals using paid preparers for their 2020 taxes: 94.7%
Here:
95%
State:
92%
(% for various income ranges: 92.9% for AGIs below $25k, 96.0% for AGIs $25k-50k, 96.5% for AGIs $50k-75k, 94.7% for AGIs $75k-100k, 95.3% for AGIs $100k-200k, 91.7% for AGIs over 200k)
Averages for the 2012 tax year for zip code 17745, filed in 2013:
Average Adjusted Gross Income (AGI) in 2012: $44,144 (Individual Income Tax Returns)
Here:
$44,144
State:
$61,346
Salary/wage: $38,005 (reported on 85.0% of returns)
Here:
$38,005
State:
$51,902
(% of AGI for various income ranges: 73.8% for AGIs below $25k, 82.1% for AGIs $25k-50k, 78.4% for AGIs $50k-75k, 77.0% for AGIs $75k-100k, 74.6% for AGIs $100k-200k, 36.9% for AGIs over 200k)
Taxable interest for individuals: $965 (reported on 29.4% of returns)
This zip code:
$965
Pennsylvania:
$1,588
(% of AGI for various income ranges: 1.0% for AGIs below $25k, 0.4% for AGIs $25k-50k, 0.4% for AGIs $50k-75k, 0.3% for AGIs $75k-100k, 1.1% for AGIs $100k-200k, 0.8% for AGIs over 200k)
Ordinary dividends: $3,915 (reported on 18.2% of returns)
Here:
$3,915
State:
$5,827
(% of AGI for various income ranges: 2.2% for AGIs below $25k, 0.9% for AGIs $25k-50k, 0.9% for AGIs $50k-75k, 0.9% for AGIs $75k-100k, 1.5% for AGIs $100k-200k, 5.0% for AGIs over 200k)
Net capital gain/loss in AGI: +$3,915 (reported on 10.3% of returns)
Here:
+$3,915
State:
+$14,495
(% of AGI for various income ranges: 0.2% for AGIs $25k-50k, 0.3% for AGIs $50k-75k, 0.7% for AGIs $75k-100k, 1.8% for AGIs $100k-200k, 3.1% for AGIs over 200k)
Profit/loss from business: +$11,876 (reported on 9.8% of returns)
Here:
+$11,876
State:
+$16,268
(% of AGI for various income ranges: 3.6% for AGIs below $25k, 2.3% for AGIs $25k-50k, 2.1% for AGIs $50k-75k, 1.2% for AGIs $75k-100k, 1.6% for AGIs $100k-200k, 7.8% for AGIs over 200k)
Taxable individual retirement arrangement distribution: $11,372 (reported on 10.3% of returns)
17745:
$11,372
Pennsylvania:
$14,550
(% of AGI for various income ranges: 3.3% for AGIs below $25k, 1.7% for AGIs $25k-50k, 2.5% for AGIs $50k-75k, 2.3% for AGIs $75k-100k, 5.0% for AGIs $100k-200k)
Total itemized deductions: $17,889 (19% of AGI, reported on 19.4% of returns)
Here:
$17,889
State:
$23,538
Here:
18.8% of AGI
State:
18.4% of AGI
(% of AGI for various income ranges: 4.1% for AGIs below $25k, 5.3% for AGIs $25k-50k, 7.0% for AGIs $50k-75k, 9.0% for AGIs $75k-100k, 11.6% for AGIs $100k-200k, 9.1% for AGIs over 200k)
Charity contributions: $3,550 (reported on 14.1% of returns)
Here:
$3,550
State:
$4,025
(% of AGI for various income ranges: 0.3% for AGIs below $25k, 0.5% for AGIs $25k-50k, 0.7% for AGIs $50k-75k, 1.3% for AGIs $75k-100k, 1.8% for AGIs $100k-200k, 2.3% for AGIs over 200k)
Taxes paid: $6,935 (reported on 19.3% of returns)
17745:
$6,935
State:
$9,982
(% of AGI for various income ranges: 0.8% for AGIs below $25k, 1.4% for AGIs $25k-50k, 2.4% for AGIs $50k-75k, 3.4% for AGIs $75k-100k, 5.1% for AGIs $100k-200k, 4.8% for AGIs over 200k)
Earned income credit: $1,925 (reported on 19.0% of returns)
Here:
$1,925
State:
$2,106
(% of AGI for various income ranges: 5.5% for AGIs below $25k, 1.0% for AGIs $25k-50k)
Percentage of individuals using paid preparers for their 2012 taxes: 47.3%
Here:
47%
State:
53%
(% for various income ranges: 39.8% for AGIs below $25k, 46.6% for AGIs $25k-50k, 55.8% for AGIs $50k-75k, 52.4% for AGIs $75k-100k, 64.8% for AGIs $100k-200k, 88.9% for AGIs over 200k)
Averages for the 2004 tax year for zip code 17745, filed in 2005:
Average Adjusted Gross Income (AGI) in 2004: $34,427 (Individual Income Tax Returns)
Here:
$34,427
State:
$48,049
Salary/wage: $30,969 (reported on 84.4% of returns)
Here:
$30,969
State:
$42,646
(% of AGI for various income ranges: 91.4% for AGIs below $10k, 75.2% for AGIs $10k-25k, 81.5% for AGIs $25k-50k, 81.7% for AGIs $50k-75k, 78.6% for AGIs $75k-100k, 59.7% for AGIs over 100k)
Taxable interest for individuals: $1,191 (reported on 44.5% of returns)
This zip code:
$1,191
Pennsylvania:
$1,657
(% of AGI for various income ranges: 4.2% for AGIs below $10k, 2.0% for AGIs $10k-25k, 1.1% for AGIs $25k-50k, 1.0% for AGIs $50k-75k, 0.9% for AGIs $75k-100k, 2.4% for AGIs over 100k)
Taxable dividends: $3,066 (reported on 23.5% of returns)
Here:
$3,066
State:
$3,566
(% of AGI for various income ranges: 4.5% for AGIs below $10k, 1.4% for AGIs $10k-25k, 1.0% for AGIs $25k-50k, 0.9% for AGIs $50k-75k, 1.3% for AGIs $75k-100k, 5.3% for AGIs over 100k)
Net capital gain/loss: +$4,665 (reported on 15.5% of returns)
Here:
+$4,665
State:
+$9,716
(% of AGI for various income ranges: -1.9% for AGIs below $10k, 0.7% for AGIs $10k-25k, 0.7% for AGIs $25k-50k, 0.8% for AGIs $50k-75k, 0.9% for AGIs $75k-100k, 7.5% for AGIs over 100k)
Profit/loss from business: +$8,191 (reported on 11.3% of returns)
Here:
+$8,191
State:
+$14,267
(% of AGI for various income ranges: 0.7% for AGIs below $10k, 2.8% for AGIs $10k-25k, 2.5% for AGIs $25k-50k, 2.1% for AGIs $50k-75k, 1.9% for AGIs $75k-100k, 4.3% for AGIs over 100k)
IRA payment deduction: $2,526 (reported on 2.6% of returns)
17745:
$2,526
Pennsylvania:
$2,903
(% of AGI for various income ranges: 0.2% for AGIs $10k-25k, 0.2% for AGIs $25k-50k, 0.2% for AGIs $50k-75k, 0.2% for AGIs $75k-100k, 0.2% for AGIs over 100k)
Self-employed pension: $14,789 (reported on 0.3% of returns)
Here:
$14,789
Pennsylvania:
$14,674
Total itemized deductions: $15,047 (21% of AGI, reported on 20.3% of returns)
Here:
$15,047
State:
$18,804
Here:
20.9% of AGI
State:
19.5% of AGI
(% of AGI for various income ranges: 7.0% for AGIs below $10k, 4.1% for AGIs $10k-25k, 7.1% for AGIs $25k-50k, 8.8% for AGIs $50k-75k, 12.6% for AGIs $75k-100k, 12.3% for AGIs over 100k)
Charity contributions deductions: $3,050 (4% of AGI, reported on 16.4% of returns)
Here:
$3,050
State:
$3,337
Here:
3.8% of AGI
State:
3.3% of AGI
(% of AGI for various income ranges: 0.2% for AGIs below $10k, 0.3% for AGIs $10k-25k, 0.8% for AGIs $25k-50k, 1.2% for AGIs $50k-75k, 2.1% for AGIs $75k-100k, 3.1% for AGIs over 100k)
Total tax: $4,548 (reported on 70.1% of returns)
17745:
$4,548
State:
$8,008
(% of AGI for various income ranges: 2.2% for AGIs below $10k, 3.9% for AGIs $10k-25k, 6.7% for AGIs $25k-50k, 8.8% for AGIs $50k-75k, 10.5% for AGIs $75k-100k, 16.8% for AGIs over 100k)
Earned income credit: $1,590 (reported on 16.7% of returns)
Here:
$1,590
State:
$1,643
Percentage of individuals using paid preparers for their 2004 taxes: 54.6%
Here:
55%
State:
56%
(% for various income ranges: 47.1% for AGIs below $10k, 54.0% for AGIs $10k-25k, 56.5% for AGIs $25k-50k, 57.2% for AGIs $50k-75k, 59.9% for AGIs $75k-100k, 71.8% for AGIs over 100k)
Likely homosexual households (counted as self-reported same-sex unmarried-partner households)
Lesbian couples: 0.7% of all households
Gay men: 0.1% of all households
Household received Food Stamps/SNAP in the past 12 months: 1,391 Household did not receive Food Stamps/SNAP in the past 12 months: 5,859
Women who had a birth in the past 12 months: 303 (141 now married, 146 unmarried) Women who did not have a birth in the past 12 months: 3,990 (1,147 now married, 2,858 unmarried)
Housing units in zip code 17745 with a mortgage: 2,571 (241 second mortgage, 2 home equity loan, 223 both second mortgage and home equity loan) Houses without a mortgage: 302
Median monthly owner costs for units with a mortgage: $1,192 Median monthly owner costs for units without a mortgage: $554
Residents with income below the poverty level in 2022:
This zip code:
15.4%
Whole state:
11.8%
Residents with income below 50% of the poverty level in 2022:
This zip code:
8.8%
Whole state:
6.1%
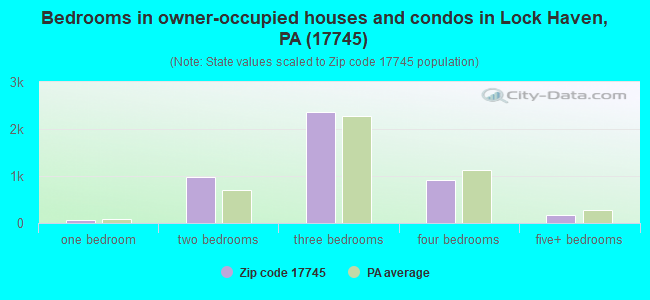
Median number of rooms in houses and condos:
Here:
6.6
State:
6.8
Median number of rooms in apartments:
Here:
4.4
State:
4.3
Notable locations in this zip code not listed on our city pages
1,304 married couples with children.
943 single-parent households (291 men, 652 women).
96.9% of residents of 17745 zip code speak English at home.
0.9% of residents speak Spanish at home (85% very well, 9% well, 5% not well).
1.0% of residents speak other Indo-European language at home (84% very well, 14% well, 1% not well).
0.6% of residents speak Asian or Pacific Island language at home (52% very well, 35% well, 13% not well).
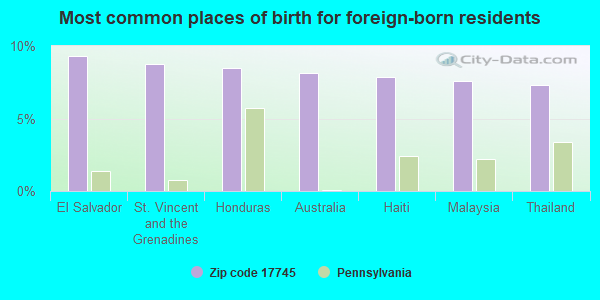
Foreign born population: 343 (2.0%) (56.9% of them are naturalized citizens)
This zip code:
2.0%
Whole state:
7.5%
9%El Salvador
9%St. Vincent and the Grenadines
8%Honduras
8%Australia
8%Haiti
8%Malaysia
7%Thailand
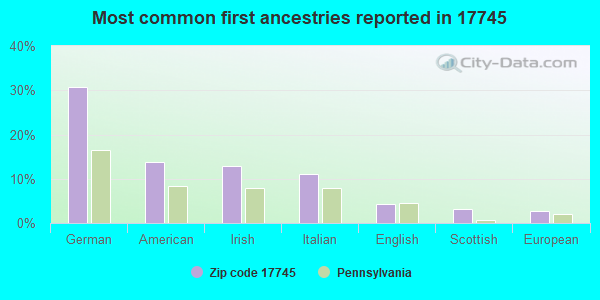
31%German
14%American
13%Irish
11%Italian
4%English
3%Scottish
3%European
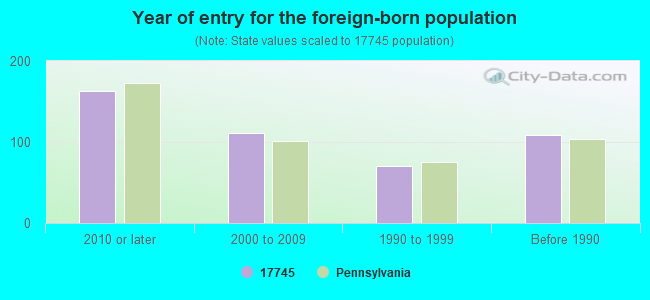
Year of entry for the foreign-born population
1632010 or later
1112000 to 2009
701990 to 1999
109Before 1990
Facilities with environmental interests located in this zip code:
ALEXANDER BODY SHOP (910 MAPLE AVE in LOCK HAVEN, PA)
STATE MASTER (Pennsylvania database) - RCRIS-PAR000014100, HAZARDOUS WASTE PROGRAM (Resource Conservation and Recovery Act (tracking hazardous waste)) Business NAICS classification: AUTOMOTIVE BODY, PAINT, AND INTERIOR REPAIR AND MAINTENANCE.
BAKER THOMAS JR (664 FREDERICK ST in LOCK CLINTON, PA)
AMERICAN COLOR & CHEMICAL (MT VERNAN STREET in LOCK HAVEN, PA)
National Pollutant Discharge Elimination System NON-MAJOR (Tracking pollutant discharge elimination systems) - permit Alternative names: AMER COLOR & CHEM LLC
AIR PARTS OF LOCK HAVEN (PIPER MEM ARPRT HANGAR 3 in LOCK HAVEN, PA)
Conditionally Exempt Small Quantity Generators, less than 100 kg/month of hazardous waste (Resource Conservation and Recovery Act (tracking hazardous waste)) - notification Organizations: LARSEN ROBERT (CONTACT/OWNER)
Housing units lacking complete plumbing facilities: 2.3% Housing units lacking complete kitchen facilities: 1.9%
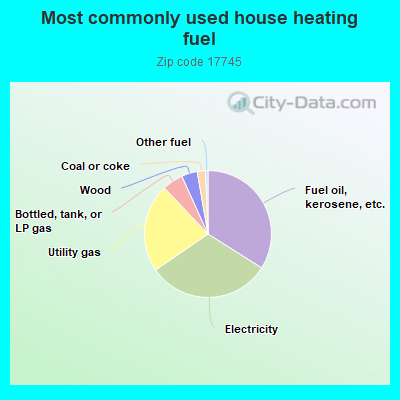
33.8%Fuel oil, kerosene, etc.
31.3%Electricity
22.4%Utility gas
5.3%Bottled, tank, or LP gas
4.0%Wood
2.1%Coal or coke
0.6%Other fuel
Population in 1990: 16,448. Population change in the 1990s: +1,981 (+12.0%).
Place of birth for U.S.-born residents:
This state: 14,723
Northeast: 823
Midwest: 478
South: 724
West: 167
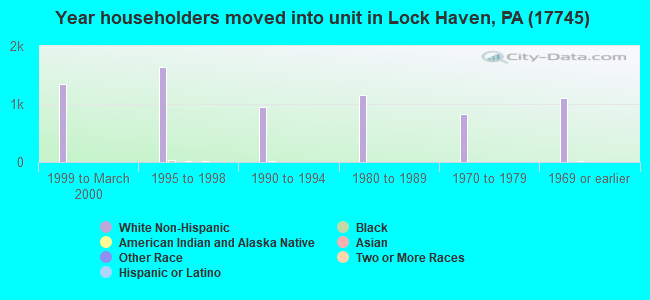
57% of the 17745 zip code residents lived in the same house 5 years ago. Out of people who lived in different houses, 50% lived in this county. Out of people who lived in different counties, 50% lived in Pennsylvania.
94% of the 17745 zip code residents lived in the same house 1 year ago. Out of people who lived in different houses, 55% moved from this county. Out of people who lived in different houses, 29% moved from different county within same state. Out of people who lived in different houses, 17% moved from different state. Out of people who lived in different houses, 1% moved from abroad.
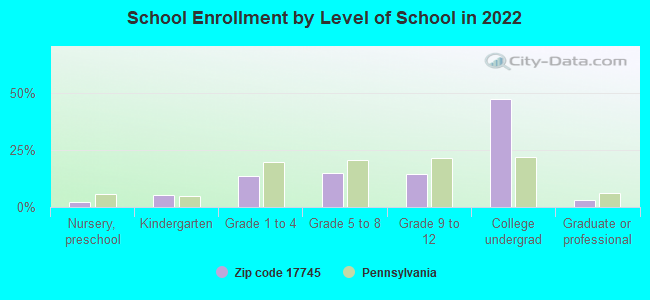
Private vs. public school enrollment:
Students in private schools in grades 1 to 8 (elementary and middle school): 180
Here:
16.1%
Pennsylvania:
15.7%
Students in private schools in grades 9 to 12 (high school): 117
Here:
20.3%
Pennsylvania:
13.4%
Students in private undergraduate colleges: 123
Here:
6.6%
Pennsylvania:
39.8%
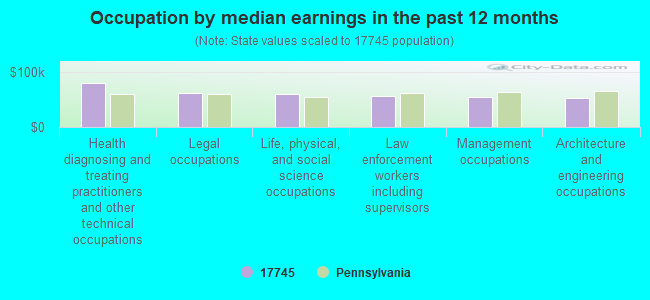
Occupation by median earnings in the past 12 months ($)
79,754Health diagnosing and treating practitioners and other technical occupations
62,047Legal occupations
60,371Life, physical, and social science occupations
56,655Law enforcement workers including supervisors
53,918Management occupations
52,786Architecture and engineering occupations
Companies with federal contracts located in this zip code:
USA MODELS, INC (TEN NORTH WASHINGTON STREE in LOCK HAVEN, PA; small business) : $4,067,761 in 27 contractsfrom 2000 to 2004
Contracts for Training Aids, Operation Training Devices, Arts/Graphics Services, Training/Curriculum Development by U.S. Army Corps of Engineers - civil program financing only, Navy, Office of Operations (disused code), Army, and others Signed by year:2000: $339,909; 2001: $957,212; 2002: $441,000; 2003: $2,108,062; 2004: $221,578; 2005: $0; 2006: $0.
Biggest contracts:
$1,311,000 with U.S. Army Corps of Engineers - civil program financing only for Training Aids. Taking place in MO. Signed on 2003-04-09. Completion date: 2003-06-02.
$500,000, same as above.Signed on 2001-11-09. Completion date: 2002-09-30.
$300,212, same as above.Signed on 2001-12-06. Completion date: 2002-09-30.
$274,500, same as above.Signed on 2003-05-30. Completion date: 2003-07-15.
LEROY W PETERS DISPOSAL SERVIC (REAR 384 E WALNUT STREET in LOCK HAVEN, PA; small business) : $5,304 in 6 contractsfrom 2002 to 2005
Contracts for Trash/Garbage Collection Services - Including Portable Sanitation Services by Army Signed by year:2000: $0; 2001: $0; 2002: $1,326; 2003: $1,326; 2004: $1,326; 2005: $1,326; 2006: $0.
Biggest contracts:
$1,326 with Army for Trash/Garbage Collection Services - Including Portable Sanitation Services. Signed on 2005-10-24. Completion date: 2005-09-30.
$1,326, same as above.Signed on 2004-10-01. Completion date: 2005-09-30.
$1,326, same as above.Signed on 2003-10-01. Completion date: 2004-09-30.
$1,326, same as above.Signed on 2002-10-01. Completion date: 2003-09-30.
Top industries in this zip code by the number of employees in 2005:
Health Care and Social Assistance: General Medical and Surgical Hospitals (250-499 employees: 1 establishment)
Other Services (except Public Administration): Religious Organizations (20-49: 1, 10-19: 1, 5-9: 7, 1-4: 10)
Other Services (except Public Administration): Civic and Social Organizations (50-99: 1, 10-19: 2, 5-9: 1, 1-4: 1)
People in group quarters in 2010:
2,004 people in college/university student housing
326 people in local jails and other municipal confinement facilities
200 people in nursing facilities/skilled-nursing facilities
11 people in group homes intended for adults
People in group quarters in 2000:
1,556 people in college dormitories (includes college quarters off campus)
213 people in nursing homes
155 people in local jails and other confinement facilities (including police lockups)
118 people in wards in general hospitals for patients who have no usual home elsewhere
25 people in homes for the mentally retarded
3 people in other noninstitutional group quarters
2003 - 2018 National Fire Incident Reporting System (NFIRS) incidents
Based on the data from the years 2003 - 2018 the average number of fire incidents per year is 104. The highest number of fires - 169 took place in 2010, and the least - 49 in 2005. The data has a rising trend.
When looking into fire subcategories, the most incidents belonged to: Structure Fires (73.6%), and Outside Fires (15.2%).
Fire incident types reported to NFIRS in Zip Code 17745


 Nearest zip codes: 17739, 17779, 17723, 17751, 17748, 17721.


 Based on the data from the years 2003 - 2018 the average number of fire incidents per year is 104. The highest number of fires - 169 took place in 2010, and the least - 49 in 2005. The data has a rising trend.
 When looking into fire subcategories, the most incidents belonged to: Structure Fires (73.6%), and Outside Fires (15.2%).