Estimated zip code population in 2022: 1,264 Zip code population in 2010: 1,162 Zip code population in 2000: 1,006
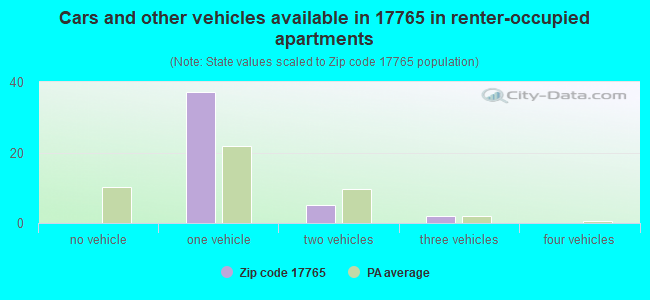
Houses and condos: 669 Renter-occupied apartments: 43
% of renters here:
10%
State:
31%
March 2022 cost of living index in zip code 17765: 92.2 (less than average, U.S. average is 100)
Land area: 82.6 sq. mi. Water area: 0.4 sq. mi.
Population density: 15 people per square mile
(very low).
OSM Map
General Map
Google Map
MSN Map
OSM Map
General Map
Google Map
MSN Map
OSM Map
General Map
Google Map
MSN Map
OSM Map
General Map
Google Map
MSN Map
Please wait while loading the map...
Real estate property taxes paid for housing units in 2022:
This zip code:
0.7% ($1,547)
Pennsylvania:
1.3% ($3,094)
Median real estate property taxes paid for housing units with mortgages in 2022: $1,639 (0.7%) Median real estate property taxes paid for housing units with no mortgage in 2022: $1,367 (0.7%)
Business Search- 14 Million verified businesses
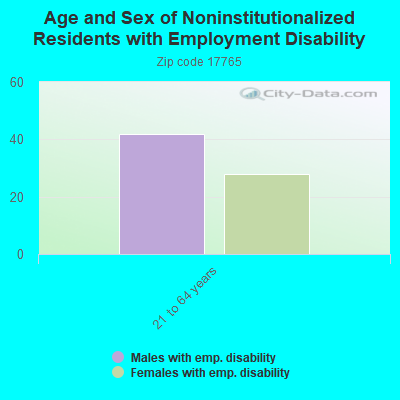
Males: 677
(53.6%)
Females: 586
(46.4%)
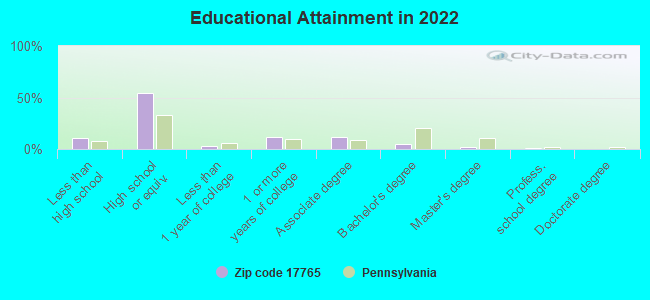
For population 25 years and over in 17765:
High school or higher: 87.7%
Bachelor's degree or higher: 8.2%
Graduate or professional degree: 3.0%
Unemployed: 2.9%
Mean travel time to work (commute): 30.2 minutes
For population 15 years and over in 17765:
Never married: 24.6%
Now married: 58.8%
Separated: 2.9%
Widowed: 6.0%
Divorced: 7.7%
Zip code 17765 compared to state average:
Black race population percentage significantly below state average.
Hispanic race population percentage significantly below state average.
Foreign-born population percentage significantly below state average.
Renting percentage significantly below state average.
Length of stay since moving in significantly above state average.
Number of college students below state average.
Percentage of population with a bachelor's degree or higher significantly below state average.
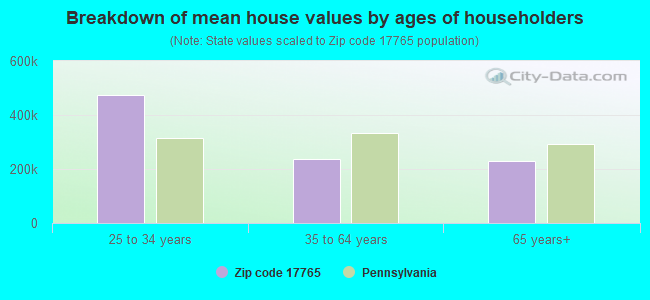
Estimated median house/condo value in 2022: $221,189
17765:
$221,189
Pennsylvania:
$245,500
According to our research of Pennsylvania and other state lists, there was 1 registered sex offender living in 17765 zip code as of May 04, 2024. The ratio of all residents to sex offenders in zip code 17765 is 1,213 to 1. The ratio of registered sex offenders to all residents in this zip code is lower than the state average.
Median resident age:
This zip code:
43.2 years
Pennsylvania median age:
40.9 years
Average household size:
This zip code:
2.8 people
Pennsylvania:
2.4 people
Averages for the 2020 tax year for zip code 17765, filed in 2021:
Average Adjusted Gross Income (AGI) in 2020: $59,715 (Individual Income Tax Returns)
Here:
$59,715
State:
$75,707
Salary/wage: $49,914 (reported on 77.8% of returns)
Here:
$49,914
State:
$62,806
(% of AGI for various income ranges: 1188.2% for AGIs below $25k, 3437.3% for AGIs $25k-50k, 5757.1% for AGIs $50k-75k, 7842.0% for AGIs $75k-100k, 15850.0% for AGIs $100k-200k)
Taxable interest for individuals: $447 (reported on 35.2% of returns)
This zip code:
$447
Pennsylvania:
$1,633
(% of AGI for various income ranges: 14.5% for AGIs below $25k, 7.3% for AGIs $25k-50k, 21.4% for AGIs $50k-75k, 18.0% for AGIs $75k-100k, 74.0% for AGIs $100k-200k)
Ordinary dividends: $1,200 (reported on 16.7% of returns)
Here:
$1,200
State:
$7,382
(% of AGI for various income ranges: 25.5% for AGIs below $25k, 30.0% for AGIs $50k-75k, 118.0% for AGIs $100k-200k)
Net capital gain/loss in AGI: +$3,057 (reported on 13.0% of returns)
Here:
+$3,057
State:
+$23,522
(% of AGI for various income ranges: 25.5% for AGIs below $25k, 81.4% for AGIs $50k-75k, 258.0% for AGIs $100k-200k)
Profit/loss from business: +$12,633 (reported on 11.1% of returns)
Here:
+$12,633
State:
+$16,274
(% of AGI for various income ranges: 180.0% for AGIs $25k-50k, 1120.0% for AGIs $75k-100k)
Taxable individual retirement arrangement distribution: $5,633 (reported on 11.1% of returns)
17765:
$5,633
Pennsylvania:
$18,583
(% of AGI for various income ranges: 108.2% for AGIs below $25k, 199.1% for AGIs $25k-50k)
Earned income credit: $2,300 (reported on 11.1% of returns)
Here:
$2,300
State:
$2,100
(% of AGI for various income ranges: 66.4% for AGIs below $25k, 59.1% for AGIs $25k-50k)
Percentage of individuals using paid preparers for their 2020 taxes: 94.4%
Here:
94%
State:
92%
(% for various income ranges: 100.0% for AGIs below $25k, 92.9% for AGIs $25k-50k, 88.9% for AGIs $50k-75k, 100.0% for AGIs $75k-100k, 88.9% for AGIs $100k-200k)
Averages for the 2012 tax year for zip code 17765, filed in 2013:
Average Adjusted Gross Income (AGI) in 2012: $53,420 (Individual Income Tax Returns)
Here:
$53,420
State:
$61,346
Salary/wage: $38,429 (reported on 83.3% of returns)
Here:
$38,429
State:
$51,902
(% of AGI for various income ranges: 71.4% for AGIs below $25k, 75.1% for AGIs $25k-50k, 72.1% for AGIs $50k-75k, 78.5% for AGIs $75k-100k, 31.1% for AGIs $100k-200k)
Taxable interest for individuals: $390 (reported on 38.9% of returns)
This zip code:
$390
Pennsylvania:
$1,588
(% of AGI for various income ranges: 1.4% for AGIs below $25k, 0.3% for AGIs $25k-50k, 0.3% for AGIs $50k-75k)
Ordinary dividends: $1,633 (reported on 16.7% of returns)
Here:
$1,633
State:
$5,827
(% of AGI for various income ranges: 2.3% for AGIs below $25k, 0.2% for AGIs $50k-75k, 0.8% for AGIs $100k-200k)
Net capital gain/loss in AGI: +$17,057 (reported on 13.0% of returns)
Here:
+$17,057
State:
+$14,495
Profit/loss from business: +$5,814 (reported on 13.0% of returns)
Here:
+$5,814
State:
+$16,268
Taxable individual retirement arrangement distribution: $7,320 (reported on 9.3% of returns)
17765:
$7,320
Pennsylvania:
$14,550
Total itemized deductions: $17,300 (16% of AGI, reported on 16.7% of returns)
Here:
$17,300
State:
$23,538
Here:
16.4% of AGI
State:
18.4% of AGI
(% of AGI for various income ranges: 14.3% for AGIs below $25k, 8.4% for AGIs $50k-75k, 6.6% for AGIs $100k-200k)
Charity contributions: $3,640 (reported on 9.3% of returns)
Here:
$3,640
State:
$4,025
Taxes paid: $6,730 (reported on 18.5% of returns)
17765:
$6,730
State:
$9,982
(% of AGI for various income ranges: 3.1% for AGIs below $25k, 2.9% for AGIs $50k-75k, 4.1% for AGIs $100k-200k)
Earned income credit: $2,175 (reported on 14.8% of returns)
Here:
$2,175
State:
$2,106
(% of AGI for various income ranges: 4.9% for AGIs below $25k, 1.0% for AGIs $25k-50k)
Percentage of individuals using paid preparers for their 2012 taxes: 74.1%
Here:
74%
State:
53%
(% for various income ranges: 66.7% for AGIs below $25k, 73.3% for AGIs $25k-50k, 81.8% for AGIs $50k-75k, 80.0% for AGIs $75k-100k, 80.0% for AGIs $100k-200k)
Averages for the 2004 tax year for zip code 17765, filed in 2005:
Average Adjusted Gross Income (AGI) in 2004: $32,527 (Individual Income Tax Returns)
Here:
$32,527
State:
$48,049
Salary/wage: $29,738 (reported on 85.7% of returns)
Here:
$29,738
State:
$42,646
(% of AGI for various income ranges: 78.1% for AGIs below $10k, 74.3% for AGIs $10k-25k, 85.8% for AGIs $25k-50k, 78.2% for AGIs $50k-75k, 90.8% for AGIs $75k-100k, 43.0% for AGIs over 100k)
Taxable interest for individuals: $766 (reported on 45.9% of returns)
This zip code:
$766
Pennsylvania:
$1,657
(% of AGI for various income ranges: 4.6% for AGIs below $10k, 2.1% for AGIs $10k-25k, 1.2% for AGIs $25k-50k, 0.4% for AGIs $50k-75k, 0.1% for AGIs $75k-100k, 1.2% for AGIs over 100k)
Taxable dividends: $682 (reported on 21.9% of returns)
Here:
$682
State:
$3,566
(% of AGI for various income ranges: 6.0% for AGIs below $10k, 0.1% for AGIs $10k-25k, 0.3% for AGIs $25k-50k, 0.4% for AGIs $50k-75k, 0.5% for AGIs $75k-100k)
Net capital gain/loss: +$4,885 (reported on 17.3% of returns)
Here:
+$4,885
State:
+$9,716
(% of AGI for various income ranges: 4.8% for AGIs below $10k, 2.3% for AGIs $10k-25k, 1.1% for AGIs $25k-50k, 6.1% for AGIs $50k-75k)
Profit/loss from business: +$5,346 (reported on 16.1% of returns)
Here:
+$5,346
State:
+$14,267
(% of AGI for various income ranges: 11.1% for AGIs below $10k, 7.2% for AGIs $10k-25k, 3.2% for AGIs $25k-50k, 0.8% for AGIs $50k-75k)
IRA payment deduction: $2,158 (reported on 3.8% of returns)
17765:
$2,158
Pennsylvania:
$2,903
Total itemized deductions: $12,750 (21% of AGI, reported on 15.9% of returns)
Here:
$12,750
State:
$18,804
Here:
21.3% of AGI
State:
19.5% of AGI
Charity contributions deductions: $1,898 (3% of AGI, reported on 11.7% of returns)
Here:
$1,898
State:
$3,337
Here:
2.9% of AGI
State:
3.3% of AGI
Total tax: $3,327 (reported on 75.9% of returns)
17765:
$3,327
State:
$8,008
(% of AGI for various income ranges: 3.5% for AGIs below $10k, 4.5% for AGIs $10k-25k, 6.5% for AGIs $25k-50k, 8.7% for AGIs $50k-75k, 7.8% for AGIs $75k-100k, 15.3% for AGIs over 100k)
Earned income credit: $1,279 (reported on 13.5% of returns)
Here:
$1,279
State:
$1,643
Percentage of individuals using paid preparers for their 2004 taxes: 75.0%
Here:
75%
State:
56%
(% for various income ranges: 70.5% for AGIs below $10k, 74.2% for AGIs $10k-25k, 74.7% for AGIs $25k-50k, 80.8% for AGIs $50k-75k, 73.7% for AGIs $75k-100k, 91.7% for AGIs over 100k)
Household received Food Stamps/SNAP in the past 12 months: 45 Household did not receive Food Stamps/SNAP in the past 12 months: 402
Women who had a birth in the past 12 months: 14 (5 now married, 7 unmarried) Women who did not have a birth in the past 12 months: 278 (159 now married, 116 unmarried)
Housing units in zip code 17765 with a mortgage: 221 (26 second mortgage, 23 both second mortgage and home equity loan) Houses without a mortgage: 8
Median monthly owner costs for units with a mortgage: $1,237 Median monthly owner costs for units without a mortgage: $434
Residents with income below the poverty level in 2022:
This zip code:
22.2%
Whole state:
11.8%
Residents with income below 50% of the poverty level in 2022:
This zip code:
13.2%
Whole state:
6.1%
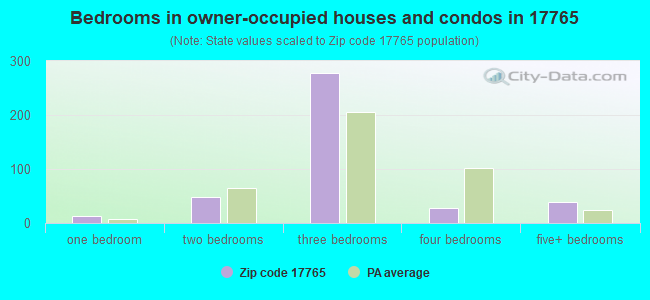
Median number of rooms in houses and condos:
Here:
6.3
State:
6.8
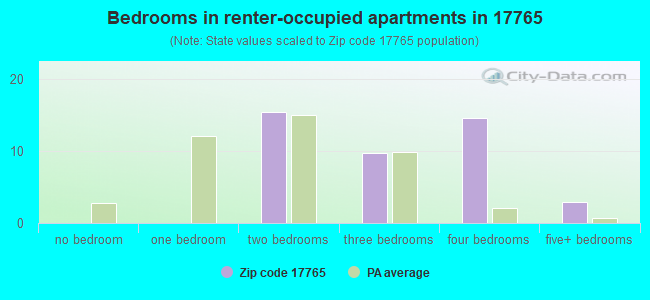
Median number of rooms in apartments:
Here:
5.2
State:
4.3
Notable locations in this zip code not listed on our city pages
Streams, rivers, and creeks: North Branch Rock Run (A), Sugar Works Run (B), Mill Creek (C), French Lick Run (D), Little Elk Run (E), Cascade Run (F), Salt Spring Run (G), Roaring Branch (H), Brion Creek (I). Display/hide their locations on the map
Size of family households: 157 2-persons, 86 3-persons, 61 4-persons, 25 5-persons, 9 6-persons, 10 7-or-more-persons
Size of nonfamily households: 81 1-person, 14 2-persons
164 married couples with children.
41 single-parent households (1 men, 40 women).
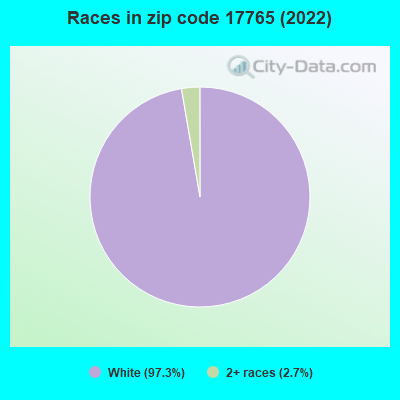
99.3% of residents of 17765 zip code speak English at home.
Foreign born population: 0 (0.0%)
:
0.0%
Whole state:
7.5%
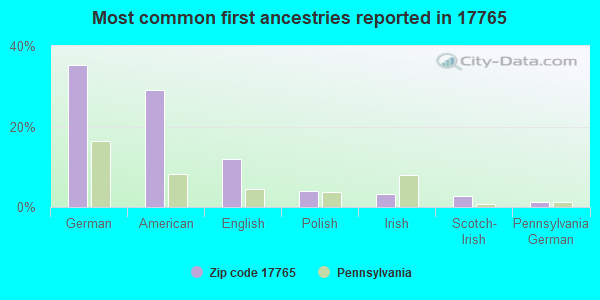
35%German
29%American
12%English
4%Polish
3%Irish
3%Scotch-Irish
1%Pennsylvania German
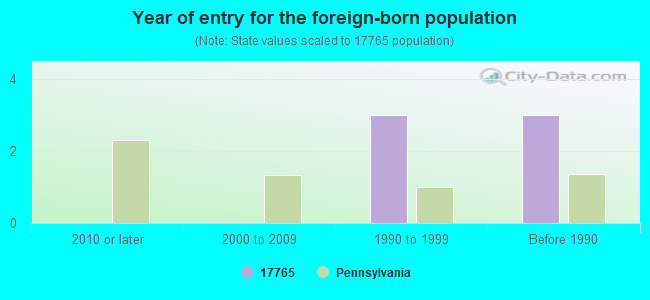
Year of entry for the foreign-born population
02010 or later
02000 to 2009
31990 to 1999
3Before 1990
Facilities with environmental interests located in this zip code:
BISHCROFT FARM (RR 1 in ROARING BRANCH, PA)
STATE MASTER (Pennsylvania database) - PCS-PA0228770, National Pollutant Discharge Elimination System Permit National Pollutant Discharge Elimination System NON-MAJOR (Tracking pollutant discharge elimination systems) - permit Business SIC classification: DAIRY FARMS Alternative names: BISHCROFT FARM LP
Housing units lacking complete plumbing facilities: 8.0% Housing units lacking complete kitchen facilities: 5.9%
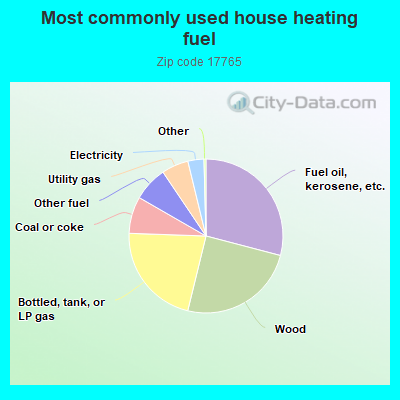
29.3%Fuel oil, kerosene, etc.
24.9%Wood
21.9%Bottled, tank, or LP gas
7.8%Coal or coke
7.3%Other fuel
5.7%Utility gas
3.4%Electricity
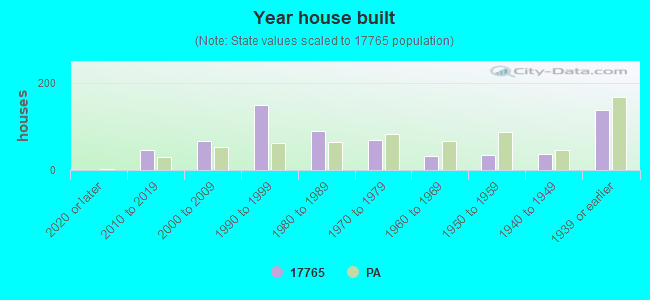
Population in 1990: 448. Population change in the 1990s: +558 (+124.6%).
Place of birth for U.S.-born residents:
This state: 1,101
Northeast: 105
Midwest: 8
South: 20
West: 11
67% of the 17765 zip code residents lived in the same house 5 years ago. Out of people who lived in different houses, 30% lived in this county. Out of people who lived in different counties, 50% lived in Pennsylvania.
100% of the 17765 zip code residents lived in the same house 1 year ago.
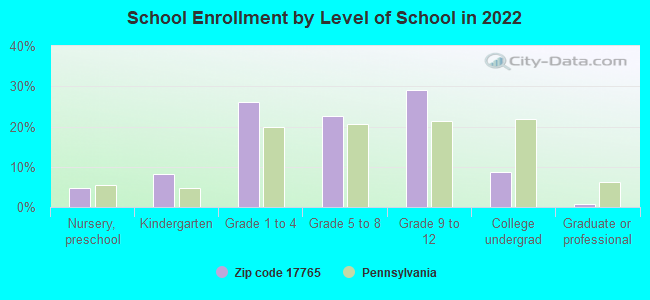
Private vs. public school enrollment:
Students in private schools in grades 1 to 8 (elementary and middle school): 6
Here:
4.3%
Pennsylvania:
15.7%
Students in private schools in grades 9 to 12 (high school): 8
Here:
9.7%
Pennsylvania:
13.4%
Students in private undergraduate colleges:
Here:
0.0%
Pennsylvania:
39.8%
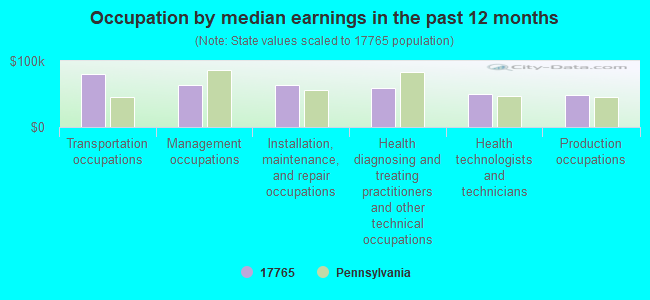
Occupation by median earnings in the past 12 months ($)
80,185Transportation occupations
63,337Management occupations
63,029Installation, maintenance, and repair occupations
59,733Health diagnosing and treating practitioners and other technical occupations
49,997Health technologists and technicians
48,866Production occupations
Top industries in this zip code by the number of employees in 2005:
Health Care and Social Assistance: Services for the Elderly and Persons with Disabilities (5-9 employees: 1 establishment, 1-4 employees: 1 establishment)
Other Services (except Public Administration): Civic and Social Organizations (5-9: 1)
Construction: New Single-Family Housing Construction (except Operative Builders) (1-4: 2)
Construction: Plumbing, Heating, and Air-Conditioning Contractors (1-4: 1)
Construction: Poured Concrete Foundation and Structure Contractors (1-4: 1)
Construction: All Other Specialty Trade Contractors (1-4: 1)
Other Services (except Public Administration): Religious Organizations (1-4: 1)
Administrative and Support and Waste Management and Remediation Services: All Other Support Services (1-4: 1)
Fatal accident statistics in 2013:
Fatal accident count: 2
Vehicles involved in fatal accidents: 3
Fatal accidents caused by drunken drivers: 0
Fatalities: 2
Persons involved in fatal accidents: 4
Pedestrians involved in fatal accidents: 0
Fatal accident statistics in 2011:
Fatal accident count: 1
Vehicles involved in fatal accidents: 1
Fatal accidents caused by drunken drivers: 0
Fatalities: 1
Persons involved in fatal accidents: 2
Pedestrians involved in fatal accidents: 0
Most common first names in zip code 17765 among deceased individuals
Name
Count
Lived (average)
John
12
69.3 years
Robert
10
71.5 years
Charles
9
75.2 years
Mary
9
76.7 years
James
9
72.9 years
William
8
72.5 years
Frank
7
82.3 years
Harold
6
68.3 years
George
5
76.2 years
Mildred
4
72.2 years
Most common last names in zip code 17765 among deceased individuals

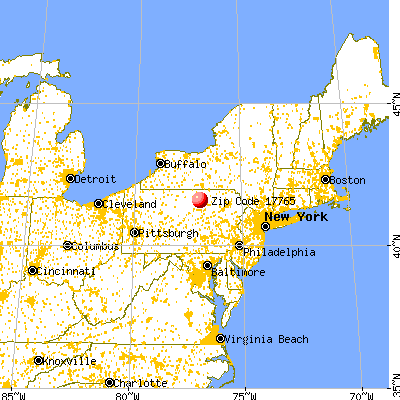


 Nearest zip codes: 17763, 16939, 16912, 17771, 16930, 16917.