Estimated zip code population in 2022: 7,697 Zip code population in 2010: 7,505 Zip code population in 2000: 7,436
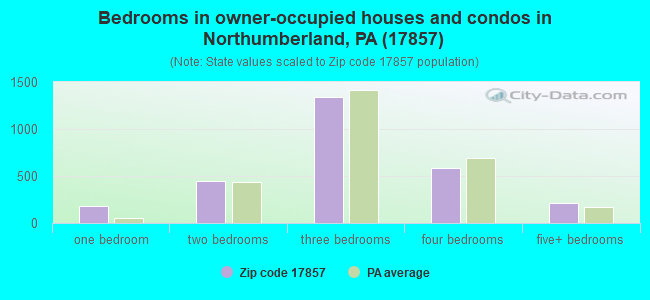
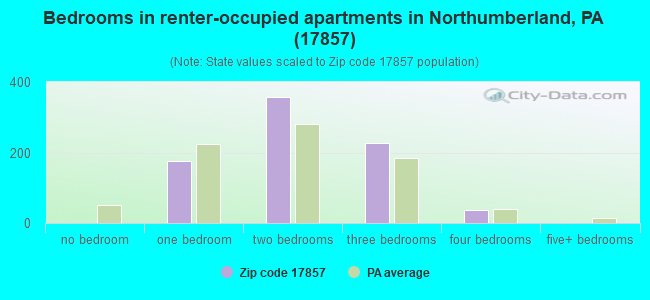
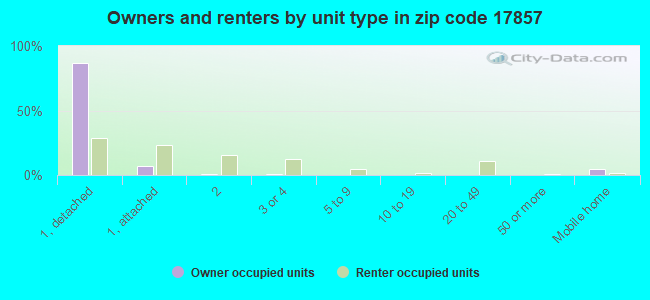
Houses and condos: 3,841 Renter-occupied apartments: 803
% of renters here:
23%
State:
31%
March 2022 cost of living index in zip code 17857: 85.6 (less than average, U.S. average is 100)
Land area: 26.8 sq. mi. Water area: 2.3 sq. mi.
Population density: 287 people per square mile
(very low).
OSM Map
General Map
Google Map
MSN Map
OSM Map
General Map
Google Map
MSN Map
OSM Map
General Map
Google Map
MSN Map
OSM Map
General Map
Google Map
MSN Map
Please wait while loading the map...
Real estate property taxes paid for housing units in 2022:
This zip code:
1.4% ($2,678)
Pennsylvania:
1.3% ($3,094)
Median real estate property taxes paid for housing units with mortgages in 2022: $2,927 (1.4%) Median real estate property taxes paid for housing units with no mortgage in 2022: $2,364 (1.6%)
Estimated median house/condo value in 2022: $185,807
17857:
$185,807
Pennsylvania:
$245,500
According to our research of Pennsylvania and other state lists, there were 15 registered sex offenders living in 17857 zip code as of April 27, 2024. The ratio of all residents to sex offenders in zip code 17857 is 505 to 1. The ratio of registered sex offenders to all residents in this zip code is near the state average.
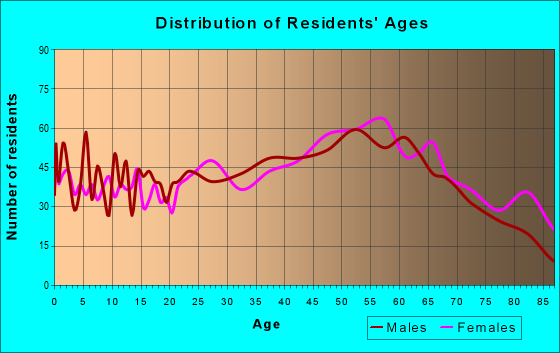
Median resident age:
This zip code:
51.7 years
Pennsylvania median age:
40.9 years
Average household size:
This zip code:
2.1 people
Pennsylvania:
2.4 people
Averages for the 2020 tax year for zip code 17857, filed in 2021:
Average Adjusted Gross Income (AGI) in 2020: $57,140 (Individual Income Tax Returns)
Here:
$57,140
State:
$75,707
Salary/wage: $48,177 (reported on 78.9% of returns)
Here:
$48,177
State:
$62,806
(% of AGI for various income ranges: 1093.1% for AGIs below $25k, 3353.8% for AGIs $25k-50k, 5967.3% for AGIs $50k-75k, 8245.6% for AGIs $75k-100k, 15432.8% for AGIs $100k-200k, 45476.7% for AGIs over 200k)
Taxable interest for individuals: $1,363 (reported on 33.7% of returns)
This zip code:
$1,363
Pennsylvania:
$1,633
(% of AGI for various income ranges: 23.8% for AGIs below $25k, 24.1% for AGIs $25k-50k, 40.4% for AGIs $50k-75k, 52.8% for AGIs $75k-100k, 228.6% for AGIs $100k-200k, 1340.0% for AGIs over 200k)
Ordinary dividends: $4,222 (reported on 20.6% of returns)
Here:
$4,222
State:
$7,382
(% of AGI for various income ranges: 42.4% for AGIs below $25k, 26.7% for AGIs $25k-50k, 104.5% for AGIs $50k-75k, 137.5% for AGIs $75k-100k, 279.7% for AGIs $100k-200k, 3776.7% for AGIs over 200k)
Net capital gain/loss in AGI: +$12,846 (reported on 13.6% of returns)
Here:
+$12,846
State:
+$23,522
(% of AGI for various income ranges: 4.6% for AGIs below $25k, 20.4% for AGIs $25k-50k, 59.8% for AGIs $50k-75k, 106.2% for AGIs $75k-100k, 708.3% for AGIs $100k-200k, 13466.7% for AGIs over 200k)
Profit/loss from business: +$14,602 (reported on 10.8% of returns)
Here:
+$14,602
State:
+$16,274
(% of AGI for various income ranges: 79.5% for AGIs below $25k, 107.3% for AGIs $25k-50k, 135.9% for AGIs $50k-75k, 63.7% for AGIs $75k-100k, 272.4% for AGIs $100k-200k, 10236.7% for AGIs over 200k)
Taxable individual retirement arrangement distribution: $14,880 (reported on 13.8% of returns)
17857:
$14,880
Pennsylvania:
$18,583
(% of AGI for various income ranges: 117.3% for AGIs below $25k, 133.2% for AGIs $25k-50k, 261.2% for AGIs $50k-75k, 418.8% for AGIs $75k-100k, 1204.8% for AGIs $100k-200k)
Total itemized deductions: $30,540 (reported on 3.8% of returns)
Here:
$30,540
State:
$34,850
(% of AGI for various income ranges: 105.0% for AGIs below $25k, 145.5% for AGIs $50k-75k, 190.9% for AGIs $75k-100k, 446.2% for AGIs $100k-200k, 3743.3% for AGIs over 200k)
Charity contributions: $14,364 (reported on 2.8% of returns)
Here:
$14,364
State:
$12,392
(% of AGI for various income ranges: 75.9% for AGIs $50k-75k, 189.0% for AGIs $100k-200k, 2200.0% for AGIs over 200k)
Taxes paid: $6,780 (reported on 3.8% of returns)
17857:
$6,780
State:
$8,200
(% of AGI for various income ranges: 10.9% for AGIs below $25k, 35.7% for AGIs $50k-75k, 39.1% for AGIs $75k-100k, 123.8% for AGIs $100k-200k, 903.3% for AGIs over 200k)
Earned income credit: $2,041 (reported on 12.3% of returns)
Here:
$2,041
State:
$2,100
(% of AGI for various income ranges: 70.1% for AGIs below $25k, 51.6% for AGIs $25k-50k)
Percentage of individuals using paid preparers for their 2020 taxes: 92.2%
Here:
92%
State:
92%
(% for various income ranges: 90.3% for AGIs below $25k, 94.3% for AGIs $25k-50k, 92.5% for AGIs $50k-75k, 90.7% for AGIs $75k-100k, 93.9% for AGIs $100k-200k, 88.9% for AGIs over 200k)
Averages for the 2012 tax year for zip code 17857, filed in 2013:
Average Adjusted Gross Income (AGI) in 2012: $46,340 (Individual Income Tax Returns)
Here:
$46,340
State:
$61,346
Salary/wage: $41,308 (reported on 81.6% of returns)
Here:
$41,308
State:
$51,902
(% of AGI for various income ranges: 69.1% for AGIs below $25k, 75.7% for AGIs $25k-50k, 76.6% for AGIs $50k-75k, 77.9% for AGIs $75k-100k, 74.2% for AGIs $100k-200k, 45.1% for AGIs over 200k)
Taxable interest for individuals: $1,183 (reported on 39.3% of returns)
This zip code:
$1,183
Pennsylvania:
$1,588
(% of AGI for various income ranges: 2.1% for AGIs below $25k, 1.0% for AGIs $25k-50k, 0.7% for AGIs $50k-75k, 0.8% for AGIs $75k-100k, 0.9% for AGIs $100k-200k, 1.2% for AGIs over 200k)
Ordinary dividends: $2,993 (reported on 23.6% of returns)
Here:
$2,993
State:
$5,827
(% of AGI for various income ranges: 2.3% for AGIs below $25k, 1.0% for AGIs $25k-50k, 1.1% for AGIs $50k-75k, 0.8% for AGIs $75k-100k, 1.8% for AGIs $100k-200k, 3.6% for AGIs over 200k)
Net capital gain/loss in AGI: +$6,787 (reported on 13.2% of returns)
Here:
+$6,787
State:
+$14,495
(% of AGI for various income ranges: 0.1% for AGIs below $25k, 0.6% for AGIs $25k-50k, 0.7% for AGIs $50k-75k, 1.3% for AGIs $75k-100k, 1.5% for AGIs $100k-200k, 13.0% for AGIs over 200k)
Profit/loss from business: +$12,545 (reported on 10.9% of returns)
Here:
+$12,545
State:
+$16,268
(% of AGI for various income ranges: 3.3% for AGIs below $25k, 1.6% for AGIs $25k-50k, 1.3% for AGIs $50k-75k, 2.3% for AGIs $75k-100k, 7.1% for AGIs $100k-200k)
Taxable individual retirement arrangement distribution: $11,181 (reported on 13.2% of returns)
17857:
$11,181
Pennsylvania:
$14,550
(% of AGI for various income ranges: 4.8% for AGIs below $25k, 3.5% for AGIs $25k-50k, 2.5% for AGIs $50k-75k, 2.6% for AGIs $75k-100k, 4.4% for AGIs $100k-200k)
Total itemized deductions: $17,554 (20% of AGI, reported on 23.1% of returns)
Here:
$17,554
State:
$23,538
Here:
20.0% of AGI
State:
18.4% of AGI
(% of AGI for various income ranges: 4.1% for AGIs below $25k, 6.7% for AGIs $25k-50k, 8.0% for AGIs $50k-75k, 9.3% for AGIs $75k-100k, 11.9% for AGIs $100k-200k, 11.6% for AGIs over 200k)
Charity contributions: $4,388 (reported on 16.4% of returns)
Here:
$4,388
State:
$4,025
(% of AGI for various income ranges: 0.5% for AGIs below $25k, 0.8% for AGIs $25k-50k, 1.1% for AGIs $50k-75k, 1.5% for AGIs $75k-100k, 2.3% for AGIs $100k-200k, 4.1% for AGIs over 200k)
Taxes paid: $6,599 (reported on 22.9% of returns)
17857:
$6,599
State:
$9,982
(% of AGI for various income ranges: 0.8% for AGIs below $25k, 1.9% for AGIs $25k-50k, 2.7% for AGIs $50k-75k, 3.7% for AGIs $75k-100k, 4.9% for AGIs $100k-200k, 5.5% for AGIs over 200k)
Earned income credit: $1,849 (reported on 13.7% of returns)
Here:
$1,849
State:
$2,106
(% of AGI for various income ranges: 4.1% for AGIs below $25k, 0.7% for AGIs $25k-50k)
Percentage of individuals using paid preparers for their 2012 taxes: 53.2%
Here:
53%
State:
53%
(% for various income ranges: 47.1% for AGIs below $25k, 52.4% for AGIs $25k-50k, 58.2% for AGIs $50k-75k, 61.1% for AGIs $75k-100k, 61.8% for AGIs $100k-200k, 80.0% for AGIs over 200k)
Averages for the 2004 tax year for zip code 17857, filed in 2005:
Average Adjusted Gross Income (AGI) in 2004: $39,408 (Individual Income Tax Returns)
Here:
$39,408
State:
$48,049
Salary/wage: $35,899 (reported on 83.3% of returns)
Here:
$35,899
State:
$42,646
(% of AGI for various income ranges: 93.6% for AGIs below $10k, 67.7% for AGIs $10k-25k, 78.8% for AGIs $25k-50k, 82.0% for AGIs $50k-75k, 83.0% for AGIs $75k-100k, 61.8% for AGIs over 100k)
Taxable interest for individuals: $1,484 (reported on 54.4% of returns)
This zip code:
$1,484
Pennsylvania:
$1,657
(% of AGI for various income ranges: 7.4% for AGIs below $10k, 2.9% for AGIs $10k-25k, 1.9% for AGIs $25k-50k, 1.1% for AGIs $50k-75k, 1.9% for AGIs $75k-100k, 2.7% for AGIs over 100k)
Taxable dividends: $2,819 (reported on 28.5% of returns)
Here:
$2,819
State:
$3,566
(% of AGI for various income ranges: 5.2% for AGIs below $10k, 2.1% for AGIs $10k-25k, 1.3% for AGIs $25k-50k, 0.8% for AGIs $50k-75k, 1.2% for AGIs $75k-100k, 4.8% for AGIs over 100k)
Net capital gain/loss: +$4,200 (reported on 16.5% of returns)
Here:
+$4,200
State:
+$9,716
(% of AGI for various income ranges: -1.5% for AGIs below $10k, 0.4% for AGIs $10k-25k, 1.0% for AGIs $25k-50k, 0.6% for AGIs $50k-75k, 1.5% for AGIs $75k-100k, 5.3% for AGIs over 100k)
Profit/loss from business: +$11,442 (reported on 11.8% of returns)
Here:
+$11,442
State:
+$14,267
(% of AGI for various income ranges: 0.5% for AGIs below $10k, 5.1% for AGIs $10k-25k, 1.6% for AGIs $25k-50k, 4.6% for AGIs $50k-75k, 1.5% for AGIs $75k-100k, 5.1% for AGIs over 100k)
IRA payment deduction: $2,672 (reported on 3.4% of returns)
17857:
$2,672
Pennsylvania:
$2,903
(% of AGI for various income ranges: 0.2% for AGIs $10k-25k, 0.4% for AGIs $25k-50k, 0.3% for AGIs $50k-75k, 0.1% for AGIs over 100k)
Self-employed pension: $8,667 (reported on 0.4% of returns)
Here:
$8,667
Pennsylvania:
$14,674
Total itemized deductions: $14,901 (20% of AGI, reported on 23.9% of returns)
Here:
$14,901
State:
$18,804
Here:
19.7% of AGI
State:
19.5% of AGI
(% of AGI for various income ranges: 7.7% for AGIs below $10k, 5.8% for AGIs $10k-25k, 6.5% for AGIs $25k-50k, 9.5% for AGIs $50k-75k, 12.3% for AGIs $75k-100k, 10.8% for AGIs over 100k)
Charity contributions deductions: $3,258 (4% of AGI, reported on 19.7% of returns)
Here:
$3,258
State:
$3,337
Here:
4.1% of AGI
State:
3.3% of AGI
(% of AGI for various income ranges: 0.7% for AGIs $10k-25k, 0.7% for AGIs $25k-50k, 1.6% for AGIs $50k-75k, 2.0% for AGIs $75k-100k, 3.1% for AGIs over 100k)
Total tax: $5,126 (reported on 77.3% of returns)
17857:
$5,126
State:
$8,008
(% of AGI for various income ranges: 2.2% for AGIs below $10k, 4.4% for AGIs $10k-25k, 6.9% for AGIs $25k-50k, 9.3% for AGIs $50k-75k, 10.6% for AGIs $75k-100k, 17.9% for AGIs over 100k)
Earned income credit: $1,488 (reported on 10.4% of returns)
Here:
$1,488
State:
$1,643
Percentage of individuals using paid preparers for their 2004 taxes: 54.6%
Here:
55%
State:
56%
(% for various income ranges: 46.5% for AGIs below $10k, 55.8% for AGIs $10k-25k, 54.0% for AGIs $25k-50k, 57.0% for AGIs $50k-75k, 60.2% for AGIs $75k-100k, 68.1% for AGIs over 100k)
Likely homosexual households (counted as self-reported same-sex unmarried-partner households)
Lesbian couples: 0.1% of all households
Gay men: 0.4% of all households
Household received Food Stamps/SNAP in the past 12 months: 354 Household did not receive Food Stamps/SNAP in the past 12 months: 3,201
Women who had a birth in the past 12 months: 16 (17 now married, 0 unmarried) Women who did not have a birth in the past 12 months: 1,315 (733 now married, 573 unmarried)
Housing units in zip code 17857 with a mortgage: 1,431 (158 second mortgage, 150 both second mortgage and home equity loan) Houses without a mortgage: 130
Median monthly owner costs for units with a mortgage: $1,451 Median monthly owner costs for units without a mortgage: $591
Residents with income below the poverty level in 2022:
This zip code:
8.7%
Whole state:
11.8%
Residents with income below 50% of the poverty level in 2022:
This zip code:
5.7%
Whole state:
6.1%
Median number of rooms in houses and condos:
Here:
6.7
State:
6.8
Median number of rooms in apartments:
Here:
4.9
State:
4.3
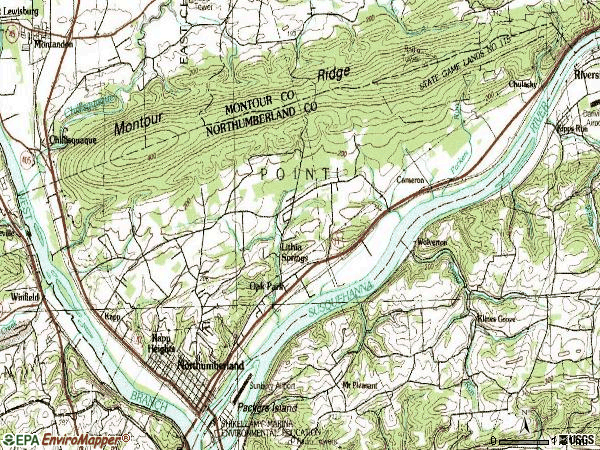
Notable locations in this zip code not listed on our city pages
Notable locations in zip code 17857: Priestly House State Historic Site (A), Devils Feather Bed (B), Tuckahoe Fire Company Station 7 - 4 - 1 (C), Northumberland Hook and Ladder Company Station 7 - 3 - 2 (D), Point Township Office (E), Joseph Priestley House (F), Point Township Fire Company Station 7 - 4 - 2 (G), Northumberland Fire Company 1 Station 7 - 3 - 1 (H). Display/hide their locations on the map
Streams, rivers, and creeks: West Branch Susquehanna River (A), Johnson Creek (B), Turtle Creek (C), Gaskins Run (D), Lithia Springs Creek (E), Winfield Creek (F), Raups Run (G), Packers Run (H). Display/hide their locations on the map
In group quarters: 212 (-1 institutionalized population)
Size of family households: 1,391 2-persons, 395 3-persons, 257 4-persons, 85 5-persons, 59 6-persons, 29 7-or-more-persons
Size of nonfamily households: 1,098 1-person, 229 2-persons, 35 3-persons
715 married couples with children.
425 single-parent households (82 men, 343 women).
97.6% of residents of 17857 zip code speak English at home.
0.8% of residents speak Spanish at home (86% very well, 14% not well).
1.6% of residents speak other Indo-European language at home (73% very well, 27% well).
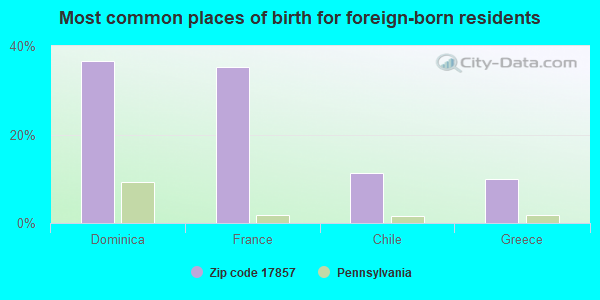
Foreign born population: 71 (0.9%) (59.0% of them are naturalized citizens)
This zip code:
0.9%
Whole state:
7.5%
37%Dominica
35%France
11%Chile
10%Greece
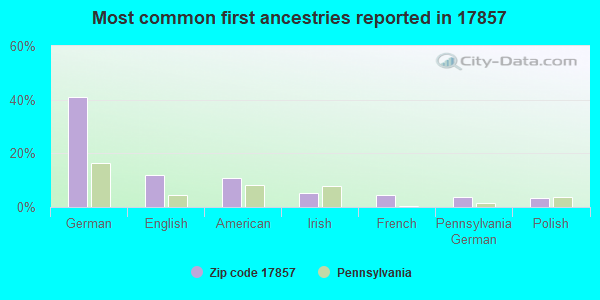
41%German
12%English
11%American
5%Irish
4%French
4%Pennsylvania German
4%Polish
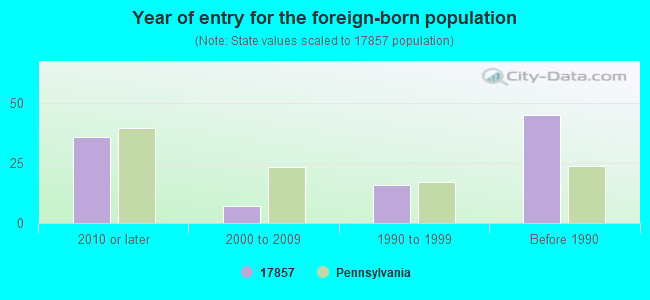
Year of entry for the foreign-born population
362010 or later
72000 to 2009
161990 to 1999
45Before 1990
Facilities with environmental interests located in this zip code:
ANTHONY AND JENNY CONMY (331 ORANGE STREET in NORTHUMBERLAND, PA)
National Pollutant Discharge Elimination System NON-MAJOR (Tracking pollutant discharge elimination systems) - permit Business SIC classification: OPERATORS OF DWELLINGS OTHER THAN APARTMENT BUILDINGS Alternative names: CONMY, ANTHONY & JENNY
BILL RISHEL AUTO BODY (RD 1 BOX 334A NORTHUMBERLAND in NORTHUMBERLAND, PA)
Conditionally Exempt Small Quantity Generators, less than 100 kg/month of hazardous waste (Resource Conservation and Recovery Act (tracking hazardous waste)) - notification
Housing units lacking complete plumbing facilities: 1.3% Housing units lacking complete kitchen facilities: 2.0%
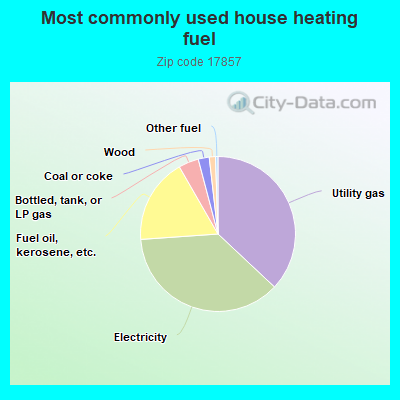
37.0%Utility gas
36.9%Electricity
17.8%Fuel oil, kerosene, etc.
4.2%Bottled, tank, or LP gas
2.3%Coal or coke
1.3%Wood
0.5%Other fuel
Population in 1990: 7,326. Population change in the 1990s: +110 (+1.5%).
Place of birth for U.S.-born residents:
This state: 6,736
Northeast: 259
Midwest: 153
South: 265
West: 125
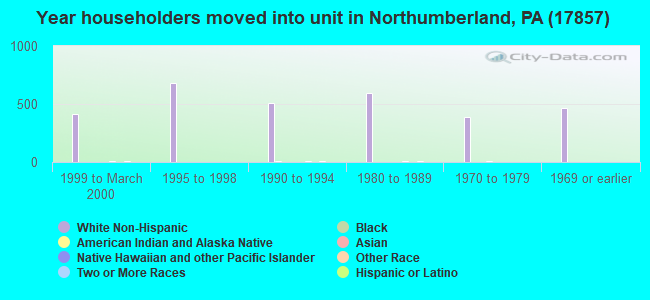
68% of the 17857 zip code residents lived in the same house 5 years ago. Out of people who lived in different houses, 69% lived in this county. Out of people who lived in different counties, 50% lived in Pennsylvania.
95% of the 17857 zip code residents lived in the same house 1 year ago. Out of people who lived in different houses, 62% moved from this county. Out of people who lived in different houses, 36% moved from different county within same state. Out of people who lived in different houses, 4% moved from different state.
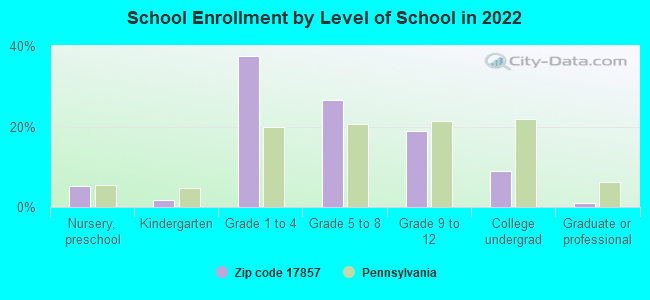
Private vs. public school enrollment:
Students in private schools in grades 1 to 8 (elementary and middle school): 99
Here:
11.2%
Pennsylvania:
15.7%
Students in private schools in grades 9 to 12 (high school): 22
Here:
8.5%
Pennsylvania:
13.4%
Students in private undergraduate colleges: 21
Here:
16.6%
Pennsylvania:
39.8%
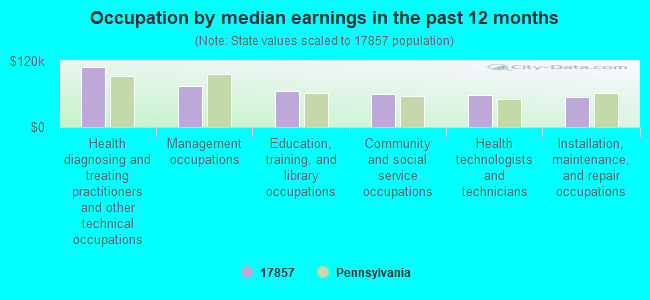
Occupation by median earnings in the past 12 months ($)
108,747Health diagnosing and treating practitioners and other technical occupations
75,302Management occupations
64,828Education, training, and library occupations
59,686Community and social service occupations
58,454Health technologists and technicians
54,255Installation, maintenance, and repair occupations
Top industries in this zip code by the number of employees in 2005:
143 people in nursing facilities/skilled-nursing facilities
36 people in group homes intended for adults
People in group quarters in 2000:
167 people in nursing homes
47 people in other noninstitutional group quarters
12 people in homes for the mentally retarded
4 people in other nonhousehold living situations
Fatal accident statistics in 2014:
Fatal accident count: 1
Vehicles involved in fatal accidents: 1
Fatal accidents caused by drunken drivers: 0
Fatalities: 1
Persons involved in fatal accidents: 1
Pedestrians involved in fatal accidents: 0
Fatal accident statistics in 2013:
Fatal accident count: 2
Vehicles involved in fatal accidents: 5
Fatal accidents caused by drunken drivers: 0
Fatalities: 4
Persons involved in fatal accidents: 6
Pedestrians involved in fatal accidents: 0
2003 - 2018 National Fire Incident Reporting System (NFIRS) incidents
Based on the data from the years 2003 - 2018 the average number of fire incidents per year is 10. The highest number of fire incidents - 35 took place in 2016, and the least - 2 in 2003. The data has a growing trend.
When looking into fire subcategories, the most incidents belonged to: Structure Fires (57.2%), and Outside Fires (28.9%).
Fire incident types reported to NFIRS in Zip Code 17857
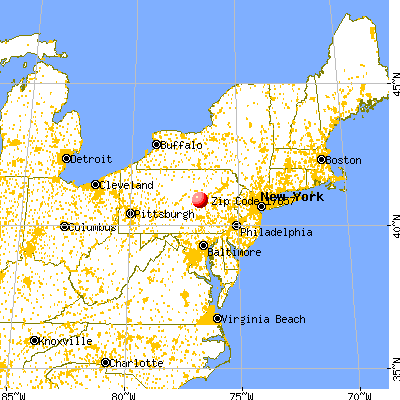


 Nearest zip codes: 17865, 17847, 17850, 17876, 17801, 17886.
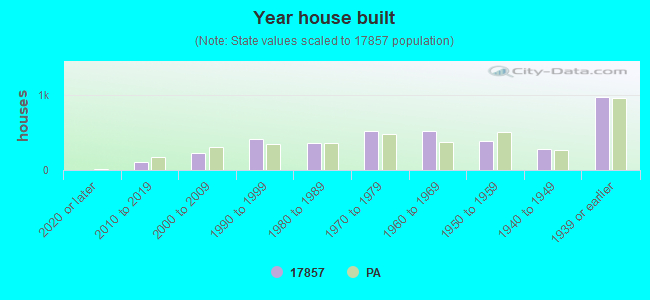


 Based on the data from the years 2003 - 2018 the average number of fire incidents per year is 10. The highest number of fire incidents - 35 took place in 2016, and the least - 2 in 2003. The data has a growing trend.
 When looking into fire subcategories, the most incidents belonged to: Structure Fires (57.2%), and Outside Fires (28.9%).