Estimated zip code population in 2022: 2,993 Zip code population in 2010: 2,735 Zip code population in 2000: 2,700
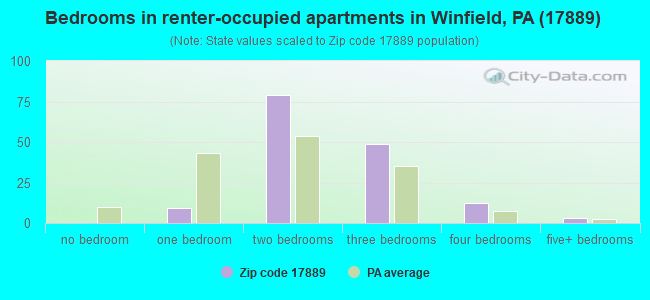
Houses and condos: 1,137 Renter-occupied apartments: 155
% of renters here:
15%
State:
31%
March 2022 cost of living index in zip code 17889: 93.2 (less than average, U.S. average is 100)
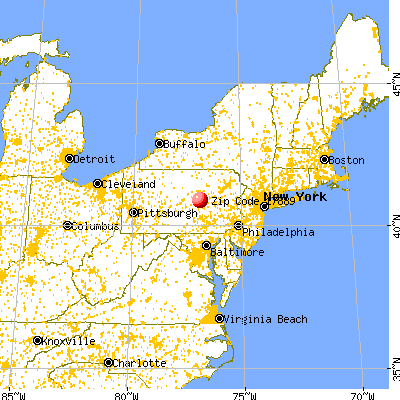
Land area: 22.7 sq. mi. Water area: 0.2 sq. mi.
Population density: 132 people per square mile
(very low).
OSM Map
General Map
Google Map
MSN Map
OSM Map
General Map
Google Map
MSN Map
OSM Map
General Map
Google Map
MSN Map
OSM Map
General Map
Google Map
MSN Map
Please wait while loading the map...
Real estate property taxes paid for housing units in 2022:
This zip code:
1.1% ($3,177)
Pennsylvania:
1.3% ($3,094)
Median real estate property taxes paid for housing units with mortgages in 2022: $3,546 (1.0%) Median real estate property taxes paid for housing units with no mortgage in 2022: $2,688 (1.0%)
Business Search- 14 Million verified businesses
Males: 1,465
(49.0%)
Females: 1,527
(51.0%)
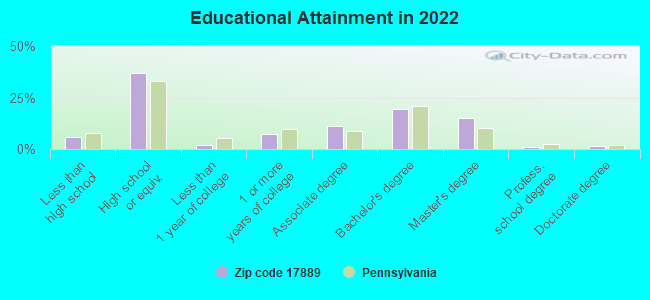
For population 25 years and over in 17889:
High school or higher: 93.5%
Bachelor's degree or higher: 36.9%
Graduate or professional degree: 17.5%
Unemployed: 3.9%
Mean travel time to work (commute): 21.7 minutes
For population 15 years and over in 17889:
Never married: 27.7%
Now married: 59.3%
Separated: 0.9%
Widowed: 6.7%
Divorced: 5.4%
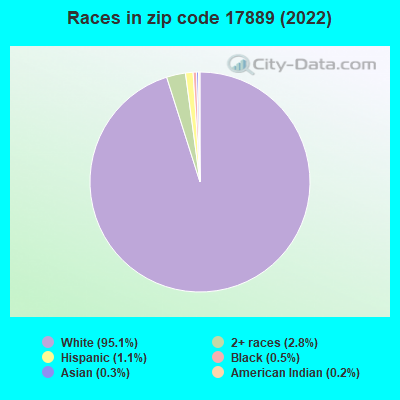
Zip code 17889 compared to state average:
Black race population percentage significantly below state average.
Hispanic race population percentage significantly below state average.
Foreign-born population percentage significantly below state average.
Renting percentage below state average.
Length of stay since moving in significantly above state average.
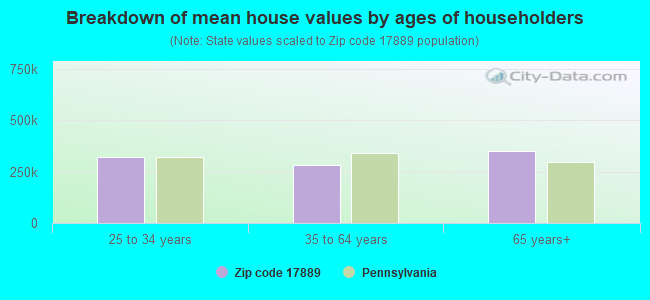
Estimated median house/condo value in 2022: $302,045
17889:
$302,045
Pennsylvania:
$245,500
According to our research of Pennsylvania and other state lists, there were 3 registered sex offenders living in 17889 zip code as of April 26, 2024. The ratio of all residents to sex offenders in zip code 17889 is 935 to 1. The ratio of registered sex offenders to all residents in this zip code is lower than the state average.
Median resident age:
This zip code:
43.0 years
Pennsylvania median age:
40.9 years
Average household size:
This zip code:
2.8 people
Pennsylvania:
2.4 people
Averages for the 2020 tax year for zip code 17889, filed in 2021:
Average Adjusted Gross Income (AGI) in 2020: $75,374 (Individual Income Tax Returns)
Here:
$75,374
State:
$75,707
Salary/wage: $61,735 (reported on 76.0% of returns)
Here:
$61,735
State:
$62,806
(% of AGI for various income ranges: 1125.6% for AGIs below $25k, 3242.3% for AGIs $25k-50k, 6285.3% for AGIs $50k-75k, 10161.0% for AGIs $75k-100k, 17155.8% for AGIs $100k-200k, 92015.0% for AGIs over 200k)
Taxable interest for individuals: $924 (reported on 39.7% of returns)
This zip code:
$924
Pennsylvania:
$1,633
(% of AGI for various income ranges: 34.0% for AGIs below $25k, 25.5% for AGIs $25k-50k, 46.0% for AGIs $50k-75k, 21.0% for AGIs $75k-100k, 130.0% for AGIs $100k-200k, 745.0% for AGIs over 200k)
Ordinary dividends: $4,687 (reported on 26.7% of returns)
Here:
$4,687
State:
$7,382
(% of AGI for various income ranges: 44.0% for AGIs below $25k, 83.2% for AGIs $25k-50k, 92.0% for AGIs $50k-75k, 254.0% for AGIs $75k-100k, 450.8% for AGIs $100k-200k, 3010.0% for AGIs over 200k)
Net capital gain/loss in AGI: +$15,074 (reported on 23.3% of returns)
Here:
+$15,074
State:
+$23,522
(% of AGI for various income ranges: 16.8% for AGIs below $25k, 80.9% for AGIs $25k-50k, 104.7% for AGIs $50k-75k, 165.0% for AGIs $75k-100k, 1113.3% for AGIs $100k-200k, 16235.0% for AGIs over 200k)
Profit/loss from business: +$15,807 (reported on 18.5% of returns)
Here:
+$15,807
State:
+$16,274
(% of AGI for various income ranges: 155.2% for AGIs below $25k, 291.4% for AGIs $25k-50k, 432.7% for AGIs $50k-75k, 793.0% for AGIs $75k-100k, 843.3% for AGIs $100k-200k, 3925.0% for AGIs over 200k)
Taxable individual retirement arrangement distribution: $16,375 (reported on 16.4% of returns)
17889:
$16,375
Pennsylvania:
$18,583
(% of AGI for various income ranges: 147.2% for AGIs below $25k, 202.3% for AGIs $25k-50k, 495.3% for AGIs $50k-75k, 568.0% for AGIs $75k-100k, 1505.0% for AGIs $100k-200k)
Total itemized deductions: $34,522 (reported on 6.2% of returns)
Here:
$34,522
State:
$34,850
(% of AGI for various income ranges: 439.3% for AGIs $50k-75k, 761.7% for AGIs $100k-200k, 7670.0% for AGIs over 200k)
Charity contributions: $15,014 (reported on 4.8% of returns)
Here:
$15,014
State:
$12,392
(% of AGI for various income ranges: 273.3% for AGIs $100k-200k, 3615.0% for AGIs over 200k)
Taxes paid: $7,833 (reported on 6.2% of returns)
17889:
$7,833
State:
$8,200
(% of AGI for various income ranges: 143.3% for AGIs $50k-75k, 201.7% for AGIs $100k-200k, 1240.0% for AGIs over 200k)
Earned income credit: $2,077 (reported on 8.9% of returns)
Here:
$2,077
State:
$2,100
(% of AGI for various income ranges: 60.4% for AGIs below $25k, 54.1% for AGIs $25k-50k)
Percentage of individuals using paid preparers for their 2020 taxes: 91.8%
Here:
92%
State:
92%
(% for various income ranges: 88.9% for AGIs below $25k, 93.5% for AGIs $25k-50k, 95.8% for AGIs $50k-75k, 93.8% for AGIs $75k-100k, 91.3% for AGIs $100k-200k, 85.7% for AGIs over 200k)
Averages for the 2012 tax year for zip code 17889, filed in 2013:
Average Adjusted Gross Income (AGI) in 2012: $63,264 (Individual Income Tax Returns)
Here:
$63,264
State:
$61,346
Salary/wage: $55,149 (reported on 79.6% of returns)
Here:
$55,149
State:
$51,902
(% of AGI for various income ranges: 65.8% for AGIs below $25k, 72.2% for AGIs $25k-50k, 75.2% for AGIs $50k-75k, 72.3% for AGIs $75k-100k, 70.2% for AGIs $100k-200k, 63.8% for AGIs over 200k)
Taxable interest for individuals: $1,071 (reported on 43.1% of returns)
This zip code:
$1,071
Pennsylvania:
$1,588
(% of AGI for various income ranges: 1.8% for AGIs below $25k, 1.2% for AGIs $25k-50k, 0.5% for AGIs $50k-75k, 0.4% for AGIs $75k-100k, 0.8% for AGIs $100k-200k, 0.6% for AGIs over 200k)
Ordinary dividends: $3,597 (reported on 27.7% of returns)
Here:
$3,597
State:
$5,827
(% of AGI for various income ranges: 2.8% for AGIs below $25k, 2.0% for AGIs $25k-50k, 0.9% for AGIs $50k-75k, 1.1% for AGIs $75k-100k, 1.3% for AGIs $100k-200k, 1.9% for AGIs over 200k)
Net capital gain/loss in AGI: +$6,097 (reported on 21.2% of returns)
Here:
+$6,097
State:
+$14,495
(% of AGI for various income ranges: 0.2% for AGIs $25k-50k, 2.0% for AGIs $50k-75k, 0.9% for AGIs $75k-100k, 3.9% for AGIs $100k-200k, 2.6% for AGIs over 200k)
Profit/loss from business: +$10,717 (reported on 16.8% of returns)
Here:
+$10,717
State:
+$16,268
(% of AGI for various income ranges: 6.8% for AGIs below $25k, 4.3% for AGIs $25k-50k, 2.6% for AGIs $50k-75k, 2.7% for AGIs $75k-100k, 4.7% for AGIs $100k-200k)
Taxable individual retirement arrangement distribution: $12,029 (reported on 12.4% of returns)
17889:
$12,029
Pennsylvania:
$14,550
(% of AGI for various income ranges: 5.0% for AGIs below $25k, 3.5% for AGIs $25k-50k, 2.1% for AGIs $50k-75k, 1.5% for AGIs $75k-100k, 4.7% for AGIs $100k-200k)
Total itemized deductions: $21,327 (17% of AGI, reported on 32.1% of returns)
Here:
$21,327
State:
$23,538
Here:
16.9% of AGI
State:
18.4% of AGI
(% of AGI for various income ranges: 10.1% for AGIs below $25k, 8.8% for AGIs $25k-50k, 10.4% for AGIs $50k-75k, 12.3% for AGIs $75k-100k, 12.9% for AGIs $100k-200k, 9.7% for AGIs over 200k)
Charity contributions: $4,234 (reported on 25.5% of returns)
Here:
$4,234
State:
$4,025
(% of AGI for various income ranges: 0.9% for AGIs below $25k, 1.0% for AGIs $25k-50k, 1.7% for AGIs $50k-75k, 1.5% for AGIs $75k-100k, 2.0% for AGIs $100k-200k, 2.1% for AGIs over 200k)
Taxes paid: $9,895 (reported on 31.4% of returns)
17889:
$9,895
State:
$9,982
(% of AGI for various income ranges: 1.8% for AGIs below $25k, 3.3% for AGIs $25k-50k, 3.6% for AGIs $50k-75k, 5.2% for AGIs $75k-100k, 6.2% for AGIs $100k-200k, 5.9% for AGIs over 200k)
Earned income credit: $1,869 (reported on 9.5% of returns)
Here:
$1,869
State:
$2,106
(% of AGI for various income ranges: 2.6% for AGIs below $25k, 0.8% for AGIs $25k-50k)
Percentage of individuals using paid preparers for their 2012 taxes: 59.1%
Here:
59%
State:
53%
(% for various income ranges: 53.8% for AGIs below $25k, 53.6% for AGIs $25k-50k, 65.2% for AGIs $50k-75k, 64.3% for AGIs $75k-100k, 66.7% for AGIs $100k-200k, 80.0% for AGIs over 200k)
Averages for the 2004 tax year for zip code 17889, filed in 2005:
Average Adjusted Gross Income (AGI) in 2004: $52,761 (Individual Income Tax Returns)
Here:
$52,761
State:
$48,049
Salary/wage: $47,341 (reported on 81.6% of returns)
Here:
$47,341
State:
$42,646
(% of AGI for various income ranges: 160.2% for AGIs below $10k, 72.1% for AGIs $10k-25k, 74.3% for AGIs $25k-50k, 83.9% for AGIs $50k-75k, 78.8% for AGIs $75k-100k, 64.4% for AGIs over 100k)
Taxable interest for individuals: $1,279 (reported on 56.4% of returns)
This zip code:
$1,279
Pennsylvania:
$1,657
(% of AGI for various income ranges: 15.3% for AGIs below $10k, 2.8% for AGIs $10k-25k, 1.0% for AGIs $25k-50k, 1.4% for AGIs $50k-75k, 1.9% for AGIs $75k-100k, 0.8% for AGIs over 100k)
Taxable dividends: $1,945 (reported on 31.3% of returns)
Here:
$1,945
State:
$3,566
(% of AGI for various income ranges: 6.3% for AGIs below $10k, 1.4% for AGIs $10k-25k, 0.8% for AGIs $25k-50k, 1.0% for AGIs $50k-75k, 1.4% for AGIs $75k-100k, 1.1% for AGIs over 100k)
Net capital gain/loss: +$2,795 (reported on 24.5% of returns)
Here:
+$2,795
State:
+$9,716
(% of AGI for various income ranges: -1.4% for AGIs below $10k, 0.8% for AGIs $10k-25k, 1.4% for AGIs $25k-50k, 0.8% for AGIs $50k-75k, 1.3% for AGIs $75k-100k, 1.6% for AGIs over 100k)
Profit/loss from business: +$13,478 (reported on 19.4% of returns)
Here:
+$13,478
State:
+$14,267
(% of AGI for various income ranges: 16.5% for AGIs below $10k, 7.7% for AGIs $10k-25k, 6.1% for AGIs $25k-50k, 2.8% for AGIs $50k-75k, 1.2% for AGIs $75k-100k, 6.1% for AGIs over 100k)
IRA payment deduction: $2,952 (reported on 3.3% of returns)
17889:
$2,952
Pennsylvania:
$2,903
Self-employed pension: $13,692 (reported on 1.0% of returns)
Here:
$13,692
Pennsylvania:
$14,674
Total itemized deductions: $19,375 (17% of AGI, reported on 32.1% of returns)
Here:
$19,375
State:
$18,804
Here:
17.3% of AGI
State:
19.5% of AGI
(% of AGI for various income ranges: 7.7% for AGIs $10k-25k, 9.3% for AGIs $25k-50k, 12.5% for AGIs $50k-75k, 14.4% for AGIs $75k-100k, 12.4% for AGIs over 100k)
Charity contributions deductions: $3,300 (3% of AGI, reported on 29.1% of returns)
Here:
$3,300
State:
$3,337
Here:
3.0% of AGI
State:
3.3% of AGI
(% of AGI for various income ranges: 0.8% for AGIs $10k-25k, 1.5% for AGIs $25k-50k, 1.8% for AGIs $50k-75k, 1.8% for AGIs $75k-100k, 2.2% for AGIs over 100k)
Total tax: $9,805 (reported on 76.5% of returns)
17889:
$9,805
State:
$8,008
(% of AGI for various income ranges: 4.8% for AGIs below $10k, 5.1% for AGIs $10k-25k, 7.0% for AGIs $25k-50k, 8.1% for AGIs $50k-75k, 10.7% for AGIs $75k-100k, 22.4% for AGIs over 100k)
Earned income credit: $1,689 (reported on 8.3% of returns)
Here:
$1,689
State:
$1,643
Percentage of individuals using paid preparers for their 2004 taxes: 58.2%
Here:
58%
State:
56%
(% for various income ranges: 55.6% for AGIs below $10k, 55.7% for AGIs $10k-25k, 57.5% for AGIs $25k-50k, 60.9% for AGIs $50k-75k, 58.0% for AGIs $75k-100k, 67.5% for AGIs over 100k)
Household received Food Stamps/SNAP in the past 12 months: 30 Household did not receive Food Stamps/SNAP in the past 12 months: 1,018
Women who had a birth in the past 12 months: 63 (44 now married, 18 unmarried) Women who did not have a birth in the past 12 months: 659 (338 now married, 318 unmarried)
Housing units in zip code 17889 with a mortgage: 485 (50 second mortgage, 33 both second mortgage and home equity loan) Houses without a mortgage: 47
Median monthly owner costs for units with a mortgage: $1,562 Median monthly owner costs for units without a mortgage: $545
Residents with income below the poverty level in 2022:
This zip code:
3.0%
Whole state:
11.8%
Residents with income below 50% of the poverty level in 2022:
This zip code:
2.2%
Whole state:
6.1%
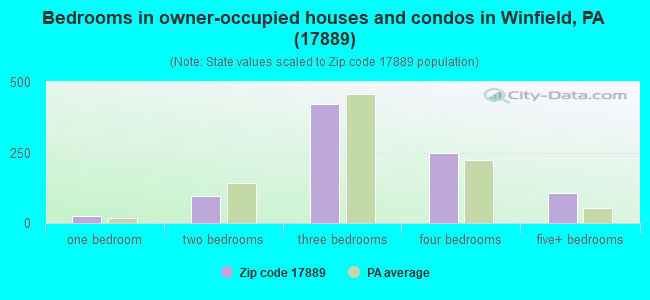
Median number of rooms in houses and condos:
Here:
7.6
State:
6.8
Median number of rooms in apartments:
Here:
6.1
State:
4.3
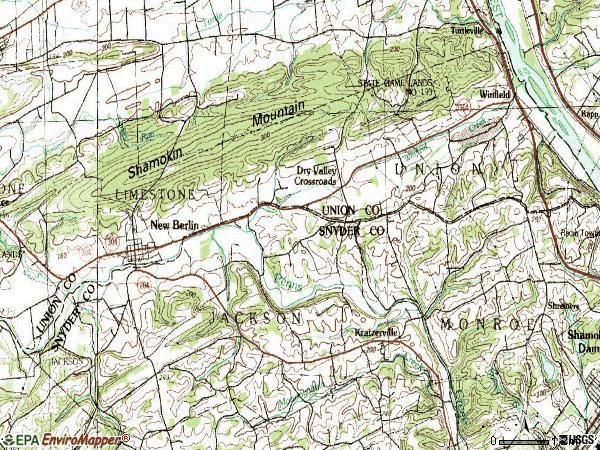
Notable locations in this zip code not listed on our city pages
In group quarters: 4 (-1 institutionalized population)
Size of family households: 311 2-persons, 160 3-persons, 203 4-persons, 44 5-persons, 43 6-persons, 22 7-or-more-persons
Size of nonfamily households: 222 1-person, 37 2-persons, 1 3-persons
549 married couples with children.
73 single-parent households (31 men, 42 women).
93.6% of residents of 17889 zip code speak English at home.
0.9% of residents speak Spanish at home (73% very well, 4% well, 23% not well).
4.5% of residents speak other Indo-European language at home (83% very well, 14% well, 2% not well).
0.3% of residents speak Asian or Pacific Island language at home (100% very well).
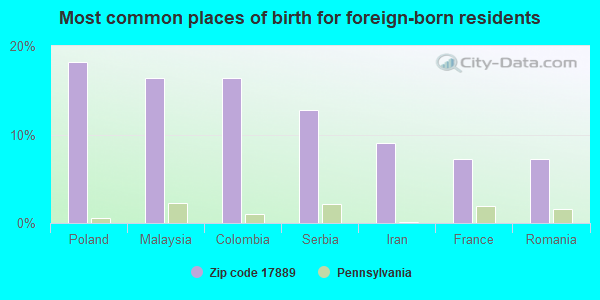
Foreign born population: 56 (1.9%) (100.0% of them are naturalized citizens)
This zip code:
1.9%
Whole state:
7.5%
18%Poland
16%Malaysia
16%Colombia
13%Serbia
9%Iran
7%France
7%Romania
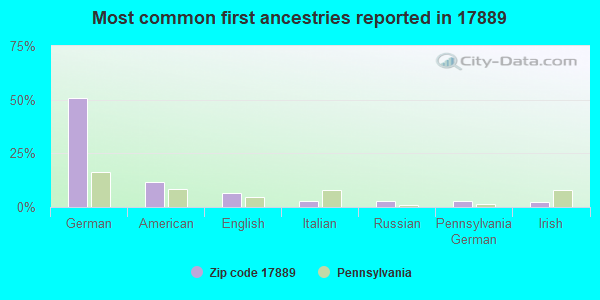
51%German
11%American
7%English
3%Italian
3%Russian
3%Pennsylvania German
2%Irish
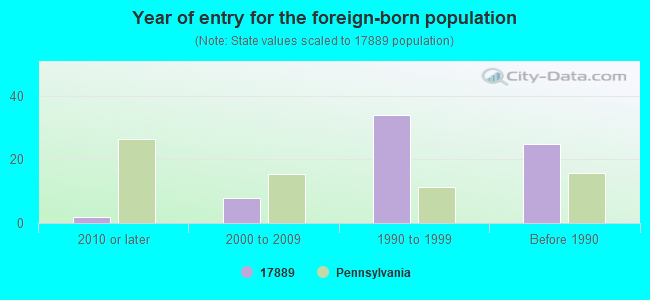
Year of entry for the foreign-born population
22010 or later
82000 to 2009
341990 to 1999
25Before 1990
Facilities with environmental interests located in this zip code:
Housing units lacking complete plumbing facilities: 0.8% Housing units lacking complete kitchen facilities: 0.2%
37.7%Electricity
30.4%Fuel oil, kerosene, etc.
8.9%Bottled, tank, or LP gas
7.3%Wood
6.2%Utility gas
5.9%Coal or coke
3.0%Other fuel
1.0%No fuel used
Population in 1990: 2,071. Population change in the 1990s: +629 (+30.4%).
Place of birth for U.S.-born residents:
This state: 2,459
Northeast: 132
Midwest: 123
South: 137
West: 50
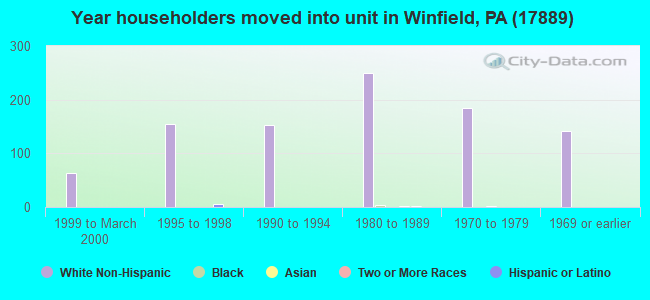
78% of the 17889 zip code residents lived in the same house 5 years ago. Out of people who lived in different houses, 35% lived in this county. Out of people who lived in different counties, 50% lived in Pennsylvania.
96% of the 17889 zip code residents lived in the same house 1 year ago. Out of people who lived in different houses, 28% moved from this county. Out of people who lived in different houses, 47% moved from different county within same state. Out of people who lived in different houses, 32% moved from different state.
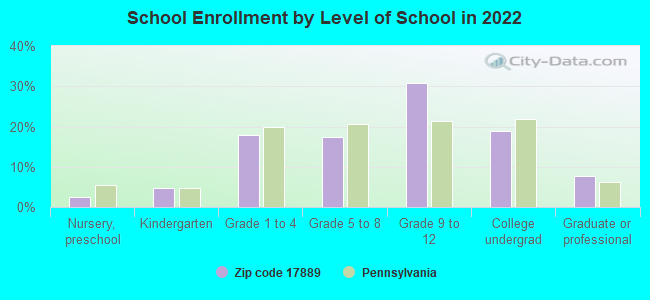
Private vs. public school enrollment:
Students in private schools in grades 1 to 8 (elementary and middle school): 53
Here:
21.0%
Pennsylvania:
15.7%
Students in private schools in grades 9 to 12 (high school): 24
Here:
11.1%
Pennsylvania:
13.4%
Students in private undergraduate colleges: 46
Here:
34.5%
Pennsylvania:
39.8%
Occupation by median earnings in the past 12 months ($)
106,720Business and financial operations occupations
102,014Health diagnosing and treating practitioners and other technical occupations
93,181Management occupations
84,282Computer and mathematical occupations
54,157Education, training, and library occupations
51,457Installation, maintenance, and repair occupations
Companies with federal contracts located in this zip code:
W M WAGNER SALES CO , INC (1723 WEST BRANCH HIGHWAY in WINFIELD, PA; small business)
$7,000 with U.S. Army Corps of Engineers - civil program financing only for Hose, Pipe, Tube, Lubrication, and Railing Fittings. Signed on 2003-09-24. Completion date: 2003-10-30.
Top industries in this zip code by the number of employees in 2005:
Construction: Site Preparation Contractors (10-19: 1, 1-4: 1)
Other Services (except Public Administration): Religious Organizations (5-9: 2, 1-4: 1)
Construction: New Single-Family Housing Construction (except Operative Builders) (5-9: 1, 1-4: 3)
Health Care and Social Assistance: Offices of Physicians (except Mental Health Specialists) (5-9: 1)
Accommodation and Food Services: RV (Recreational Vehicle) Parks and Campgrounds (5-9: 1)
Fatal accident statistics in 2013:
Fatal accident count: 1
Vehicles involved in fatal accidents: 2
Fatal accidents caused by drunken drivers: 0
Fatalities: 1
Persons involved in fatal accidents: 3
Pedestrians involved in fatal accidents: 0
Fatal accident statistics in 2012:
Fatal accident count: 1
Vehicles involved in fatal accidents: 1
Fatal accidents caused by drunken drivers: 0
Fatalities: 1
Persons involved in fatal accidents: 4
Pedestrians involved in fatal accidents: 0
2006 - 2018 National Fire Incident Reporting System (NFIRS) incidents
Based on the data from the years 2006 - 2018 the average number of fire incidents per year is 9. The highest number of reported fires - 27 took place in 2009, and the least - 0 in 2013. The data has a decreasing trend.
When looking into fire subcategories, the most incidents belonged to: Structure Fires (49.1%), and Outside Fires (38.6%).
Fire incident types reported to NFIRS in Zip Code 17889


 Nearest zip codes: 17855, 17870, 17876, 17837, 17850, 17827.


 Based on the data from the years 2006 - 2018 the average number of fire incidents per year is 9. The highest number of reported fires - 27 took place in 2009, and the least - 0 in 2013. The data has a decreasing trend.
 When looking into fire subcategories, the most incidents belonged to: Structure Fires (49.1%), and Outside Fires (38.6%).