Estimated zip code population in 2022: 31,437 Zip code population in 2010: 32,413 Zip code population in 2000: 30,951
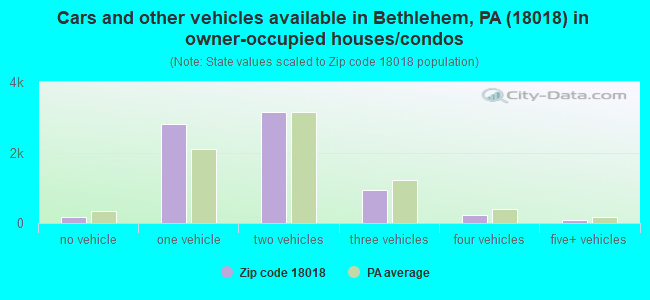
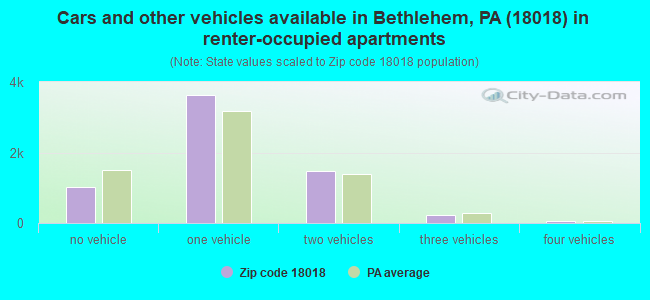
Houses and condos: 14,487 Renter-occupied apartments: 6,413
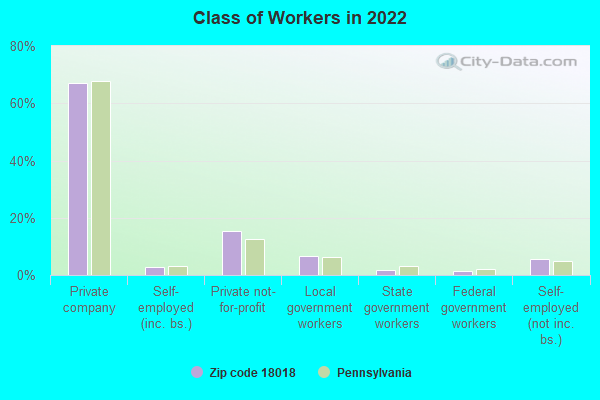
% of renters here:
47%
State:
31%
March 2022 cost of living index in zip code 18018: 99.0 (near average, U.S. average is 100)
Land area: 5.2 sq. mi. Water area: 0.1 sq. mi.
Population density: 6,101 people per square mile
(high).
OSM Map
General Map
Google Map
MSN Map
OSM Map
General Map
Google Map
MSN Map
OSM Map
General Map
Google Map
MSN Map
OSM Map
General Map
Google Map
MSN Map
Please wait while loading the map...
Real estate property taxes paid for housing units in 2022:
This zip code:
1.7% ($3,755)
Pennsylvania:
1.3% ($3,094)
Median real estate property taxes paid for housing units with mortgages in 2022: $3,896 (1.7%) Median real estate property taxes paid for housing units with no mortgage in 2022: $3,545 (1.6%)
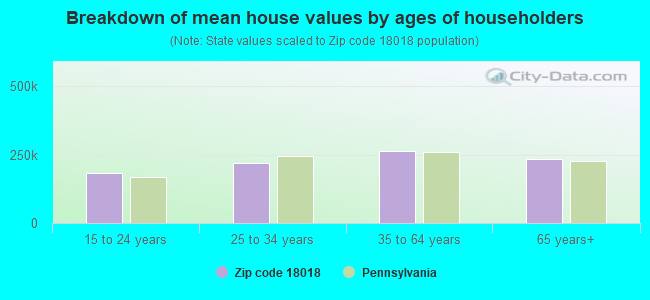
Estimated median house/condo value in 2022: $222,383
18018:
$222,383
Pennsylvania:
$245,500
According to our research of Pennsylvania and other state lists, there were 24 registered sex offenders living in 18018 zip code as of April 27, 2024. The ratio of all residents to sex offenders in zip code 18018 is 1,354 to 1. The ratio of registered sex offenders to all residents in this zip code is lower than the state average.
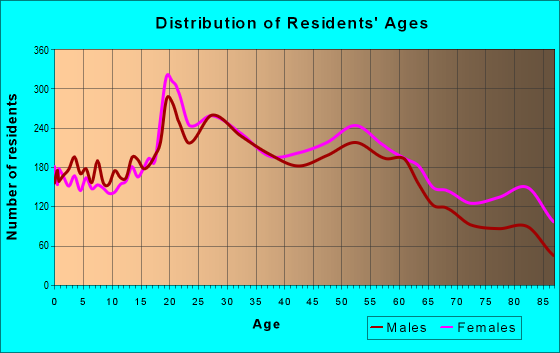
Median resident age:
This zip code:
38.3 years
Pennsylvania median age:
40.9 years
Average household size:
This zip code:
2.2 people
Pennsylvania:
2.4 people
Averages for the 2020 tax year for zip code 18018, filed in 2021:
Average Adjusted Gross Income (AGI) in 2020: $55,859 (Individual Income Tax Returns)
Here:
$55,859
State:
$75,707
Salary/wage: $48,953 (reported on 82.1% of returns)
Here:
$48,953
State:
$62,806
(% of AGI for various income ranges: 1055.5% for AGIs below $25k, 3526.5% for AGIs $25k-50k, 6474.3% for AGIs $50k-75k, 9413.8% for AGIs $75k-100k, 16580.5% for AGIs $100k-200k, 80206.0% for AGIs over 200k)
Taxable interest for individuals: $1,189 (reported on 24.8% of returns)
This zip code:
$1,189
Pennsylvania:
$1,633
(% of AGI for various income ranges: 13.3% for AGIs below $25k, 14.1% for AGIs $25k-50k, 33.0% for AGIs $50k-75k, 48.6% for AGIs $75k-100k, 112.5% for AGIs $100k-200k, 1532.0% for AGIs over 200k)
Ordinary dividends: $5,303 (reported on 18.0% of returns)
Here:
$5,303
State:
$7,382
(% of AGI for various income ranges: 32.1% for AGIs below $25k, 35.4% for AGIs $25k-50k, 77.5% for AGIs $50k-75k, 158.7% for AGIs $75k-100k, 465.6% for AGIs $100k-200k, 5401.0% for AGIs over 200k)
Net capital gain/loss in AGI: +$9,426 (reported on 14.8% of returns)
Here:
+$9,426
State:
+$23,522
(% of AGI for various income ranges: 11.4% for AGIs below $25k, 21.1% for AGIs $25k-50k, 66.1% for AGIs $50k-75k, 130.7% for AGIs $75k-100k, 571.5% for AGIs $100k-200k, 13991.0% for AGIs over 200k)
Profit/loss from business: +$11,374 (reported on 10.9% of returns)
Here:
+$11,374
State:
+$16,274
(% of AGI for various income ranges: 73.5% for AGIs below $25k, 68.3% for AGIs $25k-50k, 158.0% for AGIs $50k-75k, 241.8% for AGIs $75k-100k, 686.7% for AGIs $100k-200k, 2305.0% for AGIs over 200k)
Taxable individual retirement arrangement distribution: $16,025 (reported on 9.0% of returns)
18018:
$16,025
Pennsylvania:
$18,583
(% of AGI for various income ranges: 49.1% for AGIs below $25k, 71.5% for AGIs $25k-50k, 154.9% for AGIs $50k-75k, 316.9% for AGIs $75k-100k, 815.6% for AGIs $100k-200k, 4417.0% for AGIs over 200k)
Self-employed (Keogh) retirement plans: $21,225 (reported on 0.2% of returns)
18018:
$21,225
Pennsylvania:
$25,407
(% of AGI for various income ranges: 78.6% for AGIs $100k-200k)
Total itemized deductions: $27,271 (reported on 5.2% of returns)
Here:
$27,271
State:
$34,850
(% of AGI for various income ranges: 29.4% for AGIs below $25k, 70.4% for AGIs $25k-50k, 205.9% for AGIs $50k-75k, 333.6% for AGIs $75k-100k, 543.5% for AGIs $100k-200k, 6295.0% for AGIs over 200k)
Charity contributions: $9,361 (reported on 3.8% of returns)
Here:
$9,361
State:
$12,392
(% of AGI for various income ranges: 1.2% for AGIs below $25k, 9.2% for AGIs $25k-50k, 26.4% for AGIs $50k-75k, 57.7% for AGIs $75k-100k, 119.5% for AGIs $100k-200k, 3276.0% for AGIs over 200k)
Taxes paid: $6,925 (reported on 5.2% of returns)
18018:
$6,925
State:
$8,200
(% of AGI for various income ranges: 4.0% for AGIs below $25k, 15.2% for AGIs $25k-50k, 64.2% for AGIs $50k-75k, 105.5% for AGIs $75k-100k, 166.5% for AGIs $100k-200k, 1027.0% for AGIs over 200k)
Earned income credit: $2,005 (reported on 14.2% of returns)
Here:
$2,005
State:
$2,100
(% of AGI for various income ranges: 72.9% for AGIs below $25k, 51.2% for AGIs $25k-50k, 0.6% for AGIs $50k-75k)
Percentage of individuals using paid preparers for their 2020 taxes: 92.0%
Here:
92%
State:
92%
(% for various income ranges: 89.9% for AGIs below $25k, 93.4% for AGIs $25k-50k, 92.9% for AGIs $50k-75k, 92.6% for AGIs $75k-100k, 91.9% for AGIs $100k-200k, 94.4% for AGIs over 200k)
Averages for the 2012 tax year for zip code 18018, filed in 2013:
Average Adjusted Gross Income (AGI) in 2012: $45,809 (Individual Income Tax Returns)
Here:
$45,809
State:
$61,346
Salary/wage: $41,428 (reported on 82.4% of returns)
Here:
$41,428
State:
$51,902
(% of AGI for various income ranges: 69.1% for AGIs below $25k, 82.1% for AGIs $25k-50k, 79.7% for AGIs $50k-75k, 78.5% for AGIs $75k-100k, 75.3% for AGIs $100k-200k, 42.4% for AGIs over 200k)
Taxable interest for individuals: $1,037 (reported on 32.0% of returns)
This zip code:
$1,037
Pennsylvania:
$1,588
(% of AGI for various income ranges: 1.2% for AGIs below $25k, 0.6% for AGIs $25k-50k, 0.6% for AGIs $50k-75k, 0.5% for AGIs $75k-100k, 0.6% for AGIs $100k-200k, 1.5% for AGIs over 200k)
Ordinary dividends: $4,264 (reported on 20.6% of returns)
Here:
$4,264
State:
$5,827
(% of AGI for various income ranges: 1.8% for AGIs below $25k, 1.2% for AGIs $25k-50k, 1.3% for AGIs $50k-75k, 1.4% for AGIs $75k-100k, 2.4% for AGIs $100k-200k, 5.1% for AGIs over 200k)
Net capital gain/loss in AGI: +$4,731 (reported on 13.3% of returns)
Here:
+$4,731
State:
+$14,495
(% of AGI for various income ranges: 0.2% for AGIs $25k-50k, 0.3% for AGIs $50k-75k, 0.8% for AGIs $75k-100k, 1.2% for AGIs $100k-200k, 9.5% for AGIs over 200k)
Profit/loss from business: +$13,667 (reported on 9.8% of returns)
Here:
+$13,667
State:
+$16,268
(% of AGI for various income ranges: 5.1% for AGIs below $25k, 2.3% for AGIs $25k-50k, 1.8% for AGIs $50k-75k, 1.7% for AGIs $75k-100k, 2.3% for AGIs $100k-200k, 8.0% for AGIs over 200k)
Taxable individual retirement arrangement distribution: $11,463 (reported on 11.0% of returns)
18018:
$11,463
Pennsylvania:
$14,550
(% of AGI for various income ranges: 3.5% for AGIs below $25k, 1.8% for AGIs $25k-50k, 2.4% for AGIs $50k-75k, 3.0% for AGIs $75k-100k, 3.9% for AGIs $100k-200k, 2.2% for AGIs over 200k)
Self-employment retirement plans: $13,017 (reported on 0.4% of returns)
18018:
$13,017
Pennsylvania:
$20,922
Total itemized deductions: $17,517 (21% of AGI, reported on 28.1% of returns)
Here:
$17,517
State:
$23,538
Here:
21.4% of AGI
State:
18.4% of AGI
(% of AGI for various income ranges: 8.8% for AGIs below $25k, 8.6% for AGIs $25k-50k, 11.5% for AGIs $50k-75k, 11.9% for AGIs $75k-100k, 12.0% for AGIs $100k-200k, 11.9% for AGIs over 200k)
Charity contributions: $2,922 (reported on 21.2% of returns)
Here:
$2,922
State:
$4,025
(% of AGI for various income ranges: 0.5% for AGIs below $25k, 0.7% for AGIs $25k-50k, 1.1% for AGIs $50k-75k, 1.2% for AGIs $75k-100k, 1.6% for AGIs $100k-200k, 4.1% for AGIs over 200k)
Taxes paid: $6,590 (reported on 27.9% of returns)
18018:
$6,590
State:
$9,982
(% of AGI for various income ranges: 1.8% for AGIs below $25k, 2.8% for AGIs $25k-50k, 4.1% for AGIs $50k-75k, 4.7% for AGIs $75k-100k, 5.4% for AGIs $100k-200k, 5.1% for AGIs over 200k)
Earned income credit: $2,034 (reported on 15.1% of returns)
Here:
$2,034
State:
$2,106
(% of AGI for various income ranges: 4.8% for AGIs below $25k, 0.8% for AGIs $25k-50k)
Percentage of individuals using paid preparers for their 2012 taxes: 46.2%
Here:
46%
State:
53%
(% for various income ranges: 42.3% for AGIs below $25k, 45.8% for AGIs $25k-50k, 47.7% for AGIs $50k-75k, 52.4% for AGIs $75k-100k, 54.4% for AGIs $100k-200k, 75.0% for AGIs over 200k)
Averages for the 2004 tax year for zip code 18018, filed in 2005:
Average Adjusted Gross Income (AGI) in 2004: $39,585 (Individual Income Tax Returns)
Here:
$39,585
State:
$48,049
Salary/wage: $36,009 (reported on 82.3% of returns)
Here:
$36,009
State:
$42,646
(% of AGI for various income ranges: 87.3% for AGIs below $10k, 71.2% for AGIs $10k-25k, 82.6% for AGIs $25k-50k, 81.6% for AGIs $50k-75k, 79.9% for AGIs $75k-100k, 56.8% for AGIs over 100k)
Taxable interest for individuals: $1,446 (reported on 47.1% of returns)
This zip code:
$1,446
Pennsylvania:
$1,657
(% of AGI for various income ranges: 6.1% for AGIs below $10k, 2.4% for AGIs $10k-25k, 1.5% for AGIs $25k-50k, 1.2% for AGIs $50k-75k, 1.7% for AGIs $75k-100k, 1.7% for AGIs over 100k)
Taxable dividends: $2,953 (reported on 26.3% of returns)
Here:
$2,953
State:
$3,566
(% of AGI for various income ranges: 5.1% for AGIs below $10k, 2.1% for AGIs $10k-25k, 1.3% for AGIs $25k-50k, 1.4% for AGIs $50k-75k, 1.5% for AGIs $75k-100k, 3.2% for AGIs over 100k)
Net capital gain/loss: +$5,341 (reported on 18.5% of returns)
Here:
+$5,341
State:
+$9,716
(% of AGI for various income ranges: -2.4% for AGIs below $10k, 0.2% for AGIs $10k-25k, 0.3% for AGIs $25k-50k, 0.6% for AGIs $50k-75k, 1.0% for AGIs $75k-100k, 9.2% for AGIs over 100k)
Profit/loss from business: +$12,376 (reported on 9.8% of returns)
Here:
+$12,376
State:
+$14,267
(% of AGI for various income ranges: 2.8% for AGIs below $10k, 3.2% for AGIs $10k-25k, 2.2% for AGIs $25k-50k, 1.9% for AGIs $50k-75k, 2.9% for AGIs $75k-100k, 5.2% for AGIs over 100k)
IRA payment deduction: $2,595 (reported on 2.3% of returns)
18018:
$2,595
Pennsylvania:
$2,903
(% of AGI for various income ranges: 0.1% for AGIs below $10k, 0.2% for AGIs $10k-25k, 0.2% for AGIs $25k-50k, 0.1% for AGIs $50k-75k, 0.1% for AGIs $75k-100k, 0.1% for AGIs over 100k)
Self-employed pension: $11,806 (reported on 0.6% of returns)
Here:
$11,806
Pennsylvania:
$14,674
(% of AGI for various income ranges: 0.0% for AGIs $25k-50k, 0.1% for AGIs $50k-75k, 0.2% for AGIs $75k-100k, 0.5% for AGIs over 100k)
Total itemized deductions: $14,828 (21% of AGI, reported on 29.5% of returns)
Here:
$14,828
State:
$18,804
Here:
20.7% of AGI
State:
19.5% of AGI
(% of AGI for various income ranges: 9.9% for AGIs below $10k, 8.0% for AGIs $10k-25k, 9.6% for AGIs $25k-50k, 12.8% for AGIs $50k-75k, 13.1% for AGIs $75k-100k, 11.3% for AGIs over 100k)
Charity contributions deductions: $2,706 (4% of AGI, reported on 25.2% of returns)
Here:
$2,706
State:
$3,337
Here:
3.6% of AGI
State:
3.3% of AGI
(% of AGI for various income ranges: 0.6% for AGIs below $10k, 0.7% for AGIs $10k-25k, 1.0% for AGIs $25k-50k, 1.6% for AGIs $50k-75k, 1.9% for AGIs $75k-100k, 3.2% for AGIs over 100k)
Total tax: $5,466 (reported on 76.0% of returns)
18018:
$5,466
State:
$8,008
(% of AGI for various income ranges: 2.0% for AGIs below $10k, 4.1% for AGIs $10k-25k, 7.7% for AGIs $25k-50k, 9.4% for AGIs $50k-75k, 11.1% for AGIs $75k-100k, 18.1% for AGIs over 100k)
Earned income credit: $1,483 (reported on 12.8% of returns)
Here:
$1,483
State:
$1,643
Percentage of individuals using paid preparers for their 2004 taxes: 49.8%
Here:
50%
State:
56%
(% for various income ranges: 42.8% for AGIs below $10k, 51.3% for AGIs $10k-25k, 48.8% for AGIs $25k-50k, 52.3% for AGIs $50k-75k, 52.0% for AGIs $75k-100k, 64.3% for AGIs over 100k)
Likely homosexual households (counted as self-reported same-sex unmarried-partner households)
Lesbian couples: 0.0% of all households
Gay men: 0.2% of all households
Household received Food Stamps/SNAP in the past 12 months: 2,090 Household did not receive Food Stamps/SNAP in the past 12 months: 11,666
Women who had a birth in the past 12 months: 408 (200 now married, 189 unmarried) Women who did not have a birth in the past 12 months: 7,260 (2,370 now married, 4,908 unmarried)
Housing units in zip code 18018 with a mortgage: 4,474 (525 second mortgage, 9 home equity loan, 383 both second mortgage and home equity loan) Houses without a mortgage: 242
Median monthly owner costs for units with a mortgage: $1,459 Median monthly owner costs for units without a mortgage: $600
Residents with income below the poverty level in 2022:
This zip code:
18.4%
Whole state:
11.8%
Residents with income below 50% of the poverty level in 2022:
This zip code:
10.8%
Whole state:
6.1%
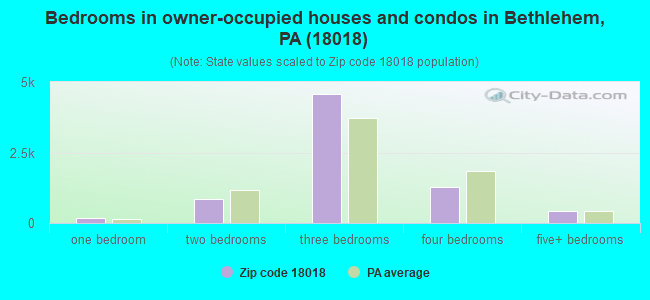
Median number of rooms in houses and condos:
Here:
6.5
State:
6.8
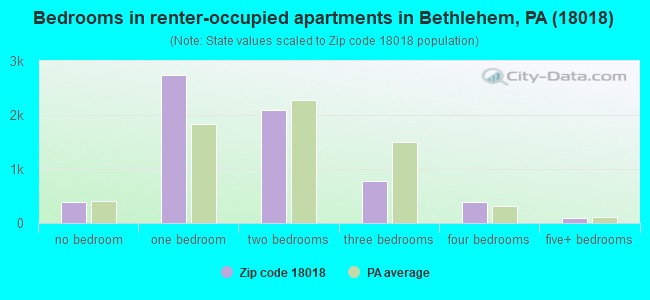
Median number of rooms in apartments:
Here:
3.8
State:
4.3
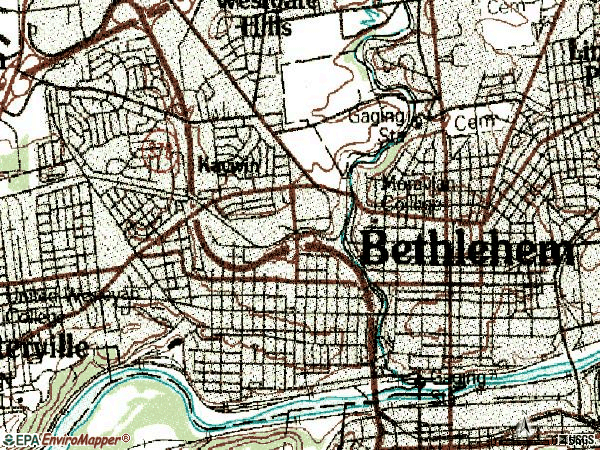
Notable locations in this zip code not listed on our city pages
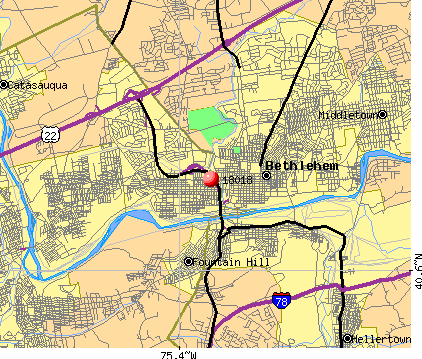
Notable locations in zip code 18018: Allen Junction (A), Bethlehem City Fire Department Memorial Station (B), Bethlehem City Fire Department Northwest Station (C). Display/hide their locations on the map
Churches in zip code 18018 include: Calvary Church (A), Saint Nicholas Church (B), Church of the Manger (C), Saint Nicholas Church (D), Saint Stephens Church (E), Calvary Church (F), Pilgrim Church (G). Display/hide their locations on the map
Parks in zip code 18018 include: Rosegarden Park (1), Delta Manor Park (2), Stratford Park (3), Clearview Park (4), Beth-Allen Park (5), Buchanan Park (6), Monocacy Park (7). Display/hide their locations on the map
2,369 married couples with children.
1,700 single-parent households (328 men, 1,372 women).
79.5% of residents of 18018 zip code speak English at home.
17.3% of residents speak Spanish at home (56% very well, 22% well, 19% not well, 3% not at all).
2.9% of residents speak other Indo-European language at home (73% very well, 15% well, 12% not well, 1% not at all).
0.8% of residents speak Asian or Pacific Island language at home (63% very well, 28% well, 10% not well).
0.2% of residents speak other language at home (100% very well).
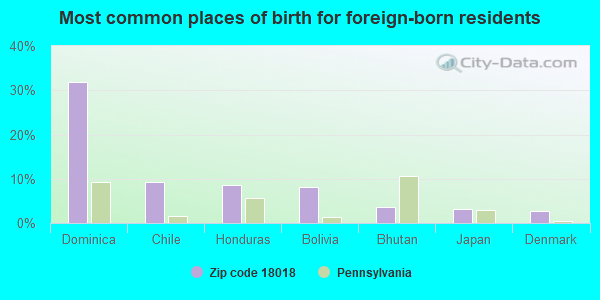
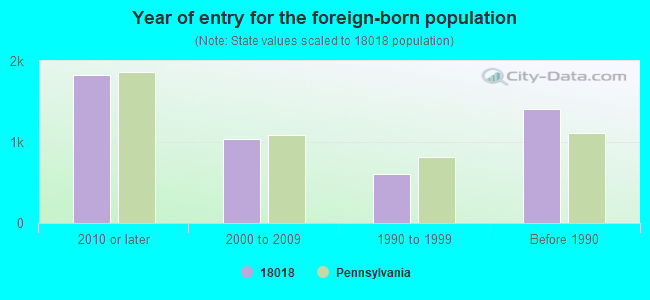
Foreign born population: 2,813 (8.9%) (57.4% of them are naturalized citizens)
Facilities with environmental interests located in this zip code:
BETHLEHEM CITY WATER SYS (10 E CHURCH ST in BETHLEHEM, PA)
(Integrated Compliance Information System) - ICIS-03-1996-0257, FORMAL ENFORCEMENT ACTION STATE MASTER (Pennsylvania database) - PWSID-3480046, DRINKING WATER PROGRAM COMMUNITY WATER SYSTEM (SDWIS) - SDWIS-PA3480046 301, WATER TREATMENT PLANT, SDWIS-PA3480046 302, SDWIS-PA3480046 303, SDWIS-PA3480046 304, SDWIS-PA3480046 305, SDWIS-PA3480046 306, SDWIS-PA3480046 307, Business SIC classification: WATER SUPPLY Organizations: CITY OF BETHLEHEM (CONTACT/OWNER)
BETHLEHEM SUBURBAN MOTOR SALES (2135 W UNION BLVD in BETHLEHEM, PA)
STATE MASTER (Pennsylvania database) - RCRIS-PAD043391788, HAZARDOUS WASTE PROGRAM Small Quantity Generators, between 100 kg and 1000 kg of hazardous waste/month (Resource Conservation and Recovery Act (tracking hazardous waste)) - notification Organizations: OPERNAME (CONTACT/OPERATOR)
, KELECHAVA, LEE (CONTACT/OWNER)
ATLANTIC SERVICE STATION (2136 WEST UNION BOULEVARD in BETHLEHEM, PA)
(Resource Conservation and Recovery Act (tracking hazardous waste)) Business NAICS classification: SWITCHGEAR AND SWITCHBOARD APPARATUS MANUFACTURING. Organizations: OPERNAME (CONTACT/OPERATOR)
ALLENTOWN TESTING LABORATORIES (754 E FAIRVIEW ST in BETHLEHEM, PA)
Small Quantity Generators, between 100 kg and 1000 kg of hazardous waste/month (Resource Conservation and Recovery Act (tracking hazardous waste)) - notification Organizations: OPERNAME (CONTACT/OPERATOR)
, CERTIFIELD TESTING LABS (CONTACT/OWNER)
BELL ATLANTIC PA BETHLEHEM CENTRAL (525 N NEW ST in BETHLEHEM, PA)
(Resource Conservation and Recovery Act (tracking hazardous waste))
BETHLEHEM ARMORY (301 PROSPECT AVE in BETHLEHEM, PA)
Conditionally Exempt Small Quantity Generators, less than 100 kg/month of hazardous waste (Resource Conservation and Recovery Act (tracking hazardous waste)) - notification Organizations: PA DEPT OF MILITARY AFFAIRS (CONTACT/OWNER)
ARCHDIOCESE OF ALLENTOWN (2195 MADISON AVE. in BETHLEHEM, PA)
COMPLIANCE ACTIVITY (Tracking inspections of insecticide, fungicide, and rodenticide, and toxic substances) Business SIC classification: ELEMENTARY AND SECONDARY SCHOOLS
BETHLEHEM SHOPPING CENTER (W. UNION BLVD. in BETHLEHEM, PA)
ENFORCEMENT/COMPLIANCE ACTIVITY (Integrated Compliance Information System)
Housing units lacking complete plumbing facilities: 0.6% Housing units lacking complete kitchen facilities: 0.7%
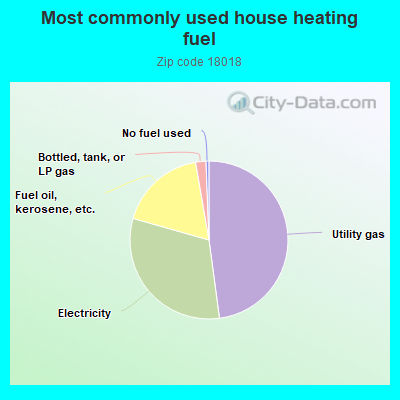
47.7%Utility gas
31.4%Electricity
17.8%Fuel oil, kerosene, etc.
2.1%Bottled, tank, or LP gas
0.6%No fuel used
Population in 1990: 32,072.
Place of birth for U.S.-born residents:
This state: 18,336
Northeast: 5,722
Midwest: 771
South: 1,276
West: 568
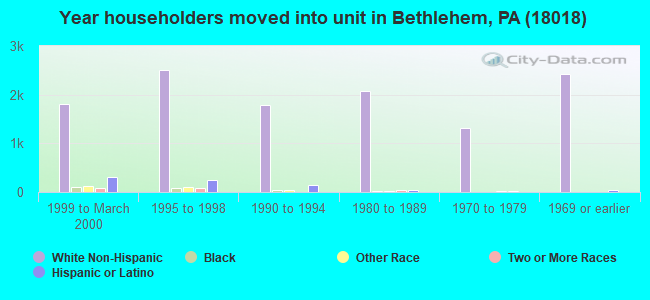
61% of the 18018 zip code residents lived in the same house 5 years ago. Out of people who lived in different houses, 44% lived in this county. Out of people who lived in different counties, 50% lived in Pennsylvania.
88% of the 18018 zip code residents lived in the same house 1 year ago. Out of people who lived in different houses, 35% moved from this county. Out of people who lived in different houses, 51% moved from different county within same state. Out of people who lived in different houses, 7% moved from different state. Out of people who lived in different houses, 6% moved from abroad.
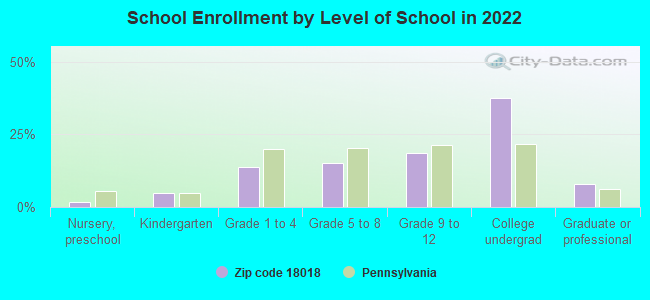
Private vs. public school enrollment:
Students in private schools in grades 1 to 8 (elementary and middle school): 163
Here:
8.0%
Pennsylvania:
15.7%
Students in private schools in grades 9 to 12 (high school): 40
Here:
3.1%
Pennsylvania:
13.4%
Students in private undergraduate colleges: 1,571
Here:
59.6%
Pennsylvania:
39.8%
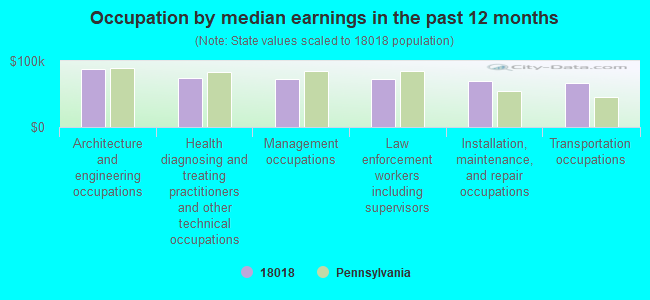
Occupation by median earnings in the past 12 months ($)
87,182Architecture and engineering occupations
74,096Health diagnosing and treating practitioners and other technical occupations
72,226Management occupations
72,139Law enforcement workers including supervisors
69,956Installation, maintenance, and repair occupations
67,028Transportation occupations
Companies with federal contracts located in this zip code (BETHLEHEM, PA):
WAVEFRONT RESEARCH, INCORPORAT (616 WEST BROAD STREET; small business) : $4,397,188 in 20 contractsfrom 2000 to 2006
Contracts for Other Defense -- Operational Systems Development (R&D), Defense Electronics and Communication Equipment -- Management and Support (R&D), Other Defense -- Basic Research (R&D), Defense Electronics and Communication Equipment -- Basic Research (R&D), and moreby Air Force, Navy, Army Signed by year:2000: $247,954; 2001: $30,118; 2002: $69,993; 2003: $169,978; 2004: $1,744,874; 2005: $1,391,499; 2006: $742,772.
Biggest contracts:
$450,000 with Air Force for Other Defense -- Operational Systems Development (R&D). Signed on 2004-08-09. Completion date: 2006-11-09.
$375,000 with Air Force for Defense Electronics and Communication Equipment -- Management and Support (R&D). Signed on 2005-04-12. Completion date: 2007-04-11.
$374,996 with Navy for Other Defense -- Basic Research (R&D). Signed on 2005-06-22. Completion date: 2006-06-23.
$374,996, same as above.Signed on 2004-06-25. Completion date: 2006-06-23.
JOE V POPLAWSKI (528 N NEW ST UNIT 3; small business) : $613,000 in 7 contractsfrom 1999 to 2006
Contracts for Physical Sciences -- Basic Research (R&D), Services -- Basic Research (R&D), by NASA, Army Signed by year:2000: $336,000; 2001: $173,000; 2002: $0; 2003: $0; 2004: $5,000; 2005: $0; 2006: $10,000.
Biggest contracts:
$191,000 with NASA for Physical Sciences -- Basic Research (R&D). Signed on 2000-01-15. Completion date: 2001-10-15.
$173,000, same as above.Signed on 2001-06-15. Completion date: 2001-10-15.
$90,000, same as above.Signed on 2000-12-15. Completion date: 2001-10-15.
$89,000, same as above.Signed on 1999-11-15. Completion date: 2001-10-15.
ALTRONICS INC (824 8TH AVE; small business) : $433,851 in 19 contractsfrom 2003 to 2006
Contracts for Inspection Services (including commercial testing and lab services, except medical/dental) -- Alarm, Signal, and Security Detection Systems, Maintenance, Repair and Rebuilding of Equipment -- Alarm, Signal, and Security Detection Systems, Maintenance, Repair and Rebuilding of Equipment -- Miscellaneous, ADP Support Equipment, and moreby Army Signed by year:2000: $0; 2001: $0; 2002: $0; 2003: $105,697; 2004: $120,342; 2005: $126,785; 2006: $81,027.
Biggest contracts:
$60,000 with Army for Inspection Services (including commercial testing and lab services, except medical/dental) -- Alarm, Signal, and Security Detection Systems. Signed on 2006-02-16. Completion date: 2007-02-15.
$60,000 with Army for Maintenance, Repair and Rebuilding of Equipment -- Alarm, Signal, and Security Detection Systems. Signed on 2004-11-10. Completion date: 2005-10-31.
$50,000 with Army for Maintenance, Repair and Rebuilding of Equipment -- Miscellaneous. Signed on 2003-07-22. Completion date: 2004-07-22.
$43,483 with Army for ADP Support Equipment. Signed on 2005-02-03. Completion date: 2005-02-25.
COURTYARD BY MARRIOTT II L P (2160 MOTEL DR; small business) : $22,974 in 5 contractsfrom 2002 to 2005
Contracts for Lodging - Hotel/Motel by Army Signed by year:2000: $0; 2001: $0; 2002: $8,965; 2003: $6,490; 2004: $3,869; 2005: $3,650; 2006: $0.
Biggest contracts:
$8,965 with Army for Lodging - Hotel/Motel. Signed on 2002-12-11. Completion date: 2002-12-15.
$6,490, same as above.Signed on 2003-01-17. Completion date: 2003-01-23.
$3,796, same as above.Signed on 2004-12-09. Completion date: 2004-12-05.
$3,650, same as above.Signed on 2005-06-02. Completion date: 2005-06-05.
EOFFICEDIRECT COM LLC (605 E BROAD ST) : $11,156 in 3 contractsfrom 2003 to 2005
$4,746 with Navy for Office Furniture. Signed on 2004-09-17. Completion date: 2004-09-27.
$3,850 with Army for Office Furniture. Signed on 2003-02-05. Completion date: 2003-02-14.
$2,560, same as above.Signed on 2005-11-22. Completion date: 2005-11-30.
ROLAND & ROLAND INC (900 13TH AVE; small business)
$6,825 with Navy for Plastics Fabricated Materials. Signed on 2005-03-11. Completion date: 2005-04-29.
NAIR, KISHAN (1526 KELCHNER RD; small business)
$1,000 with Army for Other Education and Training Services. Taking place in KS. Signed on 2003-02-18. Completion date: 2003-02-13.
Top industries in this zip code by the number of employees in 2005:
Educational Services: Colleges, Universities, and Professional Schools (500-999 employees: 1 establishment)
2004 - 2018 National Fire Incident Reporting System (NFIRS) incidents
According to the data from the years 2004 - 2018 the average number of fire incidents per year is 45. The highest number of reported fire incidents - 92 took place in 2004, and the least - 0 in 2008. The data has a decreasing trend.
When looking into fire subcategories, the most incidents belonged to: Structure Fires (59.0%), and Outside Fires (23.4%).
Fire incident types reported to NFIRS in Zip Code 18018


 Nearest zip codes: 18016, 18017, 18109, 18015, 18101, 18032.


 According to the data from the years 2004 - 2018 the average number of fire incidents per year is 45. The highest number of reported fire incidents - 92 took place in 2004, and the least - 0 in 2008. The data has a decreasing trend.
 When looking into fire subcategories, the most incidents belonged to: Structure Fires (59.0%), and Outside Fires (23.4%).