Estimated zip code population in 2022: 1,538 Zip code population in 2010: 943 Zip code population in 2000: 818
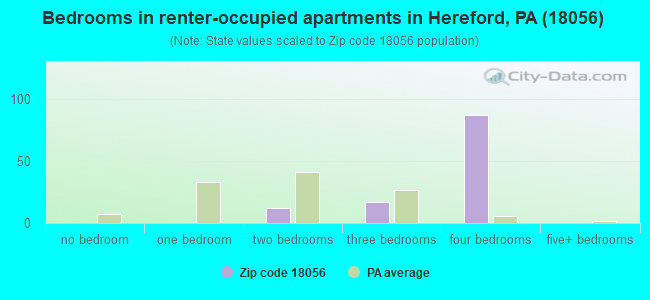
Houses and condos: 461 Renter-occupied apartments: 121
% of renters here:
28%
State:
31%
March 2022 cost of living index in zip code 18056: 94.8 (less than average, U.S. average is 100)
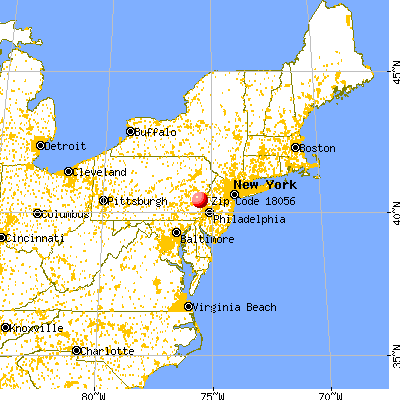
Land area: 1.7 sq. mi. Water area: 0.0 sq. mi.
Population density: 917 people per square mile
(low).
OSM Map
General Map
Google Map
MSN Map
OSM Map
General Map
Google Map
MSN Map
OSM Map
General Map
Google Map
MSN Map
OSM Map
General Map
Google Map
MSN Map
Please wait while loading the map...
Real estate property taxes paid for housing units in 2022:
This zip code:
1.8% ($600)
Pennsylvania:
1.3% ($3,094)
Median real estate property taxes paid for housing units with mortgages in 2022: $2,849 (1.1%) Median real estate property taxes paid for housing units with no mortgage in 2022: $526 (0.2%)
Business Search- 14 Million verified businesses
Males: 965
(62.7%)
Females: 573
(37.3%)
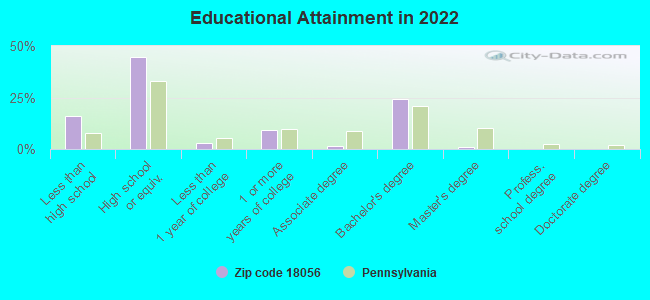
For population 25 years and over in 18056:
High school or higher: 81.6%
Bachelor's degree or higher: 24.8%
Graduate or professional degree: 1.1%
Unemployed: 1.9%
Mean travel time to work (commute): 38.2 minutes
For population 15 years and over in 18056:
Never married: 50.3%
Now married: 35.5%
Separated: 6.2%
Widowed: 2.3%
Divorced: 5.7%
Zip code 18056 compared to state average:
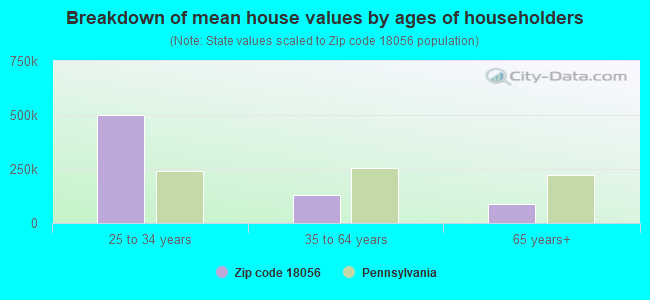
Median house value significantly below state average.
Unemployed percentage below state average.
Black race population percentage significantly below state average.
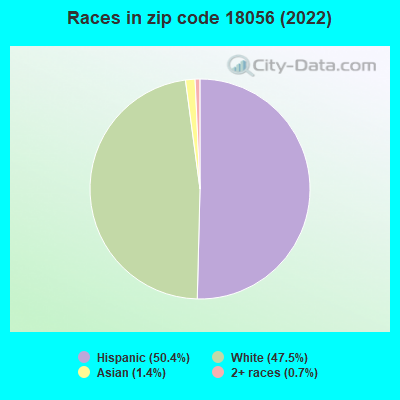
Hispanic race population percentage significantly above state average.
Median age significantly below state average.
Foreign-born population percentage significantly below state average.
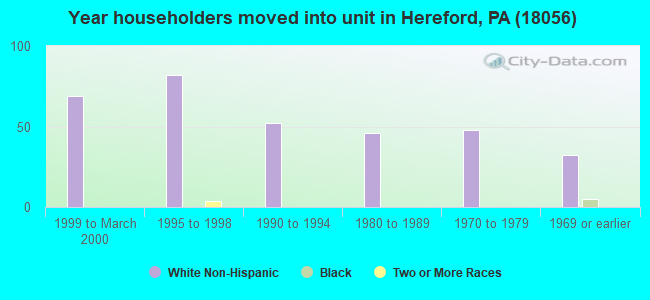
Length of stay since moving in significantly above state average.
Number of college students above state average.
Percentage of population with a bachelor's degree or higher below state average.
Estimated median house/condo value in 2022: $33,862
18056:
$33,862
Pennsylvania:
$245,500
According to our research of Pennsylvania and other state lists, there were 2 registered sex offenders living in 18056 zip code as of April 26, 2024. The ratio of all residents to sex offenders in zip code 18056 is 416 to 1.
Median resident age:
This zip code:
27.9 years
Pennsylvania median age:
40.9 years
Average household size:
This zip code:
3.6 people
Pennsylvania:
2.4 people
Averages for the 2020 tax year for zip code 18056, filed in 2021:
Average Adjusted Gross Income (AGI) in 2020: $54,292 (Individual Income Tax Returns)
Here:
$54,292
State:
$75,707
Salary/wage: $49,576 (reported on 83.7% of returns)
Here:
$49,576
State:
$62,806
(% of AGI for various income ranges: 990.0% for AGIs below $25k, 3490.8% for AGIs $25k-50k, 5821.7% for AGIs $50k-75k, 8686.7% for AGIs $75k-100k, 29170.0% for AGIs $100k-200k)
Taxable interest for individuals: $417 (reported on 24.5% of returns)
This zip code:
$417
Pennsylvania:
$1,633
(% of AGI for various income ranges: 2.3% for AGIs below $25k, 4.2% for AGIs $25k-50k, 6.7% for AGIs $50k-75k, 126.7% for AGIs $100k-200k)
Ordinary dividends: $1,500 (reported on 12.2% of returns)
Here:
$1,500
State:
$7,382
(% of AGI for various income ranges: 32.3% for AGIs below $25k, 160.0% for AGIs $75k-100k)
Net capital gain/loss in AGI: +$2,500 (reported on 10.2% of returns)
Here:
+$2,500
State:
+$23,522
(% of AGI for various income ranges: 10.0% for AGIs below $25k, 373.3% for AGIs $75k-100k)
Profit/loss from business: +$10,325 (reported on 8.2% of returns)
Here:
+$10,325
State:
+$16,274
(% of AGI for various income ranges: 344.2% for AGIs $25k-50k)
Taxable individual retirement arrangement distribution: $10,800 (reported on 8.2% of returns)
18056:
$10,800
Pennsylvania:
$18,583
(% of AGI for various income ranges: 360.0% for AGIs $25k-50k)
Earned income credit: $1,686 (reported on 14.3% of returns)
Here:
$1,686
State:
$2,100
(% of AGI for various income ranges: 90.8% for AGIs below $25k)
Percentage of individuals using paid preparers for their 2020 taxes: 95.9%
Here:
96%
State:
92%
(% for various income ranges: 88.9% for AGIs below $25k, 100.0% for AGIs $25k-50k, 100.0% for AGIs $50k-75k, 100.0% for AGIs $75k-100k, 100.0% for AGIs $100k-200k)
Averages for the 2012 tax year for zip code 18056, filed in 2013:
Average Adjusted Gross Income (AGI) in 2012: $38,158 (Individual Income Tax Returns)
Here:
$38,158
State:
$61,346
Salary/wage: $37,192 (reported on 83.3% of returns)
Here:
$37,192
State:
$51,902
(% of AGI for various income ranges: 70.8% for AGIs below $25k, 79.9% for AGIs $25k-50k, 82.7% for AGIs $50k-75k, 79.8% for AGIs $75k-100k, 88.5% for AGIs $100k-200k)
Taxable interest for individuals: $277 (reported on 27.1% of returns)
This zip code:
$277
Pennsylvania:
$1,588
(% of AGI for various income ranges: 0.6% for AGIs below $25k, 0.3% for AGIs $25k-50k, 0.2% for AGIs $50k-75k, 0.1% for AGIs $75k-100k)
Ordinary dividends: $583 (reported on 12.5% of returns)
Here:
$583
State:
$5,827
Net capital gain/loss in AGI: +$700 (reported on 8.3% of returns)
Here:
+$700
State:
+$14,495
Profit/loss from business: +$9,050 (reported on 8.3% of returns)
Here:
+$9,050
State:
+$16,268
Taxable individual retirement arrangement distribution: $10,525 (reported on 8.3% of returns)
18056:
$10,525
Pennsylvania:
$14,550
Total itemized deductions: $15,690 (21% of AGI, reported on 20.8% of returns)
Here:
$15,690
State:
$23,538
Here:
20.7% of AGI
State:
18.4% of AGI
(% of AGI for various income ranges: 12.5% for AGIs below $25k, 14.9% for AGIs $50k-75k, 15.0% for AGIs $100k-200k)
Charity contributions: $1,700 (reported on 12.5% of returns)
Here:
$1,700
State:
$4,025
Taxes paid: $6,833 (reported on 18.8% of returns)
18056:
$6,833
State:
$9,982
(% of AGI for various income ranges: 1.8% for AGIs below $25k, 5.7% for AGIs $50k-75k, 7.9% for AGIs $100k-200k)
Earned income credit: $1,756 (reported on 18.8% of returns)
Here:
$1,756
State:
$2,106
(% of AGI for various income ranges: 4.4% for AGIs below $25k, 0.9% for AGIs $25k-50k)
Percentage of individuals using paid preparers for their 2012 taxes: 54.2%
Here:
54%
State:
53%
(% for various income ranges: 47.6% for AGIs below $25k, 50.0% for AGIs $25k-50k, 71.4% for AGIs $50k-75k, 133.3% for AGIs $75k-100k)
Averages for the 2004 tax year for zip code 18056, filed in 2005:
Average Adjusted Gross Income (AGI) in 2004: $34,955 (Individual Income Tax Returns)
Here:
$34,955
State:
$48,049
Salary/wage: $33,143 (reported on 88.2% of returns)
Here:
$33,143
State:
$42,646
(% of AGI for various income ranges: 69.9% for AGIs below $10k, 70.4% for AGIs $10k-25k, 91.2% for AGIs $25k-50k, 94.0% for AGIs $50k-75k, 78.6% for AGIs $75k-100k, 71.7% for AGIs over 100k)
Taxable interest for individuals: $380 (reported on 33.1% of returns)
This zip code:
$380
Pennsylvania:
$1,657
(% of AGI for various income ranges: 0.8% for AGIs below $10k, 1.6% for AGIs $10k-25k, 0.1% for AGIs $25k-50k, 0.2% for AGIs $50k-75k, 0.1% for AGIs $75k-100k, 0.1% for AGIs over 100k)
Taxable dividends: $750 (reported on 15.4% of returns)
Here:
$750
State:
$3,566
(% of AGI for various income ranges: 0.4% for AGIs below $10k, 0.6% for AGIs $10k-25k, 0.2% for AGIs $25k-50k, 0.2% for AGIs $75k-100k, 1.0% for AGIs over 100k)
Net capital gain/loss: +$1,269 (reported on 10.6% of returns)
Here:
+$1,269
State:
+$9,716
Profit/loss from business: +$8,151 (reported on 10.8% of returns)
Here:
+$8,151
State:
+$14,267
(% of AGI for various income ranges: 7.5% for AGIs below $10k, 13.3% for AGIs $10k-25k, 1.3% for AGIs $25k-50k, 0.6% for AGIs $50k-75k)
Total itemized deductions: $15,379 (23% of AGI, reported on 17.7% of returns)
Here:
$15,379
State:
$18,804
Here:
22.8% of AGI
State:
19.5% of AGI
(% of AGI for various income ranges: 17.1% for AGIs below $10k, 4.5% for AGIs $25k-50k, 8.5% for AGIs $50k-75k, 10.5% for AGIs $75k-100k, 15.3% for AGIs over 100k)
Charity contributions deductions: $1,247 (2% of AGI, reported on 14.8% of returns)
Here:
$1,247
State:
$3,337
Here:
1.8% of AGI
State:
3.3% of AGI
(% of AGI for various income ranges: 0.4% for AGIs $25k-50k, 0.5% for AGIs $50k-75k, 0.8% for AGIs $75k-100k, 1.1% for AGIs over 100k)
Total tax: $4,053 (reported on 76.2% of returns)
18056:
$4,053
State:
$8,008
(% of AGI for various income ranges: 2.2% for AGIs below $10k, 5.3% for AGIs $10k-25k, 7.1% for AGIs $25k-50k, 8.7% for AGIs $50k-75k, 10.3% for AGIs $75k-100k, 15.3% for AGIs over 100k)
Earned income credit: $1,377 (reported on 15.7% of returns)
Here:
$1,377
State:
$1,643
Percentage of individuals using paid preparers for their 2004 taxes: 57.5%
Here:
58%
State:
56%
(% for various income ranges: 43.5% for AGIs below $10k, 55.7% for AGIs $10k-25k, 61.9% for AGIs $25k-50k, 69.7% for AGIs $50k-75k, 57.1% for AGIs $75k-100k, 60.0% for AGIs over 100k)
Household received Food Stamps/SNAP in the past 12 months: 45 Household did not receive Food Stamps/SNAP in the past 12 months: 382
Women who did not have a birth in the past 12 months: 234 (179 now married, 52 unmarried)
Housing units in zip code 18056 with a mortgage: 92 (16 second mortgage, 16 both second mortgage and home equity loan) Median monthly owner costs for units with a mortgage: $1,772 Median monthly owner costs for units without a mortgage: $961
Residents with income below the poverty level in 2022:
This zip code:
6.9%
Whole state:
11.8%
Residents with income below 50% of the poverty level in 2022:
This zip code:
6.5%
Whole state:
6.1%
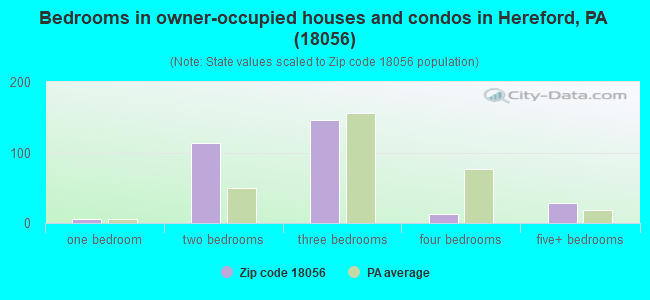
Median number of rooms in houses and condos:
Here:
5.0
State:
6.8
Median number of rooms in apartments:
Here:
6.8
State:
4.3
Notable locations in this zip code not listed on our city pages
Size of family households: 135 2-persons, 78 3-persons, 9 4-persons, 9 6-persons, 94 7-or-more-persons
Size of nonfamily households: 102 1-person
60 married couples with children.
182 single-parent households (182 women).
95.1% of residents of 18056 zip code speak English at home.
2.8% of residents speak Spanish at home (19% very well, 28% well, 12% not well, 42% not at all).
1.3% of residents speak other Indo-European language at home (30% very well, 45% well, 25% not well).
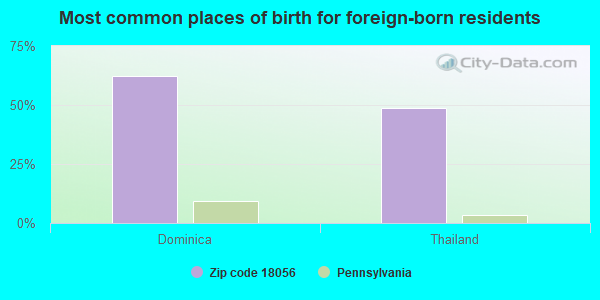
Foreign born population: 46 (3.0%) (75.8% of them are naturalized citizens)
This zip code:
3.0%
Whole state:
7.5%
62%Dominica
49%Thailand
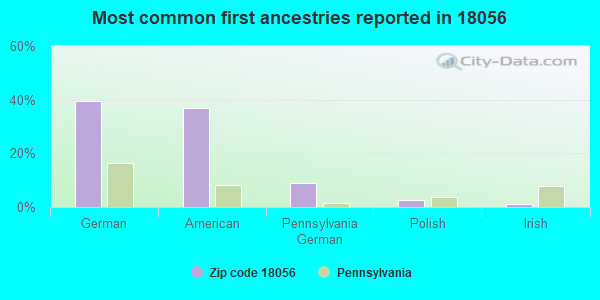
39%German
37%American
9%Pennsylvania German
3%Polish
1%Irish
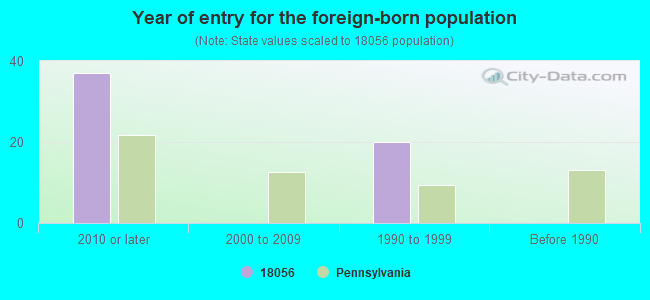
Year of entry for the foreign-born population
372010 or later
02000 to 2009
201990 to 1999
0Before 1990
Facilities with environmental interests located in this zip code:
BENNETT BUICK PONTIAC (RT 29 1 MI S OF RT 100 in HEREFORD, PA)
(Integrated Compliance Information System) - ICIS-03-1996-0311, FORMAL ENFORCEMENT ACTION Small Quantity Generators, between 100 kg and 1000 kg of hazardous waste/month (Resource Conservation and Recovery Act (tracking hazardous waste)) - notification Organizations: BENNETT JOSEPH (CONTACT/OWNER)
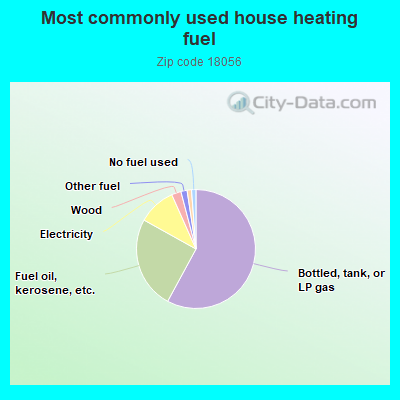
58.2%Bottled, tank, or LP gas
25.3%Fuel oil, kerosene, etc.
10.3%Electricity
2.6%Wood
1.7%Other fuel
1.2%Utility gas
1.2%No fuel used
Population in 1990: 3,026.
Place of birth for U.S.-born residents:
This state: 606
Northeast: 698
Midwest: 5
South: 93
West: 103
59% of the 18056 zip code residents lived in the same house 5 years ago. Out of people who lived in different houses, 29% lived in this county. Out of people who lived in different counties, 50% lived in Pennsylvania.
96% of the 18056 zip code residents lived in the same house 1 year ago. Out of people who lived in different houses, 74% moved from this county. Out of people who lived in different houses, 29% moved from different county within same state.
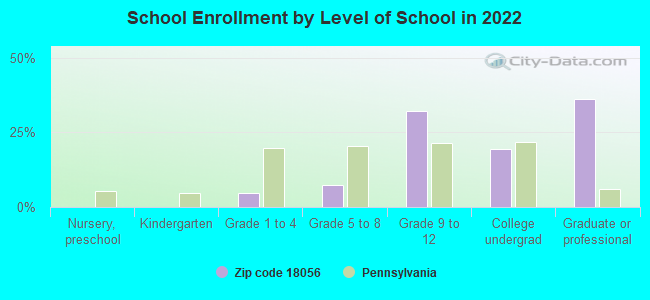
Private vs. public school enrollment:
Students in private schools in grades 1 to 8 (elementary and middle school):
Here:
0.0%
Pennsylvania:
15.7%
Students in private schools in grades 9 to 12 (high school): 7
Here:
6.0%
Pennsylvania:
13.4%
Students in private undergraduate colleges: 18
Here:
25.7%
Pennsylvania:
39.8%
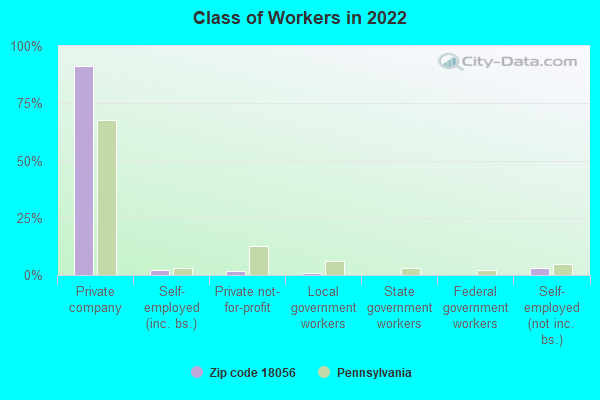
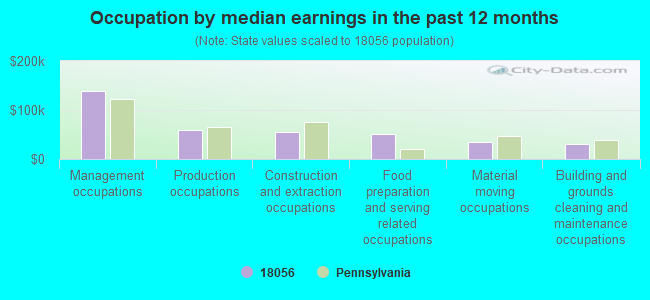
Occupation by median earnings in the past 12 months ($)
139,100Management occupations
59,910Production occupations
55,710Construction and extraction occupations
50,876Food preparation and serving related occupations
34,921Material moving occupations
30,013Building and grounds cleaning and maintenance occupations
Top industries in this zip code by the number of employees in 2005:
Construction: New Single-Family Housing Construction (except Operative Builders) (1-4 employees: 1 establishment)
Wholesale Trade: Wholesale Trade Agents and Brokers (1-4: 1)
Accommodation and Food Services: Limited-Service Restaurants (1-4: 1)
Fatal accident statistics in 2013:
Fatal accident count: 1
Vehicles involved in fatal accidents: 2
Fatal accidents caused by drunken drivers: 1
Fatalities: 1
Persons involved in fatal accidents: 2
Pedestrians involved in fatal accidents: 0
Home Mortgage Disclosure Act Aggregated Statistics For Year 2009 (Based on 2 partial tracts)
A) FHA, FSA/RHS & VA Home Purchase Loans
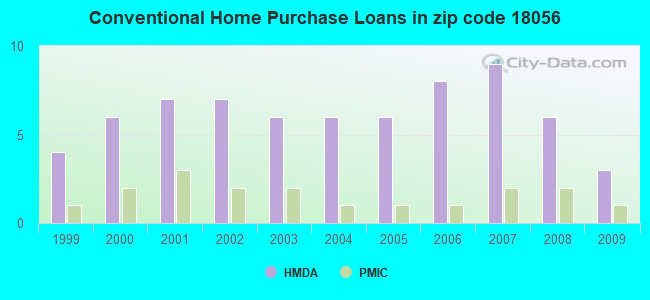
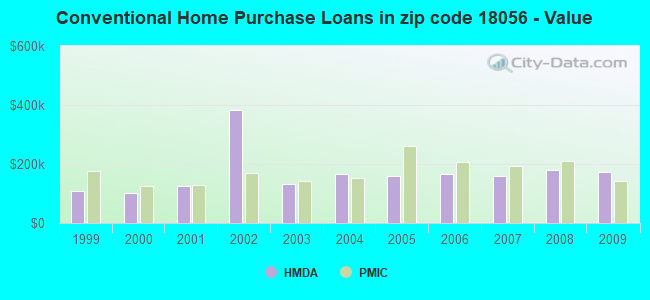
B) Conventional Home Purchase Loans
C) Refinancings
D) Home Improvement Loans
F) Non-occupant Loans on < 5 Family Dwellings (A B C & D)
G) Loans On Manufactured Home Dwelling (A B C & D)
Number
Average Value
Number
Average Value
Number
Average Value
Number
Average Value
Number
Average Value
Number
Average Value
LOANS ORIGINATED
2
$236,220
3
$171,577
14
$173,099
2
$81,675
0
$0
1
$57,080
APPLICATIONS APPROVED, NOT ACCEPTED
0
$0
0
$0
1
$116,890
0
$0
0
$0
1
$54,210
APPLICATIONS DENIED
0
$0
2
$96,715
6
$166,110
0
$0
1
$64,330
1
$117,460
APPLICATIONS WITHDRAWN
1
$97,500
1
$86,380
3
$197,210
0
$0
0
$0
0
$0
FILES CLOSED FOR INCOMPLETENESS
0
$0
0
$0
1
$148,840
0
$0
0
$0
0
$0
Aggregated Statistics For Year 2008 (Based on 2 partial tracts)
A) FHA, FSA/RHS & VA Home Purchase Loans
B) Conventional Home Purchase Loans
C) Refinancings
D) Home Improvement Loans
F) Non-occupant Loans on < 5 Family Dwellings (A B C & D)
G) Loans On Manufactured Home Dwelling (A B C & D)
Number
Average Value
Number
Average Value
Number
Average Value
Number
Average Value
Number
Average Value
Number
Average Value
LOANS ORIGINATED
2
$158,500
6
$179,057
8
$170,158
2
$43,330
1
$82,280
1
$113,010
APPLICATIONS APPROVED, NOT ACCEPTED
0
$0
1
$176,270
1
$271,980
0
$0
0
$0
1
$56,510
APPLICATIONS DENIED
0
$0
1
$91,620
6
$162,915
1
$62,970
0
$0
1
$64,620
APPLICATIONS WITHDRAWN
0
$0
1
$153,150
2
$230,515
0
$0
0
$0
0
$0
FILES CLOSED FOR INCOMPLETENESS
0
$0
0
$0
1
$148,700
0
$0
0
$0
0
$0
Aggregated Statistics For Year 2007 (Based on 2 partial tracts)
B) Conventional Home Purchase Loans
C) Refinancings
D) Home Improvement Loans
F) Non-occupant Loans on < 5 Family Dwellings (A B C & D)
G) Loans On Manufactured Home Dwelling (A B C & D)
Number
Average Value
Number
Average Value
Number
Average Value
Number
Average Value
Number
Average Value
LOANS ORIGINATED
9
$158,909
11
$163,972
5
$66,458
1
$253,810
2
$45,735
APPLICATIONS APPROVED, NOT ACCEPTED
2
$134,160
2
$185,890
1
$79,480
0
$0
1
$83,650
APPLICATIONS DENIED
2
$149,380
8
$200,780
2
$114,270
1
$136,990
1
$124,140
APPLICATIONS WITHDRAWN
1
$186,900
3
$200,297
1
$67,060
0
$0
0
$0
FILES CLOSED FOR INCOMPLETENESS
0
$0
1
$217,120
0
$0
0
$0
0
$0
Aggregated Statistics For Year 2006 (Based on 2 partial tracts)
B) Conventional Home Purchase Loans
C) Refinancings
D) Home Improvement Loans
F) Non-occupant Loans on < 5 Family Dwellings (A B C & D)
G) Loans On Manufactured Home Dwelling (A B C & D)
Number
Average Value
Number
Average Value
Number
Average Value
Number
Average Value
Number
Average Value
LOANS ORIGINATED
8
$165,975
13
$134,713
5
$49,298
1
$154,230
1
$63,830
APPLICATIONS APPROVED, NOT ACCEPTED
0
$0
2
$166,035
1
$29,150
0
$0
0
$0
APPLICATIONS DENIED
1
$266,810
7
$168,536
1
$138,720
0
$0
0
$0
APPLICATIONS WITHDRAWN
1
$139,440
6
$164,482
0
$0
0
$0
0
$0
FILES CLOSED FOR INCOMPLETENESS
0
$0
1
$156,160
0
$0
0
$0
0
$0
Aggregated Statistics For Year 2005 (Based on 2 partial tracts)
B) Conventional Home Purchase Loans
C) Refinancings
D) Home Improvement Loans
F) Non-occupant Loans on < 5 Family Dwellings (A B C & D)
G) Loans On Manufactured Home Dwelling (A B C & D)
Number
Average Value
Number
Average Value
Number
Average Value
Number
Average Value
Number
Average Value
LOANS ORIGINATED
6
$158,307
18
$129,168
4
$60,132
1
$91,110
1
$60,810
APPLICATIONS APPROVED, NOT ACCEPTED
1
$81,920
3
$104,710
1
$29,010
0
$0
0
$0
APPLICATIONS DENIED
2
$94,990
7
$175,449
2
$35,865
0
$0
1
$59,810
APPLICATIONS WITHDRAWN
1
$51,120
5
$155,604
0
$0
0
$0
0
$0
FILES CLOSED FOR INCOMPLETENESS
0
$0
3
$149,893
0
$0
0
$0
0
$0
Aggregated Statistics For Year 2004 (Based on 2 partial tracts)
B) Conventional Home Purchase Loans
C) Refinancings
D) Home Improvement Loans
F) Non-occupant Loans on < 5 Family Dwellings (A B C & D)
G) Loans On Manufactured Home Dwelling (A B C & D)
Number
Average Value
Number
Average Value
Number
Average Value
Number
Average Value
Number
Average Value
LOANS ORIGINATED
6
$165,918
18
$132,822
3
$60,240
1
$89,390
0
$0
APPLICATIONS APPROVED, NOT ACCEPTED
1
$160,900
4
$103,248
1
$17,090
0
$0
1
$30,010
APPLICATIONS DENIED
1
$149,490
8
$158,688
2
$52,270
0
$0
1
$38,340
APPLICATIONS WITHDRAWN
1
$173,610
7
$125,569
1
$24,480
0
$0
0
$0
FILES CLOSED FOR INCOMPLETENESS
0
$0
1
$207,140
0
$0
0
$0
0
$0
Aggregated Statistics For Year 2003 (Based on 2 partial tracts)
A) FHA, FSA/RHS & VA Home Purchase Loans
B) Conventional Home Purchase Loans
C) Refinancings
D) Home Improvement Loans
F) Non-occupant Loans on < 5 Family Dwellings (A B C & D)
Number
Average Value
Number
Average Value
Number
Average Value
Number
Average Value
Number
Average Value
LOANS ORIGINATED
1
$84,870
6
$133,045
33
$120,598
4
$38,450
1
$98,010
APPLICATIONS APPROVED, NOT ACCEPTED
0
$0
1
$195,510
6
$97,815
1
$30,300
0
$0
APPLICATIONS DENIED
0
$0
2
$51,805
9
$128,761
2
$17,880
0
$0
APPLICATIONS WITHDRAWN
0
$0
1
$168,950
8
$133,611
0
$0
0
$0
FILES CLOSED FOR INCOMPLETENESS
0
$0
0
$0
1
$108,850
0
$0
0
$0
Aggregated Statistics For Year 2002 (Based on 2 partial tracts)
A) FHA, FSA/RHS & VA Home Purchase Loans
B) Conventional Home Purchase Loans
C) Refinancings
D) Home Improvement Loans
F) Non-occupant Loans on < 5 Family Dwellings (A B C & D)
Number
Average Value
Number
Average Value
Number
Average Value
Number
Average Value
Number
Average Value
LOANS ORIGINATED
1
$70,080
7
$382,447
19
$111,883
4
$35,058
1
$79,270
APPLICATIONS APPROVED, NOT ACCEPTED
0
$0
0
$0
2
$111,795
1
$63,180
0
$0
APPLICATIONS DENIED
0
$0
2
$71,835
6
$78,155
1
$13,500
0
$0
APPLICATIONS WITHDRAWN
0
$0
0
$0
4
$134,878
0
$0
0
$0
FILES CLOSED FOR INCOMPLETENESS
0
$0
0
$0
1
$56,580
0
$0
0
$0
Aggregated Statistics For Year 2001 (Based on 2 partial tracts)
A) FHA, FSA/RHS & VA Home Purchase Loans
B) Conventional Home Purchase Loans
C) Refinancings
D) Home Improvement Loans
Number
Average Value
Number
Average Value
Number
Average Value
Number
Average Value
LOANS ORIGINATED
1
$103,460
7
$124,501
12
$102,668
3
$29,990
APPLICATIONS APPROVED, NOT ACCEPTED
0
$0
2
$78,045
2
$67,240
1
$19,530
APPLICATIONS DENIED
0
$0
3
$50,570
4
$99,748
2
$19,600
APPLICATIONS WITHDRAWN
0
$0
0
$0
2
$190,200
1
$11,850
FILES CLOSED FOR INCOMPLETENESS
0
$0
0
$0
0
$0
0
$0
Aggregated Statistics For Year 2000 (Based on 2 partial tracts)
A) FHA, FSA/RHS & VA Home Purchase Loans
B) Conventional Home Purchase Loans
C) Refinancings
D) Home Improvement Loans
F) Non-occupant Loans on < 5 Family Dwellings (A B C & D)
Number
Average Value
Number
Average Value
Number
Average Value
Number
Average Value
Number
Average Value
LOANS ORIGINATED
1
$138,220
6
$100,017
5
$75,246
4
$21,935
1
$44,370
APPLICATIONS APPROVED, NOT ACCEPTED
0
$0
1
$92,690
1
$87,450
1
$12,920
0
$0
APPLICATIONS DENIED
0
$0
5
$31,118
3
$147,763
2
$20,175
0
$0
APPLICATIONS WITHDRAWN
0
$0
1
$74,960
2
$144,245
0
$0
0
$0
FILES CLOSED FOR INCOMPLETENESS
0
$0
0
$0
0
$0
0
$0
0
$0
Aggregated Statistics For Year 1999 (Based on 1 partial tract)
Detailed PMIC statistics for the following Tracts:0133.00
2003 - 2018 National Fire Incident Reporting System (NFIRS) incidents
According to the data from the years 2003 - 2018 the average number of fire incidents per year is 10. The highest number of reported fire incidents - 19 took place in 2005, and the least - 0 in 2011. The data has a decreasing trend.
When looking into fire subcategories, the most incidents belonged to: Structure Fires (57.1%), and Outside Fires (27.9%).
Fire incident types reported to NFIRS in Zip Code 18056


 Nearest zip codes: 18070, 18092, 18068, 19503, 18041, 19504.


 According to the data from the years 2003 - 2018 the average number of fire incidents per year is 10. The highest number of reported fire incidents - 19 took place in 2005, and the least - 0 in 2011. The data has a decreasing trend.
 When looking into fire subcategories, the most incidents belonged to: Structure Fires (57.1%), and Outside Fires (27.9%).