Estimated zip code population in 2022: 51,571 Zip code population in 2010: 49,779 Zip code population in 2000: 42,418
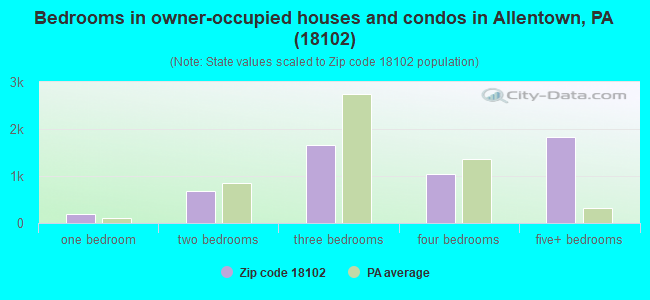
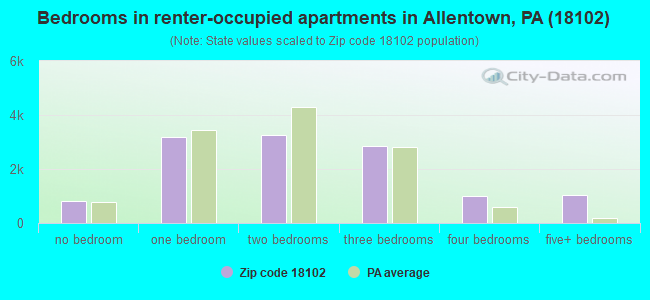
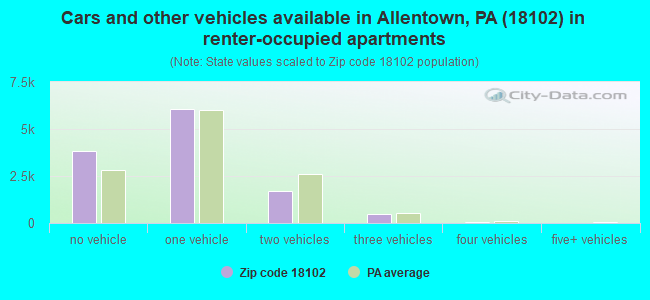
Houses and condos: 19,293 Renter-occupied apartments: 12,193
% of renters here:
69%
State:
31%
March 2022 cost of living index in zip code 18102: 99.1 (near average, U.S. average is 100)
Land area: 3.0 sq. mi. Water area: 0.1 sq. mi.
Population density: 17,208 people per square mile
(very high).
OSM Map
General Map
Google Map
MSN Map
OSM Map
General Map
Google Map
MSN Map
OSM Map
General Map
Google Map
MSN Map
OSM Map
General Map
Google Map
MSN Map
Please wait while loading the map...
Real estate property taxes paid for housing units in 2022:
This zip code:
2.0% ($2,880)
Pennsylvania:
1.3% ($3,094)
Median real estate property taxes paid for housing units with mortgages in 2022: $2,846 (1.9%) Median real estate property taxes paid for housing units with no mortgage in 2022: $3,040 (2.1%)
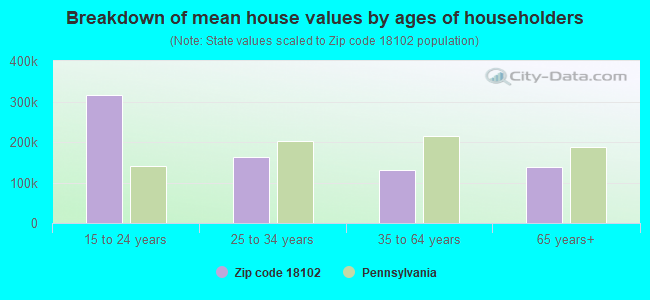
Estimated median house/condo value in 2022: $147,495
18102:
$147,495
Pennsylvania:
$245,500
According to our research of Pennsylvania and other state lists, there were 98 registered sex offenders living in 18102 zip code as of April 27, 2024. The ratio of all residents to sex offenders in zip code 18102 is 504 to 1. The ratio of registered sex offenders to all residents in this zip code is near the state average.
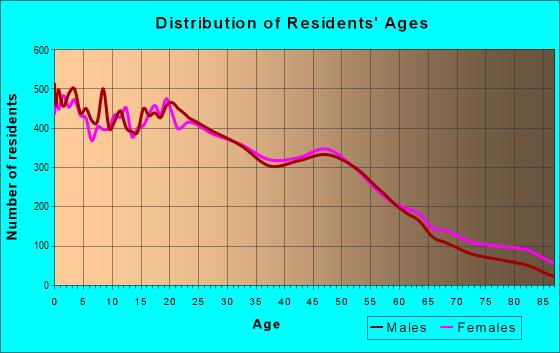
Median resident age:
This zip code:
30.6 years
Pennsylvania median age:
40.9 years
Average household size:
This zip code:
2.9 people
Pennsylvania:
2.4 people
Averages for the 2020 tax year for zip code 18102, filed in 2021:
Average Adjusted Gross Income (AGI) in 2020: $30,986 (Individual Income Tax Returns)
Here:
$30,986
State:
$75,707
Salary/wage: $27,981 (reported on 86.2% of returns)
Here:
$27,981
State:
$62,806
(% of AGI for various income ranges: 1064.4% for AGIs below $25k, 3316.8% for AGIs $25k-50k, 6431.4% for AGIs $50k-75k, 9430.6% for AGIs $75k-100k, 15635.4% for AGIs $100k-200k)
Taxable interest for individuals: $479 (reported on 7.8% of returns)
This zip code:
$479
Pennsylvania:
$1,633
(% of AGI for various income ranges: 2.4% for AGIs below $25k, 1.6% for AGIs $25k-50k, 6.0% for AGIs $50k-75k, 35.1% for AGIs $75k-100k, 52.7% for AGIs $100k-200k)
Ordinary dividends: $5,017 (reported on 3.0% of returns)
Here:
$5,017
State:
$7,382
(% of AGI for various income ranges: 4.1% for AGIs below $25k, 2.9% for AGIs $25k-50k, 19.5% for AGIs $50k-75k, 91.1% for AGIs $75k-100k, 273.1% for AGIs $100k-200k)
Net capital gain/loss in AGI: +$6,633 (reported on 2.9% of returns)
Here:
+$6,633
State:
+$23,522
(% of AGI for various income ranges: 1.4% for AGIs below $25k, 4.2% for AGIs $25k-50k, 24.6% for AGIs $50k-75k, 94.2% for AGIs $75k-100k, 380.0% for AGIs $100k-200k)
Profit/loss from business: +$4,628 (reported on 12.0% of returns)
Here:
+$4,628
State:
+$16,274
(% of AGI for various income ranges: 66.4% for AGIs below $25k, 35.4% for AGIs $25k-50k, 72.2% for AGIs $50k-75k, 222.8% for AGIs $75k-100k, 765.8% for AGIs $100k-200k)
Taxable individual retirement arrangement distribution: $10,998 (reported on 2.0% of returns)
18102:
$10,998
Pennsylvania:
$18,583
(% of AGI for various income ranges: 9.1% for AGIs below $25k, 10.1% for AGIs $25k-50k, 55.4% for AGIs $50k-75k, 184.9% for AGIs $75k-100k, 613.1% for AGIs $100k-200k)
Total itemized deductions: $25,341 (reported on 1.6% of returns)
Here:
$25,341
State:
$34,850
(% of AGI for various income ranges: 9.2% for AGIs below $25k, 30.9% for AGIs $25k-50k, 121.0% for AGIs $50k-75k, 260.0% for AGIs $75k-100k, 1030.0% for AGIs $100k-200k)
Charity contributions: $8,096 (reported on 1.0% of returns)
Here:
$8,096
State:
$12,392
(% of AGI for various income ranges: 7.6% for AGIs $25k-50k, 23.3% for AGIs $50k-75k, 48.7% for AGIs $75k-100k, 260.4% for AGIs $100k-200k)
Taxes paid: $6,570 (reported on 1.5% of returns)
18102:
$6,570
State:
$8,200
(% of AGI for various income ranges: 1.6% for AGIs below $25k, 6.0% for AGIs $25k-50k, 36.8% for AGIs $50k-75k, 90.2% for AGIs $75k-100k, 221.9% for AGIs $100k-200k)
Earned income credit: $2,504 (reported on 37.2% of returns)
Here:
$2,504
State:
$2,100
(% of AGI for various income ranges: 149.1% for AGIs below $25k, 107.3% for AGIs $25k-50k, 1.3% for AGIs $50k-75k)
Percentage of individuals using paid preparers for their 2020 taxes: 93.8%
Here:
94%
State:
92%
(% for various income ranges: 92.3% for AGIs below $25k, 95.4% for AGIs $25k-50k, 95.2% for AGIs $50k-75k, 93.2% for AGIs $75k-100k, 90.9% for AGIs $100k-200k, 100.0% for AGIs over 200k)
Averages for the 2012 tax year for zip code 18102, filed in 2013:
Average Adjusted Gross Income (AGI) in 2012: $23,897 (Individual Income Tax Returns)
Here:
$23,897
State:
$61,346
Salary/wage: $22,628 (reported on 87.4% of returns)
Here:
$22,628
State:
$51,902
(% of AGI for various income ranges: 77.6% for AGIs below $25k, 90.3% for AGIs $25k-50k, 85.6% for AGIs $50k-75k, 79.3% for AGIs $75k-100k, 88.1% for AGIs $100k-200k)
Taxable interest for individuals: $718 (reported on 10.4% of returns)
This zip code:
$718
Pennsylvania:
$1,588
(% of AGI for various income ranges: 0.3% for AGIs below $25k, 0.1% for AGIs $25k-50k, 0.5% for AGIs $50k-75k, 0.5% for AGIs $75k-100k, 1.1% for AGIs $100k-200k)
Ordinary dividends: $2,876 (reported on 5.2% of returns)
Here:
$2,876
State:
$5,827
(% of AGI for various income ranges: 0.4% for AGIs below $25k, 0.2% for AGIs $25k-50k, 0.7% for AGIs $50k-75k, 1.8% for AGIs $75k-100k, 3.7% for AGIs $100k-200k)
Net capital gain/loss in AGI: +$755 (reported on 3.0% of returns)
Here:
+$755
State:
+$14,495
(% of AGI for various income ranges: 1.5% for AGIs $100k-200k)
Profit/loss from business: +$8,303 (reported on 11.4% of returns)
Here:
+$8,303
State:
+$16,268
(% of AGI for various income ranges: 9.2% for AGIs below $25k, 1.6% for AGIs $25k-50k, 1.0% for AGIs $50k-75k, 1.5% for AGIs $75k-100k, 1.7% for AGIs $100k-200k)
Taxable individual retirement arrangement distribution: $8,377 (reported on 3.5% of returns)
18102:
$8,377
Pennsylvania:
$14,550
(% of AGI for various income ranges: 0.9% for AGIs below $25k, 0.7% for AGIs $25k-50k, 1.6% for AGIs $50k-75k, 2.7% for AGIs $75k-100k, 4.2% for AGIs $100k-200k)
Total itemized deductions: $14,236 (29% of AGI, reported on 11.8% of returns)
Here:
$14,236
State:
$23,538
Here:
28.9% of AGI
State:
18.4% of AGI
(% of AGI for various income ranges: 3.5% for AGIs below $25k, 7.3% for AGIs $25k-50k, 10.5% for AGIs $50k-75k, 11.1% for AGIs $75k-100k, 14.6% for AGIs $100k-200k)
Charity contributions: $2,121 (reported on 7.2% of returns)
Here:
$2,121
State:
$4,025
(% of AGI for various income ranges: 0.2% for AGIs below $25k, 0.6% for AGIs $25k-50k, 0.9% for AGIs $50k-75k, 1.3% for AGIs $75k-100k, 2.3% for AGIs $100k-200k)
Taxes paid: $4,486 (reported on 11.7% of returns)
18102:
$4,486
State:
$9,982
(% of AGI for various income ranges: 0.9% for AGIs below $25k, 1.9% for AGIs $25k-50k, 3.6% for AGIs $50k-75k, 4.2% for AGIs $75k-100k, 5.0% for AGIs $100k-200k, 4.3% for AGIs over 200k)
Earned income credit: $2,619 (reported on 46.3% of returns)
Here:
$2,619
State:
$2,106
(% of AGI for various income ranges: 12.7% for AGIs below $25k, 2.3% for AGIs $25k-50k)
Percentage of individuals using paid preparers for their 2012 taxes: 63.3%
Here:
63%
State:
53%
(% for various income ranges: 63.7% for AGIs below $25k, 63.7% for AGIs $25k-50k, 60.5% for AGIs $50k-75k, 57.9% for AGIs $75k-100k, 66.7% for AGIs $100k-200k)
Averages for the 2004 tax year for zip code 18102, filed in 2005:
Average Adjusted Gross Income (AGI) in 2004: $22,808 (Individual Income Tax Returns)
Here:
$22,808
State:
$48,049
Salary/wage: $21,936 (reported on 89.5% of returns)
Here:
$21,936
State:
$42,646
(% of AGI for various income ranges: 85.0% for AGIs below $10k, 86.2% for AGIs $10k-25k, 90.8% for AGIs $25k-50k, 86.9% for AGIs $50k-75k, 85.1% for AGIs $75k-100k, 57.8% for AGIs over 100k)
Taxable interest for individuals: $1,108 (reported on 20.2% of returns)
This zip code:
$1,108
Pennsylvania:
$1,657
(% of AGI for various income ranges: 2.1% for AGIs below $10k, 0.8% for AGIs $10k-25k, 0.6% for AGIs $25k-50k, 0.8% for AGIs $50k-75k, 1.0% for AGIs $75k-100k, 2.9% for AGIs over 100k)
Taxable dividends: $2,639 (reported on 9.5% of returns)
Here:
$2,639
State:
$3,566
(% of AGI for various income ranges: 1.7% for AGIs below $10k, 0.6% for AGIs $10k-25k, 0.5% for AGIs $25k-50k, 1.0% for AGIs $50k-75k, 0.8% for AGIs $75k-100k, 6.9% for AGIs over 100k)
Net capital gain/loss: +$4,762 (reported on 6.5% of returns)
Here:
+$4,762
State:
+$9,716
(% of AGI for various income ranges: -0.4% for AGIs below $10k, 0.2% for AGIs $10k-25k, 0.4% for AGIs $25k-50k, 0.8% for AGIs $50k-75k, 1.8% for AGIs $75k-100k, 15.1% for AGIs over 100k)
Profit/loss from business: +$7,552 (reported on 8.0% of returns)
Here:
+$7,552
State:
+$14,267
(% of AGI for various income ranges: 6.4% for AGIs below $10k, 3.5% for AGIs $10k-25k, 1.5% for AGIs $25k-50k, 1.5% for AGIs $50k-75k, 2.5% for AGIs $75k-100k, 4.6% for AGIs over 100k)
IRA payment deduction: $1,995 (reported on 1.1% of returns)
18102:
$1,995
Pennsylvania:
$2,903
(% of AGI for various income ranges: 0.1% for AGIs below $10k, 0.1% for AGIs $10k-25k, 0.1% for AGIs $25k-50k, 0.1% for AGIs $50k-75k, 0.2% for AGIs $75k-100k)
Self-employed pension: $11,000 (reported on 0.1% of returns)
Here:
$11,000
Pennsylvania:
$14,674
Total itemized deductions: $12,876 (27% of AGI, reported on 12.8% of returns)
Here:
$12,876
State:
$18,804
Here:
27.1% of AGI
State:
19.5% of AGI
(% of AGI for various income ranges: 5.9% for AGIs below $10k, 4.1% for AGIs $10k-25k, 7.1% for AGIs $25k-50k, 9.9% for AGIs $50k-75k, 11.8% for AGIs $75k-100k, 11.3% for AGIs over 100k)
Charity contributions deductions: $1,887 (4% of AGI, reported on 9.9% of returns)
Here:
$1,887
State:
$3,337
Here:
3.7% of AGI
State:
3.3% of AGI
(% of AGI for various income ranges: 0.2% for AGIs below $10k, 0.3% for AGIs $10k-25k, 0.7% for AGIs $25k-50k, 1.2% for AGIs $50k-75k, 1.9% for AGIs $75k-100k, 2.2% for AGIs over 100k)
Total tax: $2,812 (reported on 53.1% of returns)
18102:
$2,812
State:
$8,008
(% of AGI for various income ranges: 1.6% for AGIs below $10k, 3.0% for AGIs $10k-25k, 6.3% for AGIs $25k-50k, 9.1% for AGIs $50k-75k, 11.2% for AGIs $75k-100k, 17.7% for AGIs over 100k)
Earned income credit: $2,022 (reported on 40.2% of returns)
Here:
$2,022
State:
$1,643
Percentage of individuals using paid preparers for their 2004 taxes: 66.9%
Here:
67%
State:
56%
(% for various income ranges: 68.3% for AGIs below $10k, 70.6% for AGIs $10k-25k, 62.5% for AGIs $25k-50k, 59.2% for AGIs $50k-75k, 52.2% for AGIs $75k-100k, 59.8% for AGIs over 100k)
Likely homosexual households (counted as self-reported same-sex unmarried-partner households)
Lesbian couples: 0.1% of all households
Gay men: 0.1% of all households
Household received Food Stamps/SNAP in the past 12 months: 8,279 Household did not receive Food Stamps/SNAP in the past 12 months: 9,632
Women who had a birth in the past 12 months: 790 (164 now married, 544 unmarried) Women who did not have a birth in the past 12 months: 12,459 (3,700 now married, 8,802 unmarried)
Housing units in zip code 18102 with a mortgage: 3,634 (378 second mortgage, 5 home equity loan, 291 both second mortgage and home equity loan) Houses without a mortgage: 143
Median monthly owner costs for units with a mortgage: $1,139 Median monthly owner costs for units without a mortgage: $627
Residents with income below the poverty level in 2022:
This zip code:
29.1%
Whole state:
11.8%
Residents with income below 50% of the poverty level in 2022:
This zip code:
18.0%
Whole state:
6.1%
Median number of rooms in houses and condos:
Here:
6.9
State:
6.8
Median number of rooms in apartments:
Here:
4.5
State:
4.3
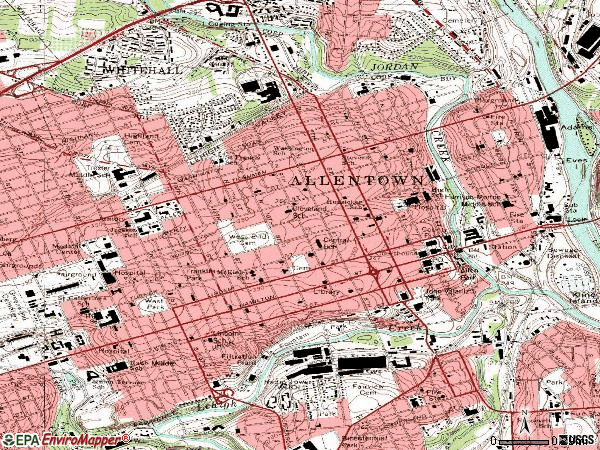
Notable locations in this zip code not listed on our city pages
Notable locations in zip code 18102: Lehigh Valley Dairies (A), Allentown Emergency Medical Services / Central Fire Department (B), Hibernia Fire Station (C), Little Lehigh Manor (D). Display/hide their locations on the map
4,494 married couples with children.
7,683 single-parent households (921 men, 6,762 women).
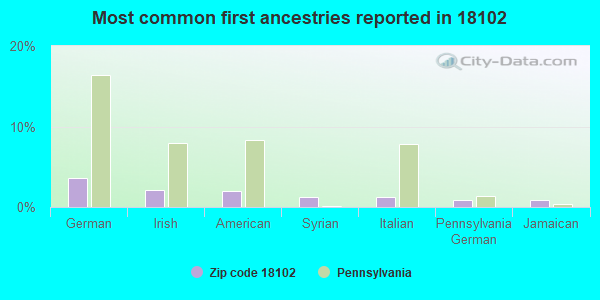
44.6% of residents of 18102 zip code speak English at home.
56.7% of residents speak Spanish at home (37% very well, 28% well, 21% not well, 14% not at all).
0.9% of residents speak other Indo-European language at home (48% very well, 33% well, 19% not well).
0.7% of residents speak Asian or Pacific Island language at home (48% very well, 24% well, 28% not well).
1.6% of residents speak other language at home (48% very well, 27% well, 18% not well, 8% not at all).
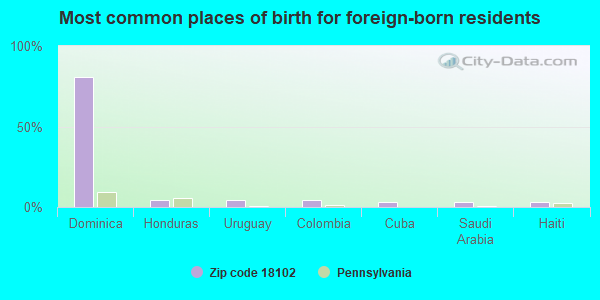
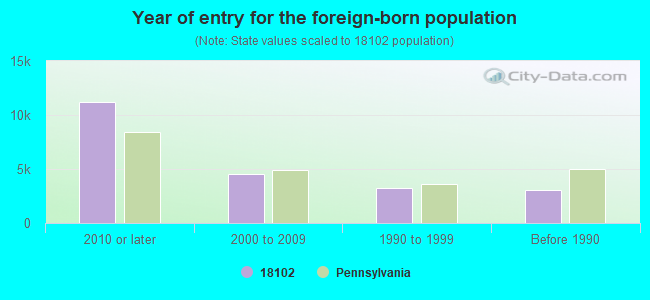
Foreign born population: 11,954 (23.2%) (42.4% of them are naturalized citizens)
Major facilities with environmental interests located in this zip code:
ALLENTOWN CITY WWTP (112 UNION STREET in ALLENTOWN, PA)
AIR MINOR (AIRS/AFS) (Integrated Compliance Information System) - ICIS-03-1989-0042, FORMAL ENFORCEMENT ACTION STATE MASTER (Pennsylvania database) - AFS-23-6003116-2, AIR PROGRAM, PCS-PA0026000, National Pollutant Discharge Elimination System Permit National Pollutant Discharge Elimination System MAJOR (Tracking pollutant discharge elimination systems) - permit National Pollutant Discharge Elimination System NON-MAJOR (Tracking pollutant discharge elimination systems) - permit National Pollutant Discharge Elimination System NON-MAJOR (Tracking pollutant discharge elimination systems) - permit (Resource Conservation and Recovery Act (tracking hazardous waste)) Business SIC classification: SEWERAGE SYSTEMS; AIR AND WATER RESOURCE AND SOLID WASTE MANAGEMENT Organizations: OPERNAME (CONTACT/OPERATOR)
, CITY OF ALLENTOWN (CONTACT/OWNER)
Alternative names: ALLENTOWN CITY AUTHORITY-WASTE, ALLENTOWN CITY/STP, ALLENTOWN CITY/WATER FILTRATION PLT, ALLENTOWN WASTE WATER TREATMENT PLANT, CITY OF ALLENTOWN, CITY OF ALLENTOWN H2O BUREAU, CITY OF ALLENTOWN WASTEWATER TREATMENT PLANT
ACME CRYOGENICS (1 WEST ALLEN STREET in ALLENTOWN, PA)
AIR MINOR (AIRS/AFS) STATE MASTER (Pennsylvania database) - AFS-23-1745312-1, AIR PROGRAM, RCRIS-PA0000918888, HAZARDOUS WASTE PROGRAM HAZARDOUS WASTE BIENNIAL REPORTER (Resource Conservation and Recovery Act (tracking hazardous waste)) Large Quantity Generators, more that 1000 kg of hazardous waste/month (Resource Conservation and Recovery Act (tracking hazardous waste)) Business SIC classification: INDUSTRIAL GASES Organizations: ACME CRYOGENICS INC (CONTACT/OPERATOR)
, LSS REALTY CORP (CONTACT/OWNER)
, ACME CRYOGENICS, INC. (CONTACT/OWNER)
Alternative names: ACME CRYOGENICS/ALLENTOWN PLANT
AMER ATELIER MFG (301 N FRONT ST in ALLENTOWN, PA)
AIR MINOR (AIRS/AFS) COMPLIANCE ACTIVITY (Tracking inspections of insecticide, fungicide, and rodenticide, and toxic substances) STATE MASTER (Pennsylvania database) - AFS-23-1291976-1, AIR PROGRAM Small Quantity Generators, between 100 kg and 1000 kg of hazardous waste/month (Resource Conservation and Recovery Act (tracking hazardous waste)) - notification Business SIC classification: WOOD HOUSEHOLD FURNITURE, EXCEPT UPHOLSTERED; WOOD OFFICE FURNITURE; OFFICE FURNITURE, EXCEPT WOOD; FURNITURE AND FIXTURES Business NAICS classification: UPHOLSTERED HOUSEHOLD FURNITURE MANUFACTURING.; NONUPHOLSTERED WOOD HOUSEHOLD FURNITURE MANUFACTURING.; INSTITUTIONAL FURNITURE MANUFACTURING.; OFFICE FURNITURE (EXCEPT WOOD) MANUFACTURING. Organizations: OPERNAME (CONTACT/OPERATOR)
, AMERICAN ATELIER INC (CONTACT/OWNER)
, AMERICAN ATELIER, INC. (CONTACT/OWNER)
Alternative names: AMERICAN ATELIER INC, AMERICAN ATLELIER, BETHLTHEM FURNITURE MFG CO.
ATLANTIC SVC STA (1501 MAUCH CHUNK RD-TANKS in ALLENTOWN, PA)
STATE MASTER (Pennsylvania database) - RCRIS-PAD987340346, HAZARDOUS WASTE PROGRAM Conditionally Exempt Small Quantity Generators, less than 100 kg/month of hazardous waste (Resource Conservation and Recovery Act (tracking hazardous waste)) - notification Organizations: OPERNAME (CONTACT/OPERATOR)
, ATLANTIC REFINING & MARKETING (CONTACT/OWNER)
, ATLANTIC REFINING & MARKETING CORPORATION (OWNER/OPERATOR)
ATLANTIC SVC STA (1201 WEST HAMILTON STREET in ALLENTOWN, PA)
STATE MASTER (Pennsylvania database) - RCRIS-PAD987340296, HAZARDOUS WASTE PROGRAM Conditionally Exempt Small Quantity Generators, less than 100 kg/month of hazardous waste (Resource Conservation and Recovery Act (tracking hazardous waste)) - notification Organizations: OPERNAME (CONTACT/OPERATOR)
, ATLANTIC REFINING & MARKETING (CONTACT/OWNER)
, ATLANTIC REFINING & MARKETING CORPORATION (OWNER/OPERATOR)
1 SVC CTR (1637 TILGHMAN ST in ALLENTOWN, PA)
STATE MASTER (Pennsylvania database) - RCRIS-PAD987336187, HAZARDOUS WASTE PROGRAM Small Quantity Generators, between 100 kg and 1000 kg of hazardous waste/month (Resource Conservation and Recovery Act (tracking hazardous waste)) - notification Organizations: OPERNAME (CONTACT/OPERATOR)
, MARCHEST NICOLA (CONTACT/OWNER)
Alternative names: # 1 SERVICE CENTER
ALLENTOWN CITY SCHOOL DISTRICT (31 SOUTH PENN STREET in ALLENTOWN, PA)
(Integrated Compliance Information System) - ICIS-03-1987-0210, FORMAL ENFORCEMENT ACTION COMPLIANCE ACTIVITY (Tracking inspections of insecticide, fungicide, and rodenticide, and toxic substances) Alternative names: ALLENTOWN SCHOOL DISTRICT - STADIUM
ADT 84 (735 GORDON STREET in ALLENTOWN, PA)
(Integrated Compliance Information System) - ICIS-HQ-2002-6000, FORMAL ENFORCEMENT ACTION
ALLENTOWN RECORD CO INC (1002-10 WALNUT ST in ALLENTOWN, PA)
AIRPORT ROAD AUTO CARE (1245 AIRPORT RD in ALLENTOWN, PA)
Conditionally Exempt Small Quantity Generators, less than 100 kg/month of hazardous waste (Resource Conservation and Recovery Act (tracking hazardous waste)) - notification Organizations: PATRICIA PABON (CONTACT/OWNER)
ALLENTOWN PAINT CO (639 E ALLEN ST in ALLENTOWN, PA)
HAZARDOUS WASTE BIENNIAL REPORTER (Resource Conservation and Recovery Act (tracking hazardous waste)) (Resource Conservation and Recovery Act (tracking hazardous waste))
Housing units lacking complete plumbing facilities: 1.0% Housing units lacking complete kitchen facilities: 2.0%
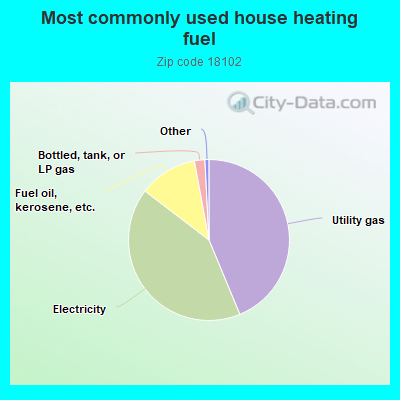
43.7%Utility gas
41.6%Electricity
11.7%Fuel oil, kerosene, etc.
2.1%Bottled, tank, or LP gas
Population in 1990: 41,873. Population change in the 1990s: +545 (+1.3%).
Place of birth for U.S.-born residents:
This state: 18,334
Northeast: 9,997
Midwest: 326
South: 1,904
West: 379
47% of the 18102 zip code residents lived in the same house 5 years ago. Out of people who lived in different houses, 69% lived in this county. Out of people who lived in different counties, 50% lived in Pennsylvania.
88% of the 18102 zip code residents lived in the same house 1 year ago. Out of people who lived in different houses, 65% moved from this county. Out of people who lived in different houses, 18% moved from different county within same state. Out of people who lived in different houses, 9% moved from different state. Out of people who lived in different houses, 7% moved from abroad.
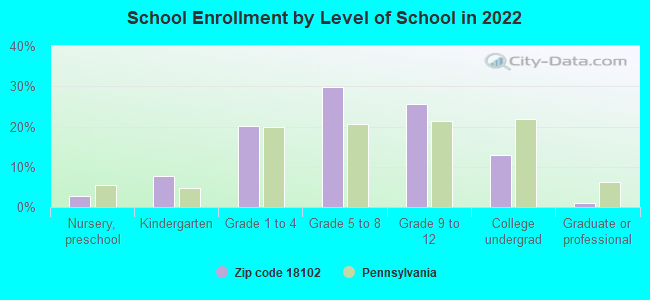
Private vs. public school enrollment:
Students in private schools in grades 1 to 8 (elementary and middle school): 381
Here:
5.6%
Pennsylvania:
15.7%
Students in private schools in grades 9 to 12 (high school): 173
Here:
5.0%
Pennsylvania:
13.4%
Students in private undergraduate colleges: 335
Here:
19.1%
Pennsylvania:
39.8%
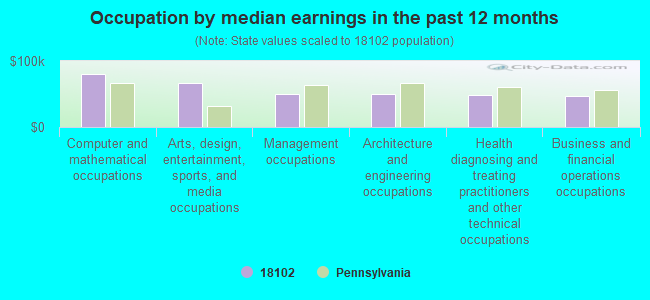
Occupation by median earnings in the past 12 months ($)
80,992Computer and mathematical occupations
67,207Arts, design, entertainment, sports, and media occupations
50,660Management occupations
50,151Architecture and engineering occupations
48,824Health diagnosing and treating practitioners and other technical occupations
47,318Business and financial operations occupations
Companies with federal contracts located in this zip code:
THERMAL CONTROL SUPPLY, INC (1208 ROTH AVENUE in ALLENTOWN, PA; small business) : $118,584 in 5 contractsfrom 2003 to 2006
Contracts for Hose, Pipe, Tube, Lubrication, and Railing Fittings, Space and Water Heating Equipment by Defense Logistics Agency, Army, U.S. Army Corps of Engineers - civil program financing only Signed by year:2000: $0; 2001: $0; 2002: $0; 2003: $24,912; 2004: $0; 2005: $38,990; 2006: $54,682.
Biggest contracts:
$38,990 with Defense Logistics Agency for Hose, Pipe, Tube, Lubrication, and Railing Fittings. Signed on 2005-10-03. Completion date: 2005-11-02.
$31,658, same as above.Signed on 2006-05-04. Completion date: 2006-06-17.
$23,024, same as above.Signed on 2006-06-02. Completion date: 2006-08-01.
$12,456 with Army for Space and Water Heating Equipment. Signed on 2003-12-23. Completion date: 2003-12-12.
BALAZS INC (940 N 8TH ST in ALLENTOWN, PA; small business) : $15,001 in 2 contractsin 2004
$12,165 with Army for Athletic and Sporting Equipment. Taking place in CO. Signed on 2004-09-24. Completion date: 2004-09-30.
$2,836 with Federal Supply Service for Office Furniture. Signed on 2004-08-09. Completion date: 2004-09-11.
GENERAL SOUND TELEPHONE CO (1216 W WASHINGTON ST in ALLENTOWN, PA; small business)
$9,890 with U.S. Army Corps of Engineers - civil program financing only for Miscellaneous Electrical and Electronic Components. Signed on 2003-08-21. Completion date: 2003-07-18.
Top industries in this zip code by the number of employees in 2005:
2009 - 2011 National Fire Incident Reporting System (NFIRS) incidents
According to the data from the years 2009 - 2011 the average number of fires per year is 392. The highest number of reported fires - 561 took place in 2010, and the least - 97 in 2009. The data has a rising trend.
When looking into fire subcategories, the most incidents belonged to: Structure Fires (53.1%), and Outside Fires (18.6%).
Fire incident types reported to NFIRS in Zip Code 18102


 Nearest zip codes: 18101, 18105, 18103, 18109, 18032, 18052.
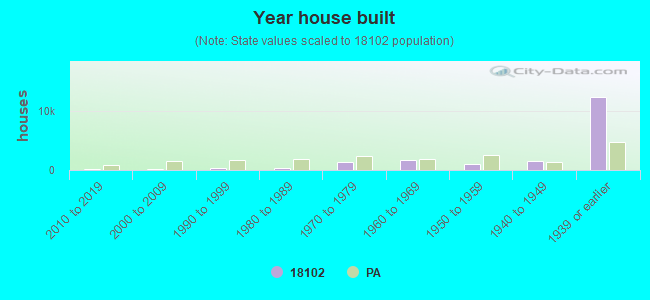


 According to the data from the years 2009 - 2011 the average number of fires per year is 392. The highest number of reported fires - 561 took place in 2010, and the least - 97 in 2009. The data has a rising trend.
 When looking into fire subcategories, the most incidents belonged to: Structure Fires (53.1%), and Outside Fires (18.6%).