Estimated zip code population in 2022: 6,750 Zip code population in 2010: 6,889 Zip code population in 2000: 6,103
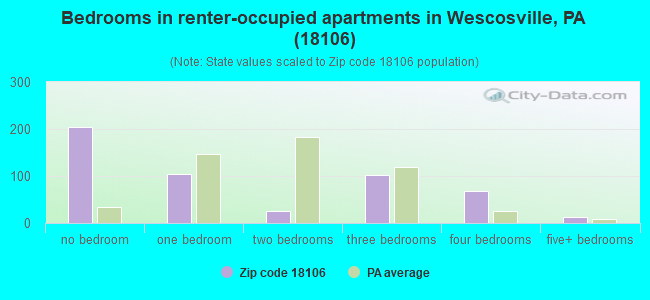
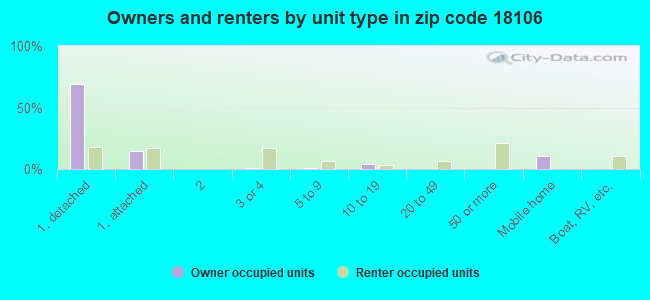
Houses and condos: 2,815 Renter-occupied apartments: 500
% of renters here:
18%
State:
31%
March 2022 cost of living index in zip code 18106: 101.0 (near average, U.S. average is 100)
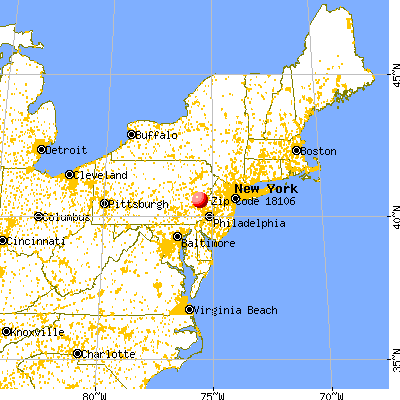
Land area: 8.2 sq. mi. Water area: 0.1 sq. mi.
Population density: 819 people per square mile
(low).
OSM Map
General Map
Google Map
MSN Map
OSM Map
General Map
Google Map
MSN Map
OSM Map
General Map
Google Map
MSN Map
OSM Map
General Map
Google Map
MSN Map
Please wait while loading the map...
Real estate property taxes paid for housing units in 2022:
This zip code:
1.4% ($5,112)
Pennsylvania:
1.3% ($3,094)
Median real estate property taxes paid for housing units with mortgages in 2022: $5,495 (1.5%) Median real estate property taxes paid for housing units with no mortgage in 2022: $3,750 (1.2%)
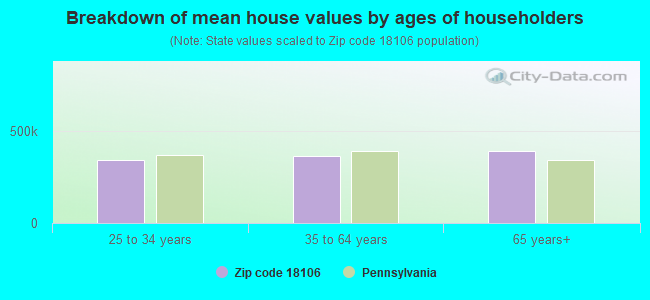
Estimated median house/condo value in 2022: $364,777
18106:
$364,777
Pennsylvania:
$245,500
According to our research of Pennsylvania and other state lists, there were 5 registered sex offenders living in 18106 zip code as of April 27, 2024. The ratio of all residents to sex offenders in zip code 18106 is 1,521 to 1. The ratio of registered sex offenders to all residents in this zip code is much lower than the state average.
Median resident age:
This zip code:
46.0 years
Pennsylvania median age:
40.9 years
Average household size:
This zip code:
2.4 people
Pennsylvania:
2.4 people
Averages for the 2020 tax year for zip code 18106, filed in 2021:
Average Adjusted Gross Income (AGI) in 2020: $98,463 (Individual Income Tax Returns)
Here:
$98,463
State:
$75,707
Salary/wage: $84,870 (reported on 78.3% of returns)
Here:
$84,870
State:
$62,806
(% of AGI for various income ranges: 1073.7% for AGIs below $25k, 3295.9% for AGIs $25k-50k, 5991.4% for AGIs $50k-75k, 9455.9% for AGIs $75k-100k, 18748.9% for AGIs $100k-200k, 126675.6% for AGIs over 200k)
Taxable interest for individuals: $1,901 (reported on 42.6% of returns)
This zip code:
$1,901
Pennsylvania:
$1,633
(% of AGI for various income ranges: 34.9% for AGIs below $25k, 52.9% for AGIs $25k-50k, 85.1% for AGIs $50k-75k, 110.9% for AGIs $75k-100k, 222.6% for AGIs $100k-200k, 1298.9% for AGIs over 200k)
Ordinary dividends: $6,889 (reported on 33.2% of returns)
Here:
$6,889
State:
$7,382
(% of AGI for various income ranges: 45.4% for AGIs below $25k, 116.4% for AGIs $25k-50k, 161.1% for AGIs $50k-75k, 317.7% for AGIs $75k-100k, 619.7% for AGIs $100k-200k, 4600.0% for AGIs over 200k)
Net capital gain/loss in AGI: +$22,361 (reported on 27.1% of returns)
Here:
+$22,361
State:
+$23,522
(% of AGI for various income ranges: 53.9% for AGIs $25k-50k, 119.5% for AGIs $50k-75k, 228.6% for AGIs $75k-100k, 706.9% for AGIs $100k-200k, 20960.0% for AGIs over 200k)
Profit/loss from business: +$19,002 (reported on 12.1% of returns)
Here:
+$19,002
State:
+$16,274
(% of AGI for various income ranges: 60.5% for AGIs below $25k, 139.3% for AGIs $25k-50k, 234.1% for AGIs $50k-75k, 351.8% for AGIs $75k-100k, 605.7% for AGIs $100k-200k, 4033.3% for AGIs over 200k)
Taxable individual retirement arrangement distribution: $18,036 (reported on 15.5% of returns)
18106:
$18,036
Pennsylvania:
$18,583
(% of AGI for various income ranges: 94.6% for AGIs below $25k, 211.6% for AGIs $25k-50k, 368.4% for AGIs $50k-75k, 577.7% for AGIs $75k-100k, 1263.7% for AGIs $100k-200k, 1803.3% for AGIs over 200k)
Self-employed (Keogh) retirement plans: $18,833 (reported on 0.8% of returns)
18106:
$18,833
Pennsylvania:
$25,407
(% of AGI for various income ranges: 627.8% for AGIs over 200k)
Total itemized deductions: $34,856 (reported on 9.7% of returns)
Here:
$34,856
State:
$34,850
(% of AGI for various income ranges: 206.1% for AGIs $25k-50k, 298.9% for AGIs $50k-75k, 794.5% for AGIs $75k-100k, 852.0% for AGIs $100k-200k, 6175.6% for AGIs over 200k)
Charity contributions: $9,747 (reported on 8.0% of returns)
Here:
$9,747
State:
$12,392
(% of AGI for various income ranges: 13.0% for AGIs $25k-50k, 30.8% for AGIs $50k-75k, 72.3% for AGIs $75k-100k, 196.3% for AGIs $100k-200k, 2101.1% for AGIs over 200k)
Taxes paid: $8,114 (reported on 9.7% of returns)
18106:
$8,114
State:
$8,200
(% of AGI for various income ranges: 25.7% for AGIs $25k-50k, 67.0% for AGIs $50k-75k, 171.8% for AGIs $75k-100k, 268.0% for AGIs $100k-200k, 1347.8% for AGIs over 200k)
Earned income credit: $1,948 (reported on 8.8% of returns)
Here:
$1,948
State:
$2,100
(% of AGI for various income ranges: 54.1% for AGIs below $25k, 53.9% for AGIs $25k-50k)
Percentage of individuals using paid preparers for their 2020 taxes: 91.2%
Here:
91%
State:
92%
(% for various income ranges: 89.7% for AGIs below $25k, 91.9% for AGIs $25k-50k, 90.6% for AGIs $50k-75k, 91.7% for AGIs $75k-100k, 91.2% for AGIs $100k-200k, 94.3% for AGIs over 200k)
Averages for the 2012 tax year for zip code 18106, filed in 2013:
Average Adjusted Gross Income (AGI) in 2012: $77,048 (Individual Income Tax Returns)
Here:
$77,048
State:
$61,346
Salary/wage: $69,583 (reported on 80.8% of returns)
Here:
$69,583
State:
$51,902
(% of AGI for various income ranges: 63.5% for AGIs below $25k, 70.8% for AGIs $25k-50k, 74.5% for AGIs $50k-75k, 70.8% for AGIs $75k-100k, 77.3% for AGIs $100k-200k, 71.3% for AGIs over 200k)
Taxable interest for individuals: $1,642 (reported on 48.7% of returns)
This zip code:
$1,642
Pennsylvania:
$1,588
(% of AGI for various income ranges: 2.4% for AGIs below $25k, 0.9% for AGIs $25k-50k, 1.2% for AGIs $50k-75k, 1.4% for AGIs $75k-100k, 0.5% for AGIs $100k-200k, 1.1% for AGIs over 200k)
Ordinary dividends: $4,558 (reported on 36.2% of returns)
Here:
$4,558
State:
$5,827
(% of AGI for various income ranges: 5.1% for AGIs below $25k, 2.5% for AGIs $25k-50k, 1.5% for AGIs $50k-75k, 2.2% for AGIs $75k-100k, 1.6% for AGIs $100k-200k, 2.3% for AGIs over 200k)
Net capital gain/loss in AGI: +$5,881 (reported on 26.7% of returns)
Here:
+$5,881
State:
+$14,495
(% of AGI for various income ranges: 0.4% for AGIs $50k-75k, 1.0% for AGIs $75k-100k, 0.7% for AGIs $100k-200k, 5.1% for AGIs over 200k)
Profit/loss from business: +$19,030 (reported on 13.1% of returns)
Here:
+$19,030
State:
+$16,268
(% of AGI for various income ranges: 5.0% for AGIs below $25k, 4.2% for AGIs $25k-50k, 2.8% for AGIs $50k-75k, 2.8% for AGIs $75k-100k, 3.6% for AGIs $100k-200k, 2.7% for AGIs over 200k)
Taxable individual retirement arrangement distribution: $15,204 (reported on 15.9% of returns)
18106:
$15,204
Pennsylvania:
$14,550
(% of AGI for various income ranges: 5.4% for AGIs below $25k, 4.4% for AGIs $25k-50k, 3.6% for AGIs $50k-75k, 4.1% for AGIs $75k-100k, 3.5% for AGIs $100k-200k, 1.7% for AGIs over 200k)
Self-employment retirement plans: $18,033 (reported on 0.8% of returns)
18106:
$18,033
Pennsylvania:
$20,922
Total itemized deductions: $24,773 (18% of AGI, reported on 42.9% of returns)
Here:
$24,773
State:
$23,538
Here:
18.2% of AGI
State:
18.4% of AGI
(% of AGI for various income ranges: 13.2% for AGIs below $25k, 11.9% for AGIs $25k-50k, 15.4% for AGIs $50k-75k, 15.7% for AGIs $75k-100k, 16.1% for AGIs $100k-200k, 11.3% for AGIs over 200k)
Charity contributions: $3,246 (reported on 36.2% of returns)
Here:
$3,246
State:
$4,025
(% of AGI for various income ranges: 0.8% for AGIs below $25k, 1.0% for AGIs $25k-50k, 1.2% for AGIs $50k-75k, 1.7% for AGIs $75k-100k, 2.0% for AGIs $100k-200k, 1.4% for AGIs over 200k)
Taxes paid: $11,066 (reported on 42.6% of returns)
18106:
$11,066
State:
$9,982
(% of AGI for various income ranges: 2.8% for AGIs below $25k, 3.5% for AGIs $25k-50k, 6.5% for AGIs $50k-75k, 5.8% for AGIs $75k-100k, 7.4% for AGIs $100k-200k, 6.2% for AGIs over 200k)
Earned income credit: $1,742 (reported on 8.6% of returns)
Here:
$1,742
State:
$2,106
(% of AGI for various income ranges: 3.0% for AGIs below $25k, 0.6% for AGIs $25k-50k)
Percentage of individuals using paid preparers for their 2012 taxes: 51.0%
Here:
51%
State:
53%
(% for various income ranges: 46.1% for AGIs below $25k, 47.4% for AGIs $25k-50k, 57.1% for AGIs $50k-75k, 51.4% for AGIs $75k-100k, 54.2% for AGIs $100k-200k, 65.2% for AGIs over 200k)
Averages for the 2004 tax year for zip code 18106, filed in 2005:
Average Adjusted Gross Income (AGI) in 2004: $59,197 (Individual Income Tax Returns)
Here:
$59,197
State:
$48,049
Salary/wage: $55,219 (reported on 82.4% of returns)
Here:
$55,219
State:
$42,646
(% of AGI for various income ranges: 81.5% for AGIs below $10k, 64.9% for AGIs $10k-25k, 76.3% for AGIs $25k-50k, 75.2% for AGIs $50k-75k, 82.0% for AGIs $75k-100k, 77.2% for AGIs over 100k)
Taxable interest for individuals: $1,427 (reported on 63.9% of returns)
This zip code:
$1,427
Pennsylvania:
$1,657
(% of AGI for various income ranges: 6.9% for AGIs below $10k, 4.6% for AGIs $10k-25k, 1.9% for AGIs $25k-50k, 1.7% for AGIs $50k-75k, 1.6% for AGIs $75k-100k, 0.9% for AGIs over 100k)
Taxable dividends: $2,762 (reported on 41.3% of returns)
Here:
$2,762
State:
$3,566
(% of AGI for various income ranges: 9.4% for AGIs below $10k, 4.8% for AGIs $10k-25k, 1.7% for AGIs $25k-50k, 1.6% for AGIs $50k-75k, 1.5% for AGIs $75k-100k, 1.7% for AGIs over 100k)
Net capital gain/loss: +$4,994 (reported on 30.6% of returns)
Here:
+$4,994
State:
+$9,716
(% of AGI for various income ranges: -3.4% for AGIs below $10k, -1.4% for AGIs $10k-25k, 0.8% for AGIs $25k-50k, 0.9% for AGIs $50k-75k, 0.9% for AGIs $75k-100k, 4.5% for AGIs over 100k)
Profit/loss from business: +$21,663 (reported on 12.7% of returns)
Here:
+$21,663
State:
+$14,267
(% of AGI for various income ranges: 4.2% for AGIs below $10k, 4.5% for AGIs $10k-25k, 3.9% for AGIs $25k-50k, 3.8% for AGIs $50k-75k, 2.5% for AGIs $75k-100k, 5.7% for AGIs over 100k)
IRA payment deduction: $2,856 (reported on 3.8% of returns)
18106:
$2,856
Pennsylvania:
$2,903
(% of AGI for various income ranges: 0.2% for AGIs $10k-25k, 0.4% for AGIs $25k-50k, 0.2% for AGIs $50k-75k, 0.2% for AGIs $75k-100k, 0.1% for AGIs over 100k)
Self-employed pension: $15,841 (reported on 1.3% of returns)
Here:
$15,841
Pennsylvania:
$14,674
Total itemized deductions: $19,777 (19% of AGI, reported on 42.7% of returns)
Here:
$19,777
State:
$18,804
Here:
19.0% of AGI
State:
19.5% of AGI
(% of AGI for various income ranges: 15.6% for AGIs below $10k, 12.0% for AGIs $10k-25k, 12.3% for AGIs $25k-50k, 14.7% for AGIs $50k-75k, 15.9% for AGIs $75k-100k, 14.4% for AGIs over 100k)
Charity contributions deductions: $2,898 (3% of AGI, reported on 38.9% of returns)
Here:
$2,898
State:
$3,337
Here:
2.7% of AGI
State:
3.3% of AGI
(% of AGI for various income ranges: 0.9% for AGIs below $10k, 1.1% for AGIs $10k-25k, 1.2% for AGIs $25k-50k, 1.6% for AGIs $50k-75k, 1.7% for AGIs $75k-100k, 2.3% for AGIs over 100k)
Total tax: $9,643 (reported on 80.7% of returns)
18106:
$9,643
State:
$8,008
(% of AGI for various income ranges: 2.5% for AGIs below $10k, 4.2% for AGIs $10k-25k, 7.5% for AGIs $25k-50k, 9.2% for AGIs $50k-75k, 10.1% for AGIs $75k-100k, 17.7% for AGIs over 100k)
Earned income credit: $1,563 (reported on 6.9% of returns)
Here:
$1,563
State:
$1,643
Percentage of individuals using paid preparers for their 2004 taxes: 52.1%
Here:
52%
State:
56%
(% for various income ranges: 45.7% for AGIs below $10k, 58.7% for AGIs $10k-25k, 51.8% for AGIs $25k-50k, 56.2% for AGIs $50k-75k, 49.2% for AGIs $75k-100k, 50.8% for AGIs over 100k)
Household received Food Stamps/SNAP in the past 12 months: 107 Household did not receive Food Stamps/SNAP in the past 12 months: 2,671
Women who had a birth in the past 12 months: 28 (20 now married, 7 unmarried) Women who did not have a birth in the past 12 months: 1,193 (670 now married, 516 unmarried)
Housing units in zip code 18106 with a mortgage: 1,360 (111 second mortgage, 78 both second mortgage and home equity loan) Houses without a mortgage: 104
Median monthly owner costs for units with a mortgage: $1,899 Median monthly owner costs for units without a mortgage: $773
Residents with income below the poverty level in 2022:
This zip code:
5.8%
Whole state:
11.8%
Residents with income below 50% of the poverty level in 2022:
This zip code:
3.6%
Whole state:
6.1%
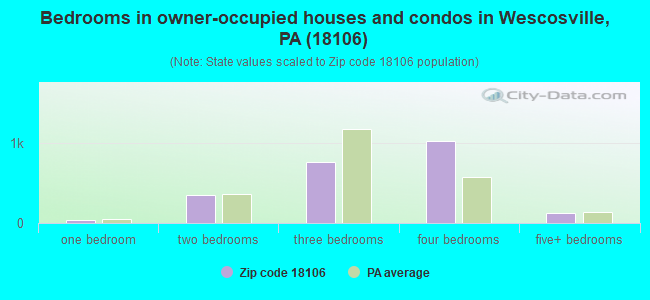
Median number of rooms in houses and condos:
Here:
7.2
State:
6.8
Median number of rooms in apartments:
Here:
2.6
State:
4.3
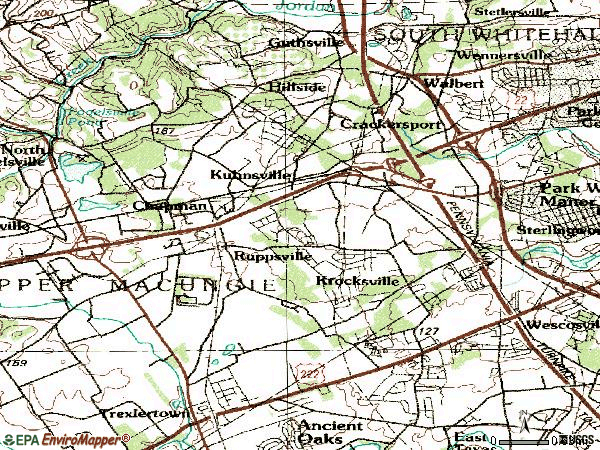
Notable locations in this zip code not listed on our city pages
Notable locations in zip code 18106: Holiday Plaza (A), Camp Moritz (B), Lower Macungie Fire Department Station 30 (C). Display/hide their locations on the map
In group quarters: 27 (-1 institutionalized population)
Size of family households: 1,019 2-persons, 535 3-persons, 341 4-persons, 120 5-persons, 66 6-persons
Size of nonfamily households: 526 1-person, 178 2-persons
992 married couples with children.
356 single-parent households (188 men, 168 women).
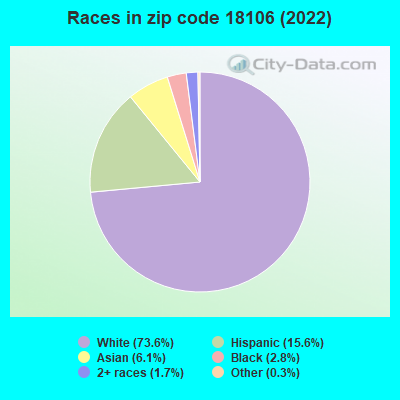
78.4% of residents of 18106 zip code speak English at home.
11.1% of residents speak Spanish at home (59% very well, 26% well, 5% not well, 9% not at all).
9.9% of residents speak other Indo-European language at home (85% very well, 15% well).
0.7% of residents speak Asian or Pacific Island language at home (51% very well, 49% well).
0.3% of residents speak other language at home (57% very well, 43% not well).
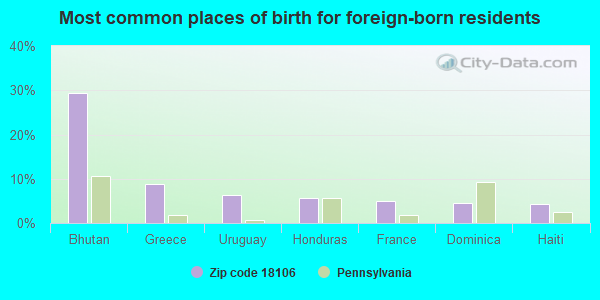
Foreign born population: 902 (13.4%) (85.5% of them are naturalized citizens)
Facilities with environmental interests located in this zip code:
BEHR PROC CORP ALLENTOWN (7529 MORRIS COURT in ALLENTOWN, PA)
ENFORCEMENT/COMPLIANCE ACTIVITY (Integrated Compliance Information System) CRITERIA AND HAZARDOUS AIR POLLUTANT INVENTORY (Inventory of air pollution sources) STATE MASTER (Pennsylvania database) - RCRIS-PAR000038679, HAZARDOUS WASTE PROGRAM, PCS-PAR152201, National Pollutant Discharge Elimination System Permit National Pollutant Discharge Elimination System NON-MAJOR (Tracking pollutant discharge elimination systems) - permit HAZARDOUS WASTE BIENNIAL REPORTER (Resource Conservation and Recovery Act (tracking hazardous waste)) Small Quantity Generators, between 100 kg and 1000 kg of hazardous waste/month (Resource Conservation and Recovery Act (tracking hazardous waste)) TRI REPORTER (Tracking of toxic chemicals releasing facilities) Business SIC classification: PAINTS, VARNISHES, LACQUERS, ENAMELS, AND ALLIED PRODUCTS Organizations: BEHR PROCESS CORPORATION (CONTACT/OPERATOR)
, MORGAN J P INVESTMENT MGMT (CONTACT/OWNER)
, KEYSTONE MBP LP (CONTACT/OWNER)
, BEHR PROCESS CORPORATION (CONTACT/OWNER)
Alternative names: BEHR PROCESS CORP, BEHR PROCESS CORP ALLENTOWN, MORGAN J P INVESTMENT MGMT
AJ OSTER COPPER & BRASS MFG (6690 GRANT WAY in ALLENTOWN, PA)
STATE MASTER (Pennsylvania database) - PCS-NNOEX00702, National Pollutant Discharge Elimination System Permit, RCRIS-PAD053061107, HAZARDOUS WASTE PROGRAM Conditionally Exempt Small Quantity Generators, less than 100 kg/month of hazardous waste (Resource Conservation and Recovery Act (tracking hazardous waste)) Organizations: A. J. OSTER COMPANY (CONTACT/GENERAL)
, OPERNAME (CONTACT/OPERATOR)
, OLIN CORP (CONTACT/OWNER)
, BELL ATLANTIC PROPERTIES INC (CONTACT/OWNER)
, A. J. OSTER COMPANY (CONTACT/OWNER)
Alternative names: OSTER A J CO
ABB AUTOMATION (7036 SNOTDRIFT ROAD in ALLENTOWN, PA)
ENFORCEMENT/COMPLIANCE ACTIVITY (Integrated Compliance Information System) COMPLIANCE ACTIVITY (Tracking inspections of insecticide, fungicide, and rodenticide, and toxic substances) STATE MASTER (Pennsylvania database) - RCRIS-PAD982568156, HAZARDOUS WASTE PROGRAM Alternative names: ABB, INC.
AIR PRODUCTS & CHEMICALS ALLENTOWN (7066 SNOWDRIFT RD in ALLENTOWN, PA)
ENFORCEMENT/COMPLIANCE ACTIVITY (Integrated Compliance Information System) HAZARDOUS WASTE BIENNIAL REPORTER (Resource Conservation and Recovery Act (tracking hazardous waste)) (Resource Conservation and Recovery Act (tracking hazardous waste)) Organizations: OPERNAME (CONTACT/OPERATOR)
, AIR PRODUCTS & CHEMICALS INC (CONTACT/OWNER)
Alternative names: AIR PRODUCTS & CHEMICALS INC
AGERE SYSTEMS MORRIS CT (7520 MORRIS CT in ALLENTOWN, PA)
(Resource Conservation and Recovery Act (tracking hazardous waste)) Organizations: AGERE SYSTEMS INC (CONTACT/OWNER)
AGERE SYSTEMS SNOWDRIFT RD (6755 SNOWDRIFT RD in ALLENTOWN, PA)
(Resource Conservation and Recovery Act (tracking hazardous waste)) Organizations: AGERE SYSTEMS INC (CONTACT/OWNER)
ABB POWER T & D CO INC (35 N SNOWDRIFT RD in ALLENTOWN, PA)
Small Quantity Generators, between 100 kg and 1000 kg of hazardous waste/month (Resource Conservation and Recovery Act (tracking hazardous waste)) - notification Organizations: OPERNAME (CONTACT/OPERATOR)
, ABB POWER T & D CO INC (CONTACT/OWNER)
AIR PRODUCTS & CHEMICALS INC (24 WILLIAM DR in ALLENTOWN, PA)
Small Quantity Generators, between 100 kg and 1000 kg of hazardous waste/month (Resource Conservation and Recovery Act (tracking hazardous waste)) - notification Organizations: OPERNAME (CONTACT/OPERATOR)
, AIR PRODUCTS AND CHEMICALS INC (CONTACT/OWNER)
ALCOA FUJIKURA LTD (6580 SNOWDRIFT RD in ALLENTOWN, PA)
Conditionally Exempt Small Quantity Generators, less than 100 kg/month of hazardous waste (Resource Conservation and Recovery Act (tracking hazardous waste)) - notification Organizations: LIBERTY PROPERTY TRUST (CONTACT/OWNER)
ALCOA FUJIKURA LTD (7346 PENN DR in ALLENTOWN, PA)
Conditionally Exempt Small Quantity Generators, less than 100 kg/month of hazardous waste (Resource Conservation and Recovery Act (tracking hazardous waste)) - notification
ANACOMP (6330 HEDGEWOOD DR STE 250 in ALLENTOWN, PA)
Conditionally Exempt Small Quantity Generators, less than 100 kg/month of hazardous waste (Resource Conservation and Recovery Act (tracking hazardous waste)) - notification Organizations: ANACOMP INC (CONTACT/OWNER)
AUSTIN MOLDING CO (7020 SNOWDRIFT RD in ALLENTOWN, PA)
Small Quantity Generators, between 100 kg and 1000 kg of hazardous waste/month (Resource Conservation and Recovery Act (tracking hazardous waste)) - notification Organizations: BATES MFS CO MR TOM WILLIAMS (CONTACT/OWNER)
BETHLEHEM STEEL CO (XXXXXXXXXXXXXXXXXXXX in BETHLEHEM, PA)
COMPLIANCE ACTIVITY (Tracking inspections of insecticide, fungicide, and rodenticide, and toxic substances)
Housing units lacking complete plumbing facilities: 3.1% Housing units lacking complete kitchen facilities: 3.9%
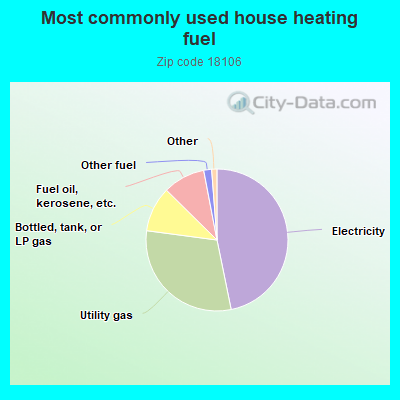
46.8%Electricity
30.3%Utility gas
10.3%Bottled, tank, or LP gas
9.6%Fuel oil, kerosene, etc.
1.8%Other fuel
0.6%Wood
0.6%Coal or coke
Population in 1990: 6,260.
Place of birth for U.S.-born residents:
This state: 3,896
Northeast: 1,095
Midwest: 329
South: 225
West: 55
51% of the 18106 zip code residents lived in the same house 5 years ago. Out of people who lived in different houses, 58% lived in this county. Out of people who lived in different counties, 50% lived in Pennsylvania.
92% of the 18106 zip code residents lived in the same house 1 year ago. Out of people who lived in different houses, 67% moved from this county. Out of people who lived in different houses, 10% moved from different county within same state. Out of people who lived in different houses, 24% moved from different state.
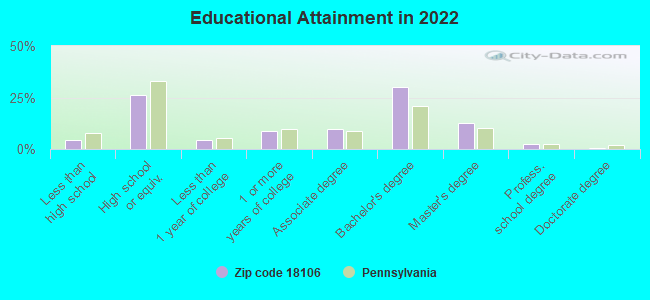
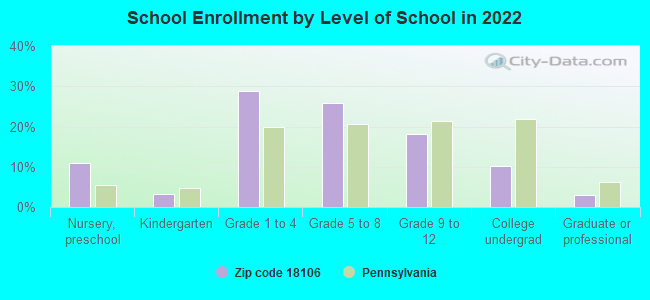
Private vs. public school enrollment:
Students in private schools in grades 1 to 8 (elementary and middle school): 93
Here:
11.8%
Pennsylvania:
15.7%
Students in private schools in grades 9 to 12 (high school):
Here:
0.0%
Pennsylvania:
13.4%
Students in private undergraduate colleges: 28
Here:
19.3%
Pennsylvania:
39.8%
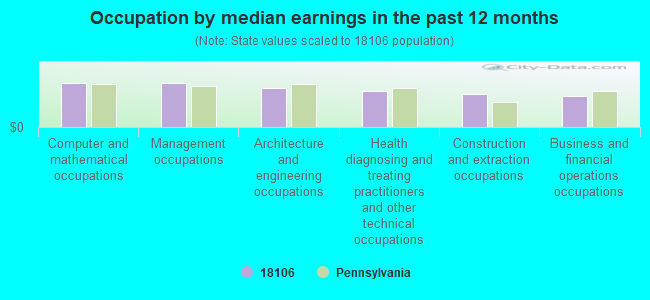
Occupation by median earnings in the past 12 months ($)
116,133Computer and mathematical occupations
116,091Management occupations
102,983Architecture and engineering occupations
95,575Health diagnosing and treating practitioners and other technical occupations
87,460Construction and extraction occupations
80,846Business and financial operations occupations
Companies with federal contracts located in this zip code (ALLENTOWN, PA):
INDOGEM INC (6265 HAMILTON BLVD; small business) : $3,432,652 in 47 contractsfrom 1999 to 2006
Contracts for Clothing, Special Purpose, Footwear, Men's, Laboratory Equipment and Supplies, Individual Equipment by Defense Logistics Agency, Federal Supply Service, Food Safety and Inspection Service, Air Force, and others Signed by year:2000: $0; 2001: $536,400; 2002: $954,867; 2003: $317,196; 2004: $538,373; 2005: $551,315; 2006: $66,168.
Biggest contracts:
$468,333 with Defense Logistics Agency for Clothing, Special Purpose. Signed on 1999-10-27. Completion date: 2001-01-15.
$428,838, same as above.Signed on 2002-09-27. Completion date: 2003-11-30.
$321,840, same as above.Signed on 2001-12-04. Completion date: 2002-09-24.
$242,000, same as above.Signed on 2003-12-17. Completion date: 2005-02-11.
T-NETWORKS, INC (6580 SNOWDRIFT RD, SUITE 1; small business) : $497,503 in 2 contractsfrom 2004 to 2006
$399,994 with Army for Other Defense -- Applied Research and Exploratory Development (R&D). Signed on 2006-06-30. Completion date: 2007-12-31.
$97,509 with Army for Physical Sciences -- Applied Research and Exploratory Development (R&D). Signed on 2004-05-20. Completion date: 2005-01-15.
FLEXLINK SYSTEMS INC (6580 SNOWDRIFT RD STE 200; small business) : $417,420 in 4 contractsfrom 2004 to 2005
$368,102 with Navy for Medical and Surgical Instruments, Equipment, and Supplies. Taking place in VA. Signed on 2004-01-14. Completion date: 2004-03-24.
$35,084 with Navy for Ophthalmology Services. Taking place in VA. Signed on 2005-11-14. Completion date: 2006-11-14.
$8,574 with Navy for Ophthalmic Instruments, Equipment, and Supplies. Signed on 2005-09-16. Completion date: 2005-10-14.
$5,660 with Navy for Medical and Surgical Instruments, Equipment, and Supplies. Taking place in VA. Signed on 2004-02-19. Completion date: 2004-03-24.
COMMERCIAL COLOR INC (6330 FARM BUREAU RD; small business) : $70,000 in 3 contractsfrom 2002 to 2005
$30,000 with Army for Arts/Graphics Services. Signed on 2002-08-12. Completion date: 2003-08-13.
$20,000, same as above.Signed on 2005-05-25. Completion date: 2006-05-16.
$20,000, same as above.Signed on 2004-05-06. Completion date: 2005-05-16.
$12,092 with National Institutes of Health for . Taking place in MD. Signed on 2005-09-26. Completion date: 2005-11-30.
$11,903, same as above.Signed on 2005-01-31. Effective on 2004-11-03. Completion date: 2004-11-30.
KOOKER SCALE COMPANY INC (4867 HAMILTON BLVD; small business) : $20,700 in 2 contractsfrom 2005 to 2006
$11,500 with Army for Scales and Balances. Signed on 2006-03-29. Completion date: 2006-04-28.
$9,200 with Army for Maintenance, Repair and Rebuilding of Equipment -- Electrical and Electronic Equipment Components. Signed on 2005-12-05. Completion date: 2006-01-31.
RACK AMERICA, INC (1275 GLENLIVET DR STE 100; small business) : $11,231 in 2 contractsfrom 2003 to 2005
$6,761 with Air Force for Cabinets, Lockers, Bins, and Shelving. Signed on 2005-07-12. Completion date: 2005-08-30.
$4,470 with Army for Lubrication and Fuel Dispensing Equipment. Signed on 2003-06-13. Completion date: 2003-08-08.
EDUCATONAL SYSTEMS/SERVICE INC (884 OPLINGER RD; small business) : $7,302 in 2 contractsfrom 2003 to 2005
$4,820 with Army for Maintenance, Repair and Rebuilding of Equipment -- Miscellaneous. Signed on 2005-01-12. Completion date: 2005-08-29.
$2,482 with Army for Maintenance, Repair and Rebuilding of Equipment -- Office Machines, Text Processing Systems and Visible Record Equipment. Taking place in NJ. Signed on 2003-03-11. Completion date: 2003-03-21.
ACE MOVING & STORAGE CORP (7248 WILLIAM PENN DR; small business) : $5,001 in 2 contractsfrom 2001 to 2003
$5,000 with Public Buildings Service for Motor Charter for Things. Signed on 2001-08-15. Completion date: 2001-08-15.
$1, same as above.Signed on 2003-04-15. Completion date: 2001-08-15.
ALLENTOWN VALVE & FITTING CO (7200 WINDSOR DR; small business)
$2,827 with Navy for Valves, Nonpowered. Taking place in CA. Signed on 2005-08-05. Completion date: 2006-02-01.
Top industries in this zip code by the number of employees in 2005:
Administrative and Support and Waste Management and Remediation Services: Telemarketing Bureaus (250-499: 1)
Construction: Plumbing, Heating, and Air-Conditioning Contractors (250-499: 1)
Finance and Insurance: Direct Property and Casualty Insurance Carriers (100-249: 2)
Administrative and Support and Waste Management and Remediation Services: Security Systems Services (except Locksmiths) (100-249: 1, 50-99: 1, 20-49: 1)
Accommodation and Food Services: Hotels (except Casino Hotels) and Motels (100-249: 1, 20-49: 3, 1-4: 2)
People in group quarters in 2010:
56 people in nursing facilities/skilled-nursing facilities
5 people in group homes intended for adults
People in group quarters in 2000:
298 people in nursing homes
13 people in other nonhousehold living situations
5 people in homes for the mentally retarded
Fatal accident statistics in 2013:
Fatal accident count: 1
Vehicles involved in fatal accidents: 3
Fatal accidents caused by drunken drivers: 0
Fatalities: 1
Persons involved in fatal accidents: 3
Pedestrians involved in fatal accidents: 0
Fatal accident statistics in 2012:
Fatal accident count: 3
Vehicles involved in fatal accidents: 6
Fatal accidents caused by drunken drivers: 1
Fatalities: 3
Persons involved in fatal accidents: 5
Pedestrians involved in fatal accidents: 1
Home Mortgage Disclosure Act Aggregated Statistics For Year 2009 (Based on 4 partial tracts)
A) FHA, FSA/RHS & VA Home Purchase Loans
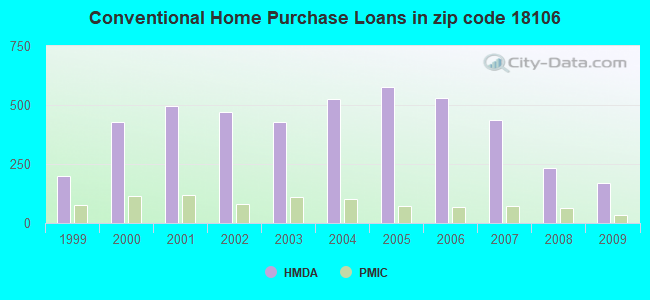
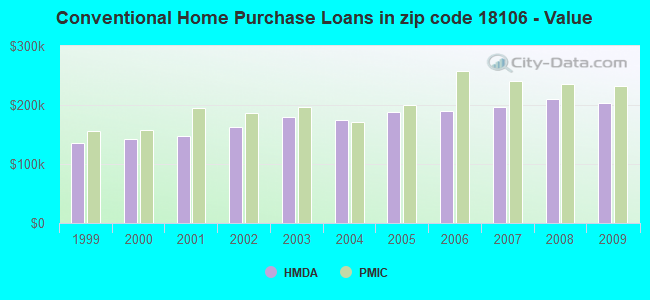
B) Conventional Home Purchase Loans
C) Refinancings
D) Home Improvement Loans
E) Loans on Dwellings For 5+ Families
F) Non-occupant Loans on < 5 Family Dwellings (A B C & D)
G) Loans On Manufactured Home Dwelling (A B C & D)
Number
Average Value
Number
Average Value
Number
Average Value
Number
Average Value
Number
Average Value
Number
Average Value
Number
Average Value
LOANS ORIGINATED
98
$226,230
168
$202,915
791
$208,773
69
$96,439
1
$861,190
28
$159,535
11
$56,713
APPLICATIONS APPROVED, NOT ACCEPTED
2
$220,920
14
$141,552
48
$209,676
6
$55,908
0
$0
1
$180,740
8
$54,418
APPLICATIONS DENIED
9
$213,527
28
$119,878
193
$219,860
16
$44,901
0
$0
4
$93,612
17
$42,996
APPLICATIONS WITHDRAWN
8
$234,854
17
$202,058
116
$232,442
18
$77,143
0
$0
9
$146,736
2
$4,060
FILES CLOSED FOR INCOMPLETENESS
2
$287,065
5
$166,534
25
$188,661
3
$81,513
0
$0
3
$144,933
5
$47,108
Aggregated Statistics For Year 2008 (Based on 4 partial tracts)
A) FHA, FSA/RHS & VA Home Purchase Loans
B) Conventional Home Purchase Loans
C) Refinancings
D) Home Improvement Loans
F) Non-occupant Loans on < 5 Family Dwellings (A B C & D)
G) Loans On Manufactured Home Dwelling (A B C & D)
Number
Average Value
Number
Average Value
Number
Average Value
Number
Average Value
Number
Average Value
Number
Average Value
LOANS ORIGINATED
47
$245,510
232
$210,708
412
$176,751
84
$60,858
16
$118,169
14
$40,078
APPLICATIONS APPROVED, NOT ACCEPTED
2
$199,800
23
$239,516
72
$194,743
15
$68,838
1
$129,710
4
$32,805
APPLICATIONS DENIED
9
$211,084
43
$160,877
169
$215,781
53
$74,823
7
$183,311
18
$38,923
APPLICATIONS WITHDRAWN
4
$163,182
14
$230,866
84
$211,116
11
$48,833
5
$115,658
0
$0
FILES CLOSED FOR INCOMPLETENESS
0
$0
16
$173,455
18
$227,943
7
$100,093
2
$165,690
5
$52,956
Aggregated Statistics For Year 2007 (Based on 4 partial tracts)
A) FHA, FSA/RHS & VA Home Purchase Loans
B) Conventional Home Purchase Loans
C) Refinancings
D) Home Improvement Loans
F) Non-occupant Loans on < 5 Family Dwellings (A B C & D)
G) Loans On Manufactured Home Dwelling (A B C & D)
Number
Average Value
Number
Average Value
Number
Average Value
Number
Average Value
Number
Average Value
Number
Average Value
LOANS ORIGINATED
24
$205,361
436
$196,625
442
$154,130
155
$47,426
24
$132,190
30
$38,001
APPLICATIONS APPROVED, NOT ACCEPTED
1
$239,220
56
$176,355
93
$179,329
17
$48,391
1
$124,390
8
$46,006
APPLICATIONS DENIED
3
$248,533
56
$173,946
215
$188,421
69
$41,745
18
$212,496
24
$34,971
APPLICATIONS WITHDRAWN
1
$239,220
36
$201,854
122
$215,278
13
$128,117
2
$271,650
0
$0
FILES CLOSED FOR INCOMPLETENESS
0
$0
9
$162,048
31
$214,917
2
$20,305
1
$157,350
0
$0
Aggregated Statistics For Year 2006 (Based on 4 partial tracts)
A) FHA, FSA/RHS & VA Home Purchase Loans
B) Conventional Home Purchase Loans
C) Refinancings
D) Home Improvement Loans
E) Loans on Dwellings For 5+ Families
F) Non-occupant Loans on < 5 Family Dwellings (A B C & D)
G) Loans On Manufactured Home Dwelling (A B C & D)
Number
Average Value
Number
Average Value
Number
Average Value
Number
Average Value
Number
Average Value
Number
Average Value
Number
Average Value
LOANS ORIGINATED
22
$187,404
530
$189,970
531
$141,022
209
$53,550
0
$0
32
$163,720
22
$31,712
APPLICATIONS APPROVED, NOT ACCEPTED
0
$0
66
$196,987
72
$132,191
23
$67,569
2
$8,120
9
$178,714
8
$42,880
APPLICATIONS DENIED
2
$165,690
43
$167,443
185
$168,270
55
$58,144
0
$0
4
$155,228
10
$36,784
APPLICATIONS WITHDRAWN
0
$0
47
$202,486
148
$179,743
10
$92,057
0
$0
6
$316,302
1
$43,590
FILES CLOSED FOR INCOMPLETENESS
0
$0
10
$147,257
27
$254,609
6
$77,572
0
$0
0
$0
0
$0
Aggregated Statistics For Year 2005 (Based on 4 partial tracts)
A) FHA, FSA/RHS & VA Home Purchase Loans
B) Conventional Home Purchase Loans
C) Refinancings
D) Home Improvement Loans
E) Loans on Dwellings For 5+ Families
F) Non-occupant Loans on < 5 Family Dwellings (A B C & D)
G) Loans On Manufactured Home Dwelling (A B C & D)
Number
Average Value
Number
Average Value
Number
Average Value
Number
Average Value
Number
Average Value
Number
Average Value
Number
Average Value
LOANS ORIGINATED
13
$199,711
575
$187,319
609
$148,350
183
$56,856
1
$6,007,080
43
$134,102
20
$48,370
APPLICATIONS APPROVED, NOT ACCEPTED
0
$0
74
$175,197
105
$150,716
26
$72,805
0
$0
4
$169,875
15
$44,654
APPLICATIONS DENIED
3
$154,600
82
$153,725
238
$179,089
48
$49,531
0
$0
6
$41,520
33
$39,213
APPLICATIONS WITHDRAWN
3
$137,333
51
$185,750
153
$180,578
22
$120,314
0
$0
4
$179,570
3
$23,107
FILES CLOSED FOR INCOMPLETENESS
0
$0
15
$159,223
66
$233,936
8
$97,165
0
$0
0
$0
1
$181,810
Aggregated Statistics For Year 2004 (Based on 4 partial tracts)
A) FHA, FSA/RHS & VA Home Purchase Loans
B) Conventional Home Purchase Loans
C) Refinancings
D) Home Improvement Loans
E) Loans on Dwellings For 5+ Families
F) Non-occupant Loans on < 5 Family Dwellings (A B C & D)
G) Loans On Manufactured Home Dwelling (A B C & D)
Number
Average Value
Number
Average Value
Number
Average Value
Number
Average Value
Number
Average Value
Number
Average Value
Number
Average Value
LOANS ORIGINATED
28
$159,082
525
$175,033
620
$140,855
140
$42,781
1
$1,794,680
27
$129,156
15
$37,309
APPLICATIONS APPROVED, NOT ACCEPTED
0
$0
73
$163,692
94
$135,076
22
$71,755
0
$0
6
$81,692
5
$52,446
APPLICATIONS DENIED
1
$220,080
60
$112,683
212
$153,568
40
$53,088
0
$0
10
$106,201
32
$32,781
APPLICATIONS WITHDRAWN
3
$140,307
41
$156,780
168
$165,625
17
$34,121
0
$0
8
$139,220
4
$59,252
FILES CLOSED FOR INCOMPLETENESS
0
$0
14
$161,408
29
$186,267
3
$20,527
0
$0
3
$73,440
0
$0
Aggregated Statistics For Year 2003 (Based on 4 partial tracts)
A) FHA, FSA/RHS & VA Home Purchase Loans
B) Conventional Home Purchase Loans
C) Refinancings
D) Home Improvement Loans
F) Non-occupant Loans on < 5 Family Dwellings (A B C & D)
Number
Average Value
Number
Average Value
Number
Average Value
Number
Average Value
Number
Average Value
LOANS ORIGINATED
24
$146,852
429
$179,290
1,604
$148,787
84
$30,492
36
$86,587
APPLICATIONS APPROVED, NOT ACCEPTED
2
$121,830
55
$127,275
187
$135,730
24
$34,988
9
$83,013
APPLICATIONS DENIED
2
$180,310
32
$150,520
214
$144,374
19
$42,407
9
$86,528
APPLICATIONS WITHDRAWN
2
$187,655
27
$164,145
185
$161,080
4
$54,830
2
$64,165
FILES CLOSED FOR INCOMPLETENESS
0
$0
7
$148,827
41
$135,390
5
$51,656
3
$83,927
Aggregated Statistics For Year 2002 (Based on 4 partial tracts)
A) FHA, FSA/RHS & VA Home Purchase Loans
B) Conventional Home Purchase Loans
C) Refinancings
D) Home Improvement Loans
E) Loans on Dwellings For 5+ Families
F) Non-occupant Loans on < 5 Family Dwellings (A B C & D)
Number
Average Value
Number
Average Value
Number
Average Value
Number
Average Value
Number
Average Value
Number
Average Value
LOANS ORIGINATED
40
$116,115
472
$163,004
965
$136,184
66
$25,236
2
$397,980
17
$82,768
APPLICATIONS APPROVED, NOT ACCEPTED
0
$0
30
$110,207
113
$131,655
22
$27,665
0
$0
4
$106,985
APPLICATIONS DENIED
1
$170,110
59
$95,133
159
$116,538
18
$35,986
0
$0
0
$0
APPLICATIONS WITHDRAWN
0
$0
15
$135,610
105
$147,652
4
$51,300
0
$0
3
$151,087
FILES CLOSED FOR INCOMPLETENESS
1
$106,320
8
$163,292
35
$133,963
4
$180,345
0
$0
0
$0
Aggregated Statistics For Year 2001 (Based on 4 partial tracts)
A) FHA, FSA/RHS & VA Home Purchase Loans
B) Conventional Home Purchase Loans
C) Refinancings
D) Home Improvement Loans
F) Non-occupant Loans on < 5 Family Dwellings (A B C & D)
Number
Average Value
Number
Average Value
Number
Average Value
Number
Average Value
Number
Average Value
LOANS ORIGINATED
31
$126,656
496
$148,122
622
$124,100
96
$32,510
25
$71,789
APPLICATIONS APPROVED, NOT ACCEPTED
0
$0
44
$101,821
71
$103,262
6
$63,615
2
$16,245
APPLICATIONS DENIED
2
$129,950
98
$55,615
135
$99,335
29
$24,553
16
$52,219
APPLICATIONS WITHDRAWN
1
$96,750
24
$119,041
118
$103,946
14
$40,177
1
$79,740
FILES CLOSED FOR INCOMPLETENESS
0
$0
5
$120,106
28
$125,974
2
$11,695
0
$0
Aggregated Statistics For Year 2000 (Based on 4 partial tracts)
A) FHA, FSA/RHS & VA Home Purchase Loans
B) Conventional Home Purchase Loans
C) Refinancings
D) Home Improvement Loans
F) Non-occupant Loans on < 5 Family Dwellings (A B C & D)
Number
Average Value
Number
Average Value
Number
Average Value
Number
Average Value
Number
Average Value
LOANS ORIGINATED
26
$100,943
426
$142,052
137
$82,775
95
$35,882
15
$94,959
APPLICATIONS APPROVED, NOT ACCEPTED
0
$0
48
$100,320
46
$73,541
33
$29,608
3
$40,757
APPLICATIONS DENIED
1
$128,650
99
$68,232
96
$98,391
25
$30,038
9
$67,348
APPLICATIONS WITHDRAWN
0
$0
23
$121,368
39
$100,789
8
$16,894
0
$0
FILES CLOSED FOR INCOMPLETENESS
2
$103,150
2
$113,230
10
$164,996
0
$0
0
$0
Aggregated Statistics For Year 1999 (Based on 2 partial tracts)
A) FHA, FSA/RHS & VA Home Purchase Loans
B) Conventional Home Purchase Loans
C) Refinancings
D) Home Improvement Loans
F) Non-occupant Loans on < 5 Family Dwellings (A B C & D)
Detailed PMIC statistics for the following Tracts:0062.01
, 0063.05
2006 - 2018 National Fire Incident Reporting System (NFIRS) incidents
Based on the data from the years 2006 - 2018 the average number of fires per year is 25. The highest number of fires - 36 took place in 2017, and the least - 12 in 2006. The data has an increasing trend.
When looking into fire subcategories, the most reports belonged to: Structure Fires (40.5%), and Outside Fires (32.3%).
Fire incident types reported to NFIRS in Zip Code 18106


 Nearest zip codes: 18046, 18087, 18104, 18195, 18062, 18069.
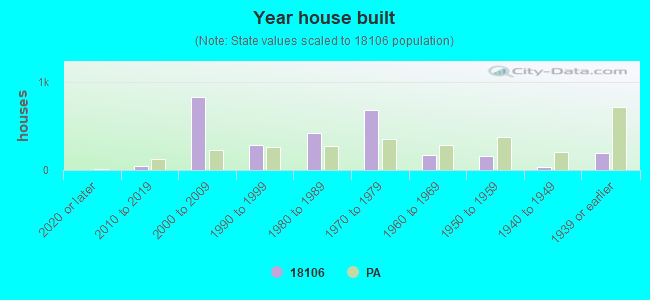


 Based on the data from the years 2006 - 2018 the average number of fires per year is 25. The highest number of fires - 36 took place in 2017, and the least - 12 in 2006. The data has an increasing trend.
 When looking into fire subcategories, the most reports belonged to: Structure Fires (40.5%), and Outside Fires (32.3%).