Estimated zip code population in 2022: 20,488
Zip code population in 2010: 21,265
Zip code population in 2000: 22,070
Houses and condos: 9,783
Renter-occupied apartments: 3,350
% of renters here:
39%State:
31%
March 2022 cost of living index in zip code 18504: 93.4
(less than average, U.S. average is 100)
Land area: 8.6
sq. mi.
Water area: 0.0
sq. mi.
Population density: 2,377 people per square mile (low).
OSM Map
General Map
Google Map
MSN Map
OSM Map
General Map
Google Map
MSN Map
OSM Map
General Map
Google Map
MSN Map
OSM Map
General Map
Google Map
MSN Map
Please wait while loading the map...
Real estate property taxes paid for housing units in 2022:
This zip code:
2.0% ($2,615)Pennsylvania:
1.3% ($3,094)
Median real estate property taxes paid for housing units with mortgages in 2022: $2,625 (1.9%)
Median real estate property taxes paid for housing units with no mortgage in 2022: $2,606 (2.0%)
Profiles of local businesses
Business Search - 14 Million verified businesses
Males: 9,967 Females: 10,520
For population 25 years and over in 18504:
High school or higher: 86.8%Bachelor's degree or higher: 21.3%Graduate or professional degree: 7.3%Unemployed: 5.0%Mean travel time to work (commute): 17.9 minutes
For population 15 years and over in 18504:
Never married: 33.4%Now married: 45.5%Separated: 1.2%Widowed: 6.8%Divorced: 13.1%
Zip code 18504 compared to state average:
Median house value below state average. Black race population percentage significantly below state average. Hispanic race population percentage above state average. Length of stay since moving in significantly above state average. House age above state average. Percentage of population with a bachelor's degree or higher below state average. 14,998 73.2% White 3,847 18.8% Hispanic or Latino 783 3.8% Two or more races 359 1.8% Black 352 1.7% Asian 127 0.6% Some other race 18 0.09% American Indian
Data:
Median household income ($)
Median household income (% change since 2000)
Household income diversity
Ratio of average income to average house value (%)
Ratio of average income to average rent
Median household income ($) - White
Median household income ($) - Black or African American
Median household income ($) - Asian
Median household income ($) - Hispanic or Latino
Median household income ($) - American Indian and Alaska Native
Median household income ($) - Multirace
Median household income ($) - Other Race
Median household income for houses/condos with a mortgage ($)
Median household income for apartments without a mortgage ($)
Races - White alone (%)
Races - White alone (% change since 2000)
Races - Black alone (%)
Races - Black alone (% change since 2000)
Races - American Indian alone (%)
Races - American Indian alone (% change since 2000)
Races - Asian alone (%)
Races - Asian alone (% change since 2000)
Races - Hispanic (%)
Races - Hispanic (% change since 2000)
Races - Native Hawaiian and Other Pacific Islander alone (%)
Races - Native Hawaiian and Other Pacific Islander alone (% change since 2000)
Races - Two or more races (%)
Races - Two or more races (% change since 2000)
Races - Other race alone (%)
Races - Other race alone (% change since 2000)
Racial diversity
Unemployment (%)
Unemployment (% change since 2000)
Unemployment (%) - White
Unemployment (%) - Black or African American
Unemployment (%) - Asian
Unemployment (%) - Hispanic or Latino
Unemployment (%) - American Indian and Alaska Native
Unemployment (%) - Multirace
Unemployment (%) - Other Race
Population density (people per square mile)
Population - Males (%)
Population - Females (%)
Population - Males (%) - White
Population - Males (%) - Black or African American
Population - Males (%) - Asian
Population - Males (%) - Hispanic or Latino
Population - Males (%) - American Indian and Alaska Native
Population - Males (%) - Multirace
Population - Males (%) - Other Race
Population - Females (%) - White
Population - Females (%) - Black or African American
Population - Females (%) - Asian
Population - Females (%) - Hispanic or Latino
Population - Females (%) - American Indian and Alaska Native
Population - Females (%) - Multirace
Population - Females (%) - Other Race
Coronavirus confirmed cases (Apr 27, 2024)
Deaths caused by coronavirus (Apr 27, 2024)
Coronavirus confirmed cases (per 100k population) (Apr 27, 2024)
Deaths caused by coronavirus (per 100k population) (Apr 27, 2024)
Daily increase in number of cases (Apr 27, 2024)
Weekly increase in number of cases (Apr 27, 2024)
Cases doubled (in days) (Apr 27, 2024)
Hospitalized patients (Apr 18, 2022)
Negative test results (Apr 18, 2022)
Total test results (Apr 18, 2022)
COVID Vaccine doses distributed (per 100k population) (Sep 19, 2023)
COVID Vaccine doses administered (per 100k population) (Sep 19, 2023)
COVID Vaccine doses distributed (Sep 19, 2023)
COVID Vaccine doses administered (Sep 19, 2023)
Likely homosexual households (%)
Likely homosexual households (% change since 2000)
Likely homosexual households - Lesbian couples (%)
Likely homosexual households - Lesbian couples (% change since 2000)
Likely homosexual households - Gay men (%)
Likely homosexual households - Gay men (% change since 2000)
Cost of living index
Median gross rent ($)
Median contract rent ($)
Median monthly housing costs ($)
Median house or condo value ($)
Median house or condo value ($ change since 2000)
Mean house or condo value by units in structure - 1, detached ($)
Mean house or condo value by units in structure - 1, attached ($)
Mean house or condo value by units in structure - 2 ($)
Mean house or condo value by units in structure by units in structure - 3 or 4 ($)
Mean house or condo value by units in structure - 5 or more ($)
Mean house or condo value by units in structure - Boat, RV, van, etc. ($)
Mean house or condo value by units in structure - Mobile home ($)
Median house or condo value ($) - White
Median house or condo value ($) - Black or African American
Median house or condo value ($) - Asian
Median house or condo value ($) - Hispanic or Latino
Median house or condo value ($) - American Indian and Alaska Native
Median house or condo value ($) - Multirace
Median house or condo value ($) - Other Race
Median resident age
Resident age diversity
Median resident age - Males
Median resident age - Females
Median resident age - White
Median resident age - Black or African American
Median resident age - Asian
Median resident age - Hispanic or Latino
Median resident age - American Indian and Alaska Native
Median resident age - Multirace
Median resident age - Other Race
Median resident age - Males - White
Median resident age - Males - Black or African American
Median resident age - Males - Asian
Median resident age - Males - Hispanic or Latino
Median resident age - Males - American Indian and Alaska Native
Median resident age - Males - Multirace
Median resident age - Males - Other Race
Median resident age - Females - White
Median resident age - Females - Black or African American
Median resident age - Females - Asian
Median resident age - Females - Hispanic or Latino
Median resident age - Females - American Indian and Alaska Native
Median resident age - Females - Multirace
Median resident age - Females - Other Race
Commute - mean travel time to work (minutes)
Travel time to work - Less than 5 minutes (%)
Travel time to work - Less than 5 minutes (% change since 2000)
Travel time to work - 5 to 9 minutes (%)
Travel time to work - 5 to 9 minutes (% change since 2000)
Travel time to work - 10 to 19 minutes (%)
Travel time to work - 10 to 19 minutes (% change since 2000)
Travel time to work - 20 to 29 minutes (%)
Travel time to work - 20 to 29 minutes (% change since 2000)
Travel time to work - 30 to 39 minutes (%)
Travel time to work - 30 to 39 minutes (% change since 2000)
Travel time to work - 40 to 59 minutes (%)
Travel time to work - 40 to 59 minutes (% change since 2000)
Travel time to work - 60 to 89 minutes (%)
Travel time to work - 60 to 89 minutes (% change since 2000)
Travel time to work - 90 or more minutes (%)
Travel time to work - 90 or more minutes (% change since 2000)
Marital status - Never married (%)
Marital status - Now married (%)
Marital status - Separated (%)
Marital status - Widowed (%)
Marital status - Divorced (%)
Median family income ($)
Median family income (% change since 2000)
Median non-family income ($)
Median non-family income (% change since 2000)
Median per capita income ($)
Median per capita income (% change since 2000)
Median family income ($) - White
Median family income ($) - Black or African American
Median family income ($) - Asian
Median family income ($) - Hispanic or Latino
Median family income ($) - American Indian and Alaska Native
Median family income ($) - Multirace
Median family income ($) - Other Race
Median year house/condo built
Median year apartment built
Year house built - Built 2005 or later (%)
Year house built - Built 2000 to 2004 (%)
Year house built - Built 1990 to 1999 (%)
Year house built - Built 1980 to 1989 (%)
Year house built - Built 1970 to 1979 (%)
Year house built - Built 1960 to 1969 (%)
Year house built - Built 1950 to 1959 (%)
Year house built - Built 1940 to 1949 (%)
Year house built - Built 1939 or earlier (%)
Average household size
Household density (households per square mile)
Average household size - White
Average household size - Black or African American
Average household size - Asian
Average household size - Hispanic or Latino
Average household size - American Indian and Alaska Native
Average household size - Multirace
Average household size - Other Race
Occupied housing units (%)
Vacant housing units (%)
Owner occupied housing units (%)
Renter occupied housing units (%)
Vacancy status - For rent (%)
Vacancy status - For sale only (%)
Vacancy status - Rented or sold, not occupied (%)
Vacancy status - For seasonal, recreational, or occasional use (%)
Vacancy status - For migrant workers (%)
Vacancy status - Other vacant (%)
Residents with income below the poverty level (%)
Residents with income below 50% of the poverty level (%)
Children below poverty level (%)
Poor families by family type - Married-couple family (%)
Poor families by family type - Male, no wife present (%)
Poor families by family type - Female, no husband present (%)
Poverty status for native-born residents (%)
Poverty status for foreign-born residents (%)
Poverty among high school graduates not in families (%)
Poverty among people who did not graduate high school not in families (%)
Residents with income below the poverty level (%) - White
Residents with income below the poverty level (%) - Black or African American
Residents with income below the poverty level (%) - Asian
Residents with income below the poverty level (%) - Hispanic or Latino
Residents with income below the poverty level (%) - American Indian and Alaska Native
Residents with income below the poverty level (%) - Multirace
Residents with income below the poverty level (%) - Other Race
Air pollution - Air Quality Index (AQI)
Air pollution - CO
Air pollution - NO2
Air pollution - SO2
Air pollution - Ozone
Air pollution - PM10
Air pollution - PM25
Air pollution - Pb
Crime - Murders per 100,000 population
Crime - Rapes per 100,000 population
Crime - Robberies per 100,000 population
Crime - Assaults per 100,000 population
Crime - Burglaries per 100,000 population
Crime - Thefts per 100,000 population
Crime - Auto thefts per 100,000 population
Crime - Arson per 100,000 population
Crime - City-data.com crime index
Crime - Violent crime index
Crime - Property crime index
Crime - Murders per 100,000 population (5 year average)
Crime - Rapes per 100,000 population (5 year average)
Crime - Robberies per 100,000 population (5 year average)
Crime - Assaults per 100,000 population (5 year average)
Crime - Burglaries per 100,000 population (5 year average)
Crime - Thefts per 100,000 population (5 year average)
Crime - Auto thefts per 100,000 population (5 year average)
Crime - Arson per 100,000 population (5 year average)
Crime - City-data.com crime index (5 year average)
Crime - Violent crime index (5 year average)
Crime - Property crime index (5 year average)
1996 Presidential Elections Results (%) - Democratic Party (Clinton)
1996 Presidential Elections Results (%) - Republican Party (Dole)
1996 Presidential Elections Results (%) - Other
2000 Presidential Elections Results (%) - Democratic Party (Gore)
2000 Presidential Elections Results (%) - Republican Party (Bush)
2000 Presidential Elections Results (%) - Other
2004 Presidential Elections Results (%) - Democratic Party (Kerry)
2004 Presidential Elections Results (%) - Republican Party (Bush)
2004 Presidential Elections Results (%) - Other
2008 Presidential Elections Results (%) - Democratic Party (Obama)
2008 Presidential Elections Results (%) - Republican Party (McCain)
2008 Presidential Elections Results (%) - Other
2012 Presidential Elections Results (%) - Democratic Party (Obama)
2012 Presidential Elections Results (%) - Republican Party (Romney)
2012 Presidential Elections Results (%) - Other
2016 Presidential Elections Results (%) - Democratic Party (Clinton)
2016 Presidential Elections Results (%) - Republican Party (Trump)
2016 Presidential Elections Results (%) - Other
2020 Presidential Elections Results (%) - Democratic Party (Biden)
2020 Presidential Elections Results (%) - Republican Party (Trump)
2020 Presidential Elections Results (%) - Other
Ancestries Reported - Arab (%)
Ancestries Reported - Czech (%)
Ancestries Reported - Danish (%)
Ancestries Reported - Dutch (%)
Ancestries Reported - English (%)
Ancestries Reported - French (%)
Ancestries Reported - French Canadian (%)
Ancestries Reported - German (%)
Ancestries Reported - Greek (%)
Ancestries Reported - Hungarian (%)
Ancestries Reported - Irish (%)
Ancestries Reported - Italian (%)
Ancestries Reported - Lithuanian (%)
Ancestries Reported - Norwegian (%)
Ancestries Reported - Polish (%)
Ancestries Reported - Portuguese (%)
Ancestries Reported - Russian (%)
Ancestries Reported - Scotch-Irish (%)
Ancestries Reported - Scottish (%)
Ancestries Reported - Slovak (%)
Ancestries Reported - Subsaharan African (%)
Ancestries Reported - Swedish (%)
Ancestries Reported - Swiss (%)
Ancestries Reported - Ukrainian (%)
Ancestries Reported - United States (%)
Ancestries Reported - Welsh (%)
Ancestries Reported - West Indian (%)
Ancestries Reported - Other (%)
Educational Attainment - No schooling completed (%)
Educational Attainment - Less than high school (%)
Educational Attainment - High school or equivalent (%)
Educational Attainment - Less than 1 year of college (%)
Educational Attainment - 1 or more years of college (%)
Educational Attainment - Associate degree (%)
Educational Attainment - Bachelor's degree (%)
Educational Attainment - Master's degree (%)
Educational Attainment - Professional school degree (%)
Educational Attainment - Doctorate degree (%)
School Enrollment - Nursery, preschool (%)
School Enrollment - Kindergarten (%)
School Enrollment - Grade 1 to 4 (%)
School Enrollment - Grade 5 to 8 (%)
School Enrollment - Grade 9 to 12 (%)
School Enrollment - College undergrad (%)
School Enrollment - Graduate or professional (%)
School Enrollment - Not enrolled in school (%)
School enrollment - Public schools (%)
School enrollment - Private schools (%)
School enrollment - Not enrolled (%)
Median number of rooms in houses and condos
Median number of rooms in apartments
Housing units lacking complete plumbing facilities (%)
Housing units lacking complete kitchen facilities (%)
Density of houses
Urban houses (%)
Rural houses (%)
Households with people 60 years and over (%)
Households with people 65 years and over (%)
Households with people 75 years and over (%)
Households with one or more nonrelatives (%)
Households with no nonrelatives (%)
Population in households (%)
Family households (%)
Nonfamily households (%)
Population in families (%)
Family households with own children (%)
Median number of bedrooms in owner occupied houses
Mean number of bedrooms in owner occupied houses
Median number of bedrooms in renter occupied houses
Mean number of bedrooms in renter occupied houses
Median number of vehichles in owner occupied houses
Mean number of vehichles in owner occupied houses
Median number of vehichles in renter occupied houses
Mean number of vehichles in renter occupied houses
Mortgage status - with mortgage (%)
Mortgage status - with second mortgage (%)
Mortgage status - with home equity loan (%)
Mortgage status - with both second mortgage and home equity loan (%)
Mortgage status - without a mortgage (%)
Average family size
Average family size - White
Average family size - Black or African American
Average family size - Asian
Average family size - Hispanic or Latino
Average family size - American Indian and Alaska Native
Average family size - Multirace
Average family size - Other Race
Geographical mobility - Same house 1 year ago (%)
Geographical mobility - Moved within same county (%)
Geographical mobility - Moved from different county within same state (%)
Geographical mobility - Moved from different state (%)
Geographical mobility - Moved from abroad (%)
Place of birth - Born in state of residence (%)
Place of birth - Born in other state (%)
Place of birth - Native, outside of US (%)
Place of birth - Foreign born (%)
Housing units in structures - 1, detached (%)
Housing units in structures - 1, attached (%)
Housing units in structures - 2 (%)
Housing units in structures - 3 or 4 (%)
Housing units in structures - 5 to 9 (%)
Housing units in structures - 10 to 19 (%)
Housing units in structures - 20 to 49 (%)
Housing units in structures - 50 or more (%)
Housing units in structures - Mobile home (%)
Housing units in structures - Boat, RV, van, etc. (%)
House/condo owner moved in on average (years ago)
Renter moved in on average (years ago)
Year householder moved into unit - Moved in 1999 to March 2000 (%)
Year householder moved into unit - Moved in 1995 to 1998 (%)
Year householder moved into unit - Moved in 1990 to 1994 (%)
Year householder moved into unit - Moved in 1980 to 1989 (%)
Year householder moved into unit - Moved in 1970 to 1979 (%)
Year householder moved into unit - Moved in 1969 or earlier (%)
Means of transportation to work - Drove car alone (%)
Means of transportation to work - Carpooled (%)
Means of transportation to work - Public transportation (%)
Means of transportation to work - Bus or trolley bus (%)
Means of transportation to work - Streetcar or trolley car (%)
Means of transportation to work - Subway or elevated (%)
Means of transportation to work - Railroad (%)
Means of transportation to work - Ferryboat (%)
Means of transportation to work - Taxicab (%)
Means of transportation to work - Motorcycle (%)
Means of transportation to work - Bicycle (%)
Means of transportation to work - Walked (%)
Means of transportation to work - Other means (%)
Working at home (%)
Industry diversity
Most Common Industries - Agriculture, forestry, fishing and hunting, and mining (%)
Most Common Industries - Agriculture, forestry, fishing and hunting (%)
Most Common Industries - Mining, quarrying, and oil and gas extraction (%)
Most Common Industries - Construction (%)
Most Common Industries - Manufacturing (%)
Most Common Industries - Wholesale trade (%)
Most Common Industries - Retail trade (%)
Most Common Industries - Transportation and warehousing, and utilities (%)
Most Common Industries - Transportation and warehousing (%)
Most Common Industries - Utilities (%)
Most Common Industries - Information (%)
Most Common Industries - Finance and insurance, and real estate and rental and leasing (%)
Most Common Industries - Finance and insurance (%)
Most Common Industries - Real estate and rental and leasing (%)
Most Common Industries - Professional, scientific, and management, and administrative and waste management services (%)
Most Common Industries - Professional, scientific, and technical services (%)
Most Common Industries - Management of companies and enterprises (%)
Most Common Industries - Administrative and support and waste management services (%)
Most Common Industries - Educational services, and health care and social assistance (%)
Most Common Industries - Educational services (%)
Most Common Industries - Health care and social assistance (%)
Most Common Industries - Arts, entertainment, and recreation, and accommodation and food services (%)
Most Common Industries - Arts, entertainment, and recreation (%)
Most Common Industries - Accommodation and food services (%)
Most Common Industries - Other services, except public administration (%)
Most Common Industries - Public administration (%)
Occupation diversity
Most Common Occupations - Management, business, science, and arts occupations (%)
Most Common Occupations - Management, business, and financial occupations (%)
Most Common Occupations - Management occupations (%)
Most Common Occupations - Business and financial operations occupations (%)
Most Common Occupations - Computer, engineering, and science occupations (%)
Most Common Occupations - Computer and mathematical occupations (%)
Most Common Occupations - Architecture and engineering occupations (%)
Most Common Occupations - Life, physical, and social science occupations (%)
Most Common Occupations - Education, legal, community service, arts, and media occupations (%)
Most Common Occupations - Community and social service occupations (%)
Most Common Occupations - Legal occupations (%)
Most Common Occupations - Education, training, and library occupations (%)
Most Common Occupations - Arts, design, entertainment, sports, and media occupations (%)
Most Common Occupations - Healthcare practitioners and technical occupations (%)
Most Common Occupations - Health diagnosing and treating practitioners and other technical occupations (%)
Most Common Occupations - Health technologists and technicians (%)
Most Common Occupations - Service occupations (%)
Most Common Occupations - Healthcare support occupations (%)
Most Common Occupations - Protective service occupations (%)
Most Common Occupations - Fire fighting and prevention, and other protective service workers including supervisors (%)
Most Common Occupations - Law enforcement workers including supervisors (%)
Most Common Occupations - Food preparation and serving related occupations (%)
Most Common Occupations - Building and grounds cleaning and maintenance occupations (%)
Most Common Occupations - Personal care and service occupations (%)
Most Common Occupations - Sales and office occupations (%)
Most Common Occupations - Sales and related occupations (%)
Most Common Occupations - Office and administrative support occupations (%)
Most Common Occupations - Natural resources, construction, and maintenance occupations (%)
Most Common Occupations - Farming, fishing, and forestry occupations (%)
Most Common Occupations - Construction and extraction occupations (%)
Most Common Occupations - Installation, maintenance, and repair occupations (%)
Most Common Occupations - Production, transportation, and material moving occupations (%)
Most Common Occupations - Production occupations (%)
Most Common Occupations - Transportation occupations (%)
Most Common Occupations - Material moving occupations (%)
People in Group quarters - Institutionalized population (%)
People in Group quarters - Correctional institutions (%)
People in Group quarters - Federal prisons and detention centers (%)
People in Group quarters - Halfway houses (%)
People in Group quarters - Local jails and other confinement facilities (including police lockups) (%)
People in Group quarters - Military disciplinary barracks (%)
People in Group quarters - State prisons (%)
People in Group quarters - Other types of correctional institutions (%)
People in Group quarters - Nursing homes (%)
People in Group quarters - Hospitals/wards, hospices, and schools for the handicapped (%)
People in Group quarters - Hospitals/wards and hospices for chronically ill (%)
People in Group quarters - Hospices or homes for chronically ill (%)
People in Group quarters - Military hospitals or wards for chronically ill (%)
People in Group quarters - Other hospitals or wards for chronically ill (%)
People in Group quarters - Hospitals or wards for drug/alcohol abuse (%)
People in Group quarters - Mental (Psychiatric) hospitals or wards (%)
People in Group quarters - Schools, hospitals, or wards for the mentally retarded (%)
People in Group quarters - Schools, hospitals, or wards for the physically handicapped (%)
People in Group quarters - Institutions for the deaf (%)
People in Group quarters - Institutions for the blind (%)
People in Group quarters - Orthopedic wards and institutions for the physically handicapped (%)
People in Group quarters - Wards in general hospitals for patients who have no usual home elsewhere (%)
People in Group quarters - Wards in military hospitals for patients who have no usual home elsewhere (%)
People in Group quarters - Juvenile institutions (%)
People in Group quarters - Long-term care (%)
People in Group quarters - Homes for abused, dependent, and neglected children (%)
People in Group quarters - Residential treatment centers for emotionally disturbed children (%)
People in Group quarters - Training schools for juvenile delinquents (%)
People in Group quarters - Short-term care, detention or diagnostic centers for delinquent children (%)
People in Group quarters - Type of juvenile institution unknown (%)
People in Group quarters - Noninstitutionalized population (%)
People in Group quarters - College dormitories (includes college quarters off campus) (%)
People in Group quarters - Military quarters (%)
People in Group quarters - On base (%)
People in Group quarters - Barracks, unaccompanied personnel housing (UPH), (Enlisted/Officer), ;and similar group living quarters for military personnel (%)
People in Group quarters - Transient quarters for temporary residents (%)
People in Group quarters - Military ships (%)
People in Group quarters - Group homes (%)
People in Group quarters - Homes or halfway houses for drug/alcohol abuse (%)
People in Group quarters - Homes for the mentally ill (%)
People in Group quarters - Homes for the mentally retarded (%)
People in Group quarters - Homes for the physically handicapped (%)
People in Group quarters - Other group homes (%)
People in Group quarters - Religious group quarters (%)
People in Group quarters - Dormitories (%)
People in Group quarters - Agriculture workers' dormitories on farms (%)
People in Group quarters - Job Corps and vocational training facilities (%)
People in Group quarters - Other workers' dormitories (%)
People in Group quarters - Crews of maritime vessels (%)
People in Group quarters - Other nonhousehold living situations (%)
People in Group quarters - Other noninstitutional group quarters (%)
Residents speaking English at home (%)
Residents speaking English at home - Born in the United States (%)
Residents speaking English at home - Native, born elsewhere (%)
Residents speaking English at home - Foreign born (%)
Residents speaking Spanish at home (%)
Residents speaking Spanish at home - Born in the United States (%)
Residents speaking Spanish at home - Native, born elsewhere (%)
Residents speaking Spanish at home - Foreign born (%)
Residents speaking other language at home (%)
Residents speaking other language at home - Born in the United States (%)
Residents speaking other language at home - Native, born elsewhere (%)
Residents speaking other language at home - Foreign born (%)
Class of Workers - Employee of private company (%)
Class of Workers - Self-employed in own incorporated business (%)
Class of Workers - Private not-for-profit wage and salary workers (%)
Class of Workers - Local government workers (%)
Class of Workers - State government workers (%)
Class of Workers - Federal government workers (%)
Class of Workers - Self-employed workers in own not incorporated business and Unpaid family workers (%)
House heating fuel used in houses and condos - Utility gas (%)
House heating fuel used in houses and condos - Bottled, tank, or LP gas (%)
House heating fuel used in houses and condos - Electricity (%)
House heating fuel used in houses and condos - Fuel oil, kerosene, etc. (%)
House heating fuel used in houses and condos - Coal or coke (%)
House heating fuel used in houses and condos - Wood (%)
House heating fuel used in houses and condos - Solar energy (%)
House heating fuel used in houses and condos - Other fuel (%)
House heating fuel used in houses and condos - No fuel used (%)
House heating fuel used in apartments - Utility gas (%)
House heating fuel used in apartments - Bottled, tank, or LP gas (%)
House heating fuel used in apartments - Electricity (%)
House heating fuel used in apartments - Fuel oil, kerosene, etc. (%)
House heating fuel used in apartments - Coal or coke (%)
House heating fuel used in apartments - Wood (%)
House heating fuel used in apartments - Solar energy (%)
House heating fuel used in apartments - Other fuel (%)
House heating fuel used in apartments - No fuel used (%)
Armed forces status - In Armed Forces (%)
Armed forces status - Civilian (%)
Armed forces status - Civilian - Veteran (%)
Armed forces status - Civilian - Nonveteran (%)
Fatal accidents locations in years 2005-2021
Fatal accidents locations in 2005
Fatal accidents locations in 2006
Fatal accidents locations in 2007
Fatal accidents locations in 2008
Fatal accidents locations in 2009
Fatal accidents locations in 2010
Fatal accidents locations in 2011
Fatal accidents locations in 2012
Fatal accidents locations in 2013
Fatal accidents locations in 2014
Fatal accidents locations in 2015
Fatal accidents locations in 2016
Fatal accidents locations in 2017
Fatal accidents locations in 2018
Fatal accidents locations in 2019
Fatal accidents locations in 2020
Fatal accidents locations in 2021
Alcohol use - People drinking some alcohol every month (%)
Alcohol use - People not drinking at all (%)
Alcohol use - Average days/month drinking alcohol
Alcohol use - Average drinks/week
Alcohol use - Average days/year people drink much
Audiometry - Average condition of hearing (%)
Audiometry - People that can hear a whisper from across a quiet room (%)
Audiometry - People that can hear normal voice from across a quiet room (%)
Audiometry - Ears ringing, roaring, buzzing (%)
Audiometry - Had a job exposure to loud noise (%)
Audiometry - Had off-work exposure to loud noise (%)
Blood Pressure & Cholesterol - Has high blood pressure (%)
Blood Pressure & Cholesterol - Checking blood pressure at home (%)
Blood Pressure & Cholesterol - Frequently checking blood cholesterol (%)
Blood Pressure & Cholesterol - Has high cholesterol level (%)
Consumer Behavior - Money monthly spent on food at supermarket/grocery store
Consumer Behavior - Money monthly spent on food at other stores
Consumer Behavior - Money monthly spent on eating out
Consumer Behavior - Money monthly spent on carryout/delivered foods
Consumer Behavior - Income spent on food at supermarket/grocery store (%)
Consumer Behavior - Income spent on food at other stores (%)
Consumer Behavior - Income spent on eating out (%)
Consumer Behavior - Income spent on carryout/delivered foods (%)
Current Health Status - General health condition (%)
Current Health Status - Blood donors (%)
Current Health Status - Has blood ever tested for HIV virus (%)
Current Health Status - Left-handed people (%)
Dermatology - People using sunscreen (%)
Diabetes - Diabetics (%)
Diabetes - Had a blood test for high blood sugar (%)
Diabetes - People taking insulin (%)
Diet Behavior & Nutrition - Diet health (%)
Diet Behavior & Nutrition - Milk product consumption (# of products/month)
Diet Behavior & Nutrition - Meals not home prepared (#/week)
Diet Behavior & Nutrition - Meals from fast food or pizza place (#/week)
Diet Behavior & Nutrition - Ready-to-eat foods (#/month)
Diet Behavior & Nutrition - Frozen meals/pizza (#/month)
Drug Use - People that ever used marijuana or hashish (%)
Drug Use - Ever used hard drugs (%)
Drug Use - Ever used any form of cocaine (%)
Drug Use - Ever used heroin (%)
Drug Use - Ever used methamphetamine (%)
Health Insurance - People covered by health insurance (%)
Kidney Conditions-Urology - Avg. # of times urinating at night
Medical Conditions - People with asthma (%)
Medical Conditions - People with anemia (%)
Medical Conditions - People with psoriasis (%)
Medical Conditions - People with overweight (%)
Medical Conditions - Elderly people having difficulties in thinking or remembering (%)
Medical Conditions - People who ever received blood transfusion (%)
Medical Conditions - People having trouble seeing even with glass/contacts (%)
Medical Conditions - People with arthritis (%)
Medical Conditions - People with gout (%)
Medical Conditions - People with congestive heart failure (%)
Medical Conditions - People with coronary heart disease (%)
Medical Conditions - People with angina pectoris (%)
Medical Conditions - People who ever had heart attack (%)
Medical Conditions - People who ever had stroke (%)
Medical Conditions - People with emphysema (%)
Medical Conditions - People with thyroid problem (%)
Medical Conditions - People with chronic bronchitis (%)
Medical Conditions - People with any liver condition (%)
Medical Conditions - People who ever had cancer or malignancy (%)
Mental Health - People who have little interest in doing things (%)
Mental Health - People feeling down, depressed, or hopeless (%)
Mental Health - People who have trouble sleeping or sleeping too much (%)
Mental Health - People feeling tired or having little energy (%)
Mental Health - People with poor appetite or overeating (%)
Mental Health - People feeling bad about themself (%)
Mental Health - People who have trouble concentrating on things (%)
Mental Health - People moving or speaking slowly or too fast (%)
Mental Health - People having thoughts they would be better off dead (%)
Oral Health - Average years since last visit a dentist
Oral Health - People embarrassed because of mouth (%)
Oral Health - People with gum disease (%)
Oral Health - General health of teeth and gums (%)
Oral Health - Average days a week using dental floss/device
Oral Health - Average days a week using mouthwash for dental problem
Oral Health - Average number of teeth
Pesticide Use - Households using pesticides to control insects (%)
Pesticide Use - Households using pesticides to kill weeds (%)
Physical Activity - People doing vigorous-intensity work activities (%)
Physical Activity - People doing moderate-intensity work activities (%)
Physical Activity - People walking or bicycling (%)
Physical Activity - People doing vigorous-intensity recreational activities (%)
Physical Activity - People doing moderate-intensity recreational activities (%)
Physical Activity - Average hours a day doing sedentary activities
Physical Activity - Average hours a day watching TV or videos
Physical Activity - Average hours a day using computer
Physical Functioning - People having limitations keeping them from working (%)
Physical Functioning - People limited in amount of work they can do (%)
Physical Functioning - People that need special equipment to walk (%)
Physical Functioning - People experiencing confusion/memory problems (%)
Physical Functioning - People requiring special healthcare equipment (%)
Prescription Medications - Average number of prescription medicines taking
Preventive Aspirin Use - Adults 40+ taking low-dose aspirin (%)
Reproductive Health - Vaginal deliveries (%)
Reproductive Health - Cesarean deliveries (%)
Reproductive Health - Deliveries resulted in a live birth (%)
Reproductive Health - Pregnancies resulted in a delivery (%)
Reproductive Health - Women breastfeeding newborns (%)
Reproductive Health - Women that had a hysterectomy (%)
Reproductive Health - Women that had both ovaries removed (%)
Reproductive Health - Women that have ever taken birth control pills (%)
Reproductive Health - Women taking birth control pills (%)
Reproductive Health - Women that have ever used Depo-Provera or injectables (%)
Reproductive Health - Women that have ever used female hormones (%)
Sexual Behavior - People 18+ that ever had sex (vaginal, anal, or oral) (%)
Sexual Behavior - Males 18+ that ever had vaginal sex with a woman (%)
Sexual Behavior - Males 18+ that ever performed oral sex on a woman (%)
Sexual Behavior - Males 18+ that ever had anal sex with a woman (%)
Sexual Behavior - Males 18+ that ever had any sex with a man (%)
Sexual Behavior - Females 18+ that ever had vaginal sex with a man (%)
Sexual Behavior - Females 18+ that ever performed oral sex on a man (%)
Sexual Behavior - Females 18+ that ever had anal sex with a man (%)
Sexual Behavior - Females 18+ that ever had any kind of sex with a woman (%)
Sexual Behavior - Average age people first had sex
Sexual Behavior - Average number of female sex partners in lifetime (males 18+)
Sexual Behavior - Average number of female vaginal sex partners in lifetime (males 18+)
Sexual Behavior - Average age people first performed oral sex on a woman (18+)
Sexual Behavior - Average number of woman performed oral sex on in lifetime (18+)
Sexual Behavior - Average number of male sex partners in lifetime (males 18+)
Sexual Behavior - Average number of male anal sex partners in lifetime (males 18+)
Sexual Behavior - Average age people first performed oral sex on a man (18+)
Sexual Behavior - Average number of male oral sex partners in lifetime (18+)
Sexual Behavior - People using protection when performing oral sex (%)
Sexual Behavior - Average number of times people have vaginal or anal sex a year
Sexual Behavior - People having sex without condom (%)
Sexual Behavior - Average number of male sex partners in lifetime (females 18+)
Sexual Behavior - Average number of male vaginal sex partners in lifetime (females 18+)
Sexual Behavior - Average number of female sex partners in lifetime (females 18+)
Sexual Behavior - Circumcised males 18+ (%)
Sleep Disorders - Average hours sleeping at night
Sleep Disorders - People that has trouble sleeping (%)
Smoking-Cigarette Use - People smoking cigarettes (%)
Taste & Smell - People 40+ having problems with smell (%)
Taste & Smell - People 40+ having problems with taste (%)
Taste & Smell - People 40+ that ever had wisdom teeth removed (%)
Taste & Smell - People 40+ that ever had tonsils teeth removed (%)
Taste & Smell - People 40+ that ever had a loss of consciousness because of a head injury (%)
Taste & Smell - People 40+ that ever had a broken nose or other serious injury to face or skull (%)
Taste & Smell - People 40+ that ever had two or more sinus infections (%)
Weight - Average height (inches)
Weight - Average weight (pounds)
Weight - Average BMI
Weight - People that are obese (%)
Weight - People that ever were obese (%)
Weight - People trying to lose weight (%)
Urban population: 19,980
Rural population: 507
Estimated median house/condo value in 2022: $133,929
18504:
$133,929Pennsylvania:
$245,500
According to our research of Pennsylvania and other state lists, there were 35 registered sex offenders living in 18504 zip code as of April 27, 2024 . The ratio of all residents to sex offenders in zip code 18504 is 584 to 1.The ratio of registered sex offenders to all residents in this zip code is near the state average.
Median resident age: This zip code:
41.4 yearsPennsylvania median age:
40.9 years
Average household size: This zip code:
2.4 peoplePennsylvania:
2.4 people
Averages for the 2020 tax year for zip code 18504, filed in 2021:
Average Adjusted Gross Income (AGI) in 2020: $44,543 (Individual Income Tax Returns) Here:
$44,543State:
$75,707
Salary/wage: $38,939 (reported on 82.1% of returns )Here:
$38,939State:
$62,806
(% of AGI for various income ranges: 1027.7% for AGIs below $25k , 3295.3% for AGIs $25k-50k , 6101.3% for AGIs $50k-75k , 8756.6% for AGIs $75k-100k , 15315.2% for AGIs $100k-200k , 50580.0% for AGIs over 200k ) Taxable interest for individuals: $797 (reported on 18.9% of returns )This zip code:
$797Pennsylvania:
$1,633
(% of AGI for various income ranges: 9.2% for AGIs below $25k , 9.3% for AGIs $25k-50k , 23.7% for AGIs $50k-75k , 44.3% for AGIs $75k-100k , 88.7% for AGIs $100k-200k , 172.5% for AGIs over 200k ) Ordinary dividends: $2,462 (reported on 13.5% of returns )(% of AGI for various income ranges: 15.0% for AGIs below $25k , 17.2% for AGIs $25k-50k , 54.3% for AGIs $50k-75k , 89.3% for AGIs $75k-100k , 214.3% for AGIs $100k-200k , 810.0% for AGIs over 200k ) Net capital gain/loss in AGI: +$6,444 (reported on 8.6% of returns )Here:
+$6,444State:
+$23,522
(% of AGI for various income ranges: 3.5% for AGIs below $25k , 17.2% for AGIs $25k-50k , 44.4% for AGIs $50k-75k , 122.1% for AGIs $75k-100k , 381.7% for AGIs $100k-200k , 5187.5% for AGIs over 200k ) Profit/loss from business: +$9,399 (reported on 10.0% of returns )Here:
+$9,399State:
+$16,274
(% of AGI for various income ranges: 58.9% for AGIs below $25k , 71.1% for AGIs $25k-50k , 109.0% for AGIs $50k-75k , 240.9% for AGIs $75k-100k , 342.2% for AGIs $100k-200k , 4610.0% for AGIs over 200k ) Taxable individual retirement arrangement distribution: $12,767 (reported on 7.8% of returns )18504:
$12,767Pennsylvania:
$18,583
(% of AGI for various income ranges: 53.0% for AGIs below $25k , 70.2% for AGIs $25k-50k , 150.2% for AGIs $50k-75k , 265.4% for AGIs $75k-100k , 444.8% for AGIs $100k-200k , 3570.0% for AGIs over 200k ) Total itemized deductions: $34,874 (reported on 1.8% of returns )Here:
$34,874State:
$34,850
(% of AGI for various income ranges: 17.0% for AGIs below $25k , 38.0% for AGIs $25k-50k , 106.5% for AGIs $50k-75k , 167.0% for AGIs $75k-100k , 205.2% for AGIs $100k-200k , 4730.0% for AGIs over 200k ) Charity contributions: $4,531 (reported on 1.2% of returns )(% of AGI for various income ranges: 4.6% for AGIs $25k-50k , 8.2% for AGIs $50k-75k , 16.4% for AGIs $75k-100k , 53.3% for AGIs $100k-200k ) Taxes paid: $7,658 (reported on 1.8% of returns )(% of AGI for various income ranges: 11.3% for AGIs $25k-50k , 26.1% for AGIs $50k-75k , 43.4% for AGIs $75k-100k , 73.3% for AGIs $100k-200k , 590.0% for AGIs over 200k ) Earned income credit: $2,318 (reported on 21.0% of returns )(% of AGI for various income ranges: 97.5% for AGIs below $25k , 77.2% for AGIs $25k-50k , 1.4% for AGIs $50k-75k ) Percentage of individuals using paid preparers for their 2020 taxes: 92.2%(% for various income ranges: 91.3% for AGIs below $25k , 94.6% for AGIs $25k-50k , 92.2% for AGIs $50k-75k , 90.9% for AGIs $75k-100k , 89.4% for AGIs $100k-200k , 90.9% for AGIs over 200k )
Averages for the 2012 tax year for zip code 18504, filed in 2013:
Average Adjusted Gross Income (AGI) in 2012: $37,209 (Individual Income Tax Returns) Here:
$37,209State:
$61,346
Salary/wage: $33,993 (reported on 86.0% of returns )Here:
$33,993State:
$51,902
(% of AGI for various income ranges: 76.6% for AGIs below $25k , 82.8% for AGIs $25k-50k , 79.1% for AGIs $50k-75k , 81.2% for AGIs $75k-100k , 78.1% for AGIs $100k-200k , 55.7% for AGIs over 200k ) Taxable interest for individuals: $794 (reported on 26.5% of returns )This zip code:
$794Pennsylvania:
$1,588
(% of AGI for various income ranges: 0.9% for AGIs below $25k , 0.4% for AGIs $25k-50k , 0.6% for AGIs $50k-75k , 0.3% for AGIs $75k-100k , 0.7% for AGIs $100k-200k , 0.2% for AGIs over 200k ) Ordinary dividends: $1,837 (reported on 17.0% of returns )(% of AGI for various income ranges: 1.1% for AGIs below $25k , 0.7% for AGIs $25k-50k , 0.8% for AGIs $50k-75k , 0.9% for AGIs $75k-100k , 0.9% for AGIs $100k-200k , 0.7% for AGIs over 200k ) Net capital gain/loss in AGI: +$2,145 (reported on 9.0% of returns )Here:
+$2,145State:
+$14,495
(% of AGI for various income ranges: 0.3% for AGIs $50k-75k , 0.4% for AGIs $75k-100k , 0.9% for AGIs $100k-200k , 5.1% for AGIs over 200k ) Profit/loss from business: +$10,057 (reported on 8.4% of returns )Here:
+$10,057State:
+$16,268
(% of AGI for various income ranges: 4.2% for AGIs below $25k , 1.7% for AGIs $25k-50k , 1.5% for AGIs $50k-75k , 1.9% for AGIs $75k-100k , 3.2% for AGIs $100k-200k ) Taxable individual retirement arrangement distribution: $9,676 (reported on 8.7% of returns )18504:
$9,676Pennsylvania:
$14,550
(% of AGI for various income ranges: 2.9% for AGIs below $25k , 1.9% for AGIs $25k-50k , 2.1% for AGIs $50k-75k , 2.2% for AGIs $75k-100k , 3.0% for AGIs $100k-200k ) Total itemized deductions: $17,039 (21% of AGI, reported on 17.4% of returns )Here:
$17,039State:
$23,538
Here:
21.1% of AGIState:
18.4% of AGI
(% of AGI for various income ranges: 3.1% for AGIs below $25k , 5.9% for AGIs $25k-50k , 7.3% for AGIs $50k-75k , 9.9% for AGIs $75k-100k , 13.1% for AGIs $100k-200k , 12.0% for AGIs over 200k ) Charity contributions: $1,784 (reported on 13.6% of returns )(% of AGI for various income ranges: 0.2% for AGIs below $25k , 0.5% for AGIs $25k-50k , 0.6% for AGIs $50k-75k , 0.8% for AGIs $75k-100k , 1.2% for AGIs $100k-200k , 0.9% for AGIs over 200k ) Taxes paid: $7,402 (reported on 17.3% of returns )(% of AGI for various income ranges: 0.7% for AGIs below $25k , 1.9% for AGIs $25k-50k , 2.9% for AGIs $50k-75k , 4.6% for AGIs $75k-100k , 6.8% for AGIs $100k-200k , 6.6% for AGIs over 200k ) Earned income credit: $2,283 (reported on 21.1% of returns )(% of AGI for various income ranges: 6.5% for AGIs below $25k , 1.1% for AGIs $25k-50k ) Percentage of individuals using paid preparers for their 2012 taxes: 51.0%(% for various income ranges: 47.4% for AGIs below $25k , 50.9% for AGIs $25k-50k , 54.8% for AGIs $50k-75k , 57.4% for AGIs $75k-100k , 64.3% for AGIs $100k-200k , 80.0% for AGIs over 200k )
Averages for the 2004 tax year for zip code 18504, filed in 2005:
Average Adjusted Gross Income (AGI) in 2004: $31,028 (Individual Income Tax Returns) Here:
$31,028State:
$48,049
Salary/wage: $29,420 (reported on 85.7% of returns )Here:
$29,420State:
$42,646
(% of AGI for various income ranges: 99.7% for AGIs below $10k , 78.5% for AGIs $10k-25k , 84.0% for AGIs $25k-50k , 85.3% for AGIs $50k-75k , 85.1% for AGIs $75k-100k , 65.0% for AGIs over 100k ) Taxable interest for individuals: $1,240 (reported on 42.9% of returns )This zip code:
$1,240Pennsylvania:
$1,657
(% of AGI for various income ranges: 5.3% for AGIs below $10k , 2.4% for AGIs $10k-25k , 1.4% for AGIs $25k-50k , 1.0% for AGIs $50k-75k , 1.2% for AGIs $75k-100k , 2.5% for AGIs over 100k ) Taxable dividends: $1,530 (reported on 22.2% of returns )(% of AGI for various income ranges: 2.7% for AGIs below $10k , 1.0% for AGIs $10k-25k , 0.8% for AGIs $25k-50k , 0.6% for AGIs $50k-75k , 1.3% for AGIs $75k-100k , 2.1% for AGIs over 100k ) Net capital gain/loss: +$2,242 (reported on 13.0% of returns )Here:
+$2,242State:
+$9,716
(% of AGI for various income ranges: -1.4% for AGIs below $10k , 0.3% for AGIs $10k-25k , 0.2% for AGIs $25k-50k , 0.6% for AGIs $50k-75k , 0.5% for AGIs $75k-100k , 4.6% for AGIs over 100k ) Profit/loss from business: +$10,248 (reported on 8.1% of returns )Here:
+$10,248State:
+$14,267
(% of AGI for various income ranges: 3.6% for AGIs below $10k , 3.0% for AGIs $10k-25k , 2.4% for AGIs $25k-50k , 2.3% for AGIs $50k-75k , 1.5% for AGIs $75k-100k , 4.5% for AGIs over 100k ) IRA payment deduction: $2,832 (reported on 2.0% of returns )18504:
$2,832Pennsylvania:
$2,903
(% of AGI for various income ranges: 0.2% for AGIs $10k-25k , 0.2% for AGIs $25k-50k , 0.2% for AGIs $50k-75k , 0.1% for AGIs $75k-100k , 0.2% for AGIs over 100k ) Self-employed pension: $7,500 (reported on 0.1% of returns )Here:
$7,500Pennsylvania:
$14,674
Total itemized deductions: $13,830 (21% of AGI, reported on 18.7% of returns )Here:
$13,830State:
$18,804
Here:
21.0% of AGIState:
19.5% of AGI
(% of AGI for various income ranges: 3.5% for AGIs below $10k , 4.2% for AGIs $10k-25k , 5.8% for AGIs $25k-50k , 10.3% for AGIs $50k-75k , 12.5% for AGIs $75k-100k , 12.2% for AGIs over 100k ) Charity contributions deductions: $1,672 (2% of AGI, reported on 16.6% of returns )Here:
2.4% of AGIState:
3.3% of AGI
(% of AGI for various income ranges: 0.2% for AGIs below $10k , 0.4% for AGIs $10k-25k , 0.6% for AGIs $25k-50k , 1.0% for AGIs $50k-75k , 1.4% for AGIs $75k-100k , 1.6% for AGIs over 100k ) Total tax: $3,830 (reported on 69.1% of returns )(% of AGI for various income ranges: 1.9% for AGIs below $10k , 4.0% for AGIs $10k-25k , 6.9% for AGIs $25k-50k , 8.7% for AGIs $50k-75k , 10.6% for AGIs $75k-100k , 16.0% for AGIs over 100k ) Earned income credit: $1,620 (reported on 17.8% of returns )Percentage of individuals using paid preparers for their 2004 taxes: 53.5%(% for various income ranges: 45.7% for AGIs below $10k , 54.6% for AGIs $10k-25k , 55.5% for AGIs $25k-50k , 58.5% for AGIs $50k-75k , 58.7% for AGIs $75k-100k , 63.9% for AGIs over 100k )
Estimated median household income in 2022: This zip code:
$54,571Pennsylvania:
$71,798
Nearest zip codes: 18517 ,
18503 ,
18508 ,
18411 ,
18509 ,
18505 .
Taylor Zip Code Map
Percentage of family households: This zip code:
43.6%Pennsylvania:
42.6%
Percentage of households with unmarried partners: This zip code:
9.1%Pennsylvania:
46.5%
Likely homosexual households (counted as self-reported same-sex unmarried-partner households)
Lesbian couples: 0.2% of all households Gay men: 0.1% of all households
Household received Food Stamps/SNAP in the past 12 months: 2,035Household did not receive Food Stamps/SNAP in the past 12 months: 6,528
Women who had a birth in the past 12 months: 135 (57 now married , 69 unmarried) Women who did not have a birth in the past 12 months: 4,159 (1,595 now married , 2,565 unmarried)
Housing units in zip code 18504 with a mortgage: 2,554 (357
second mortgage , 285
both second mortgage and home equity loan )
Houses without a mortgage: 200
Median monthly owner costs for units with a mortgage: $1,300
Median monthly owner costs for units without a mortgage: $626
Residents with income below the poverty level in 2022:
This zip code:
15.6%Whole state:
11.8%
Residents with income below 50% of the poverty level in 2022:
This zip code:
9.1%Whole state:
6.1%
Median number of rooms in houses and condos: Median number of rooms in apartments: Notable locations in this zip code not listed on our city pages
Click to draw/clear zip code borders Notable locations in zip code 18504: (A) , Bellevue (B) , South Scranton Station (C) , Scranton Fire Department Engine 7 (D) , Saint Patricks Colliery (E) , Taylor Fire and Rescue Station 95 (F) . Display/hide their locations on the map
Cemeteries: (1) , Washburn Street Cemetery (2) , Stratford Cemetery (3) . Display/hide their locations on the map
Streams, rivers, and creeks: (A) , Lindy Creek (B) . Display/hide their locations on the map
Year house built (houses)
0 2020 or later177 2010 to 2019474 2000 to 2009328 1990 to 1999424 1980 to 1989573 1970 to 1979321 1960 to 1969997 1950 to 1959874 1940 to 19495,426 1939 or earlier
Zip code 18504 household income distribution in 2022 387 Less than $10,000466 $10,000 to $14,999560 $15,000 to $19,999476 $20,000 to $24,999361 $25,000 to $29,999582 $30,000 to $34,999238 $35,000 to $39,999431 $40,000 to $44,999373 $45,000 to $49,999645 $50,000 to $59,999866 $60,000 to $74,9991,104 $75,000 to $99,999720 $100,000 to $124,999482 $125,000 to $149,999457 $150,000 to $199,999356 $200,000 or moreEstimate of home value of owner-occupied houses/condos in 2022 in zip code 18504 21 Less than $10,00013 $10,000 to $14,99910 $15,000 to $19,9994 $20,000 to $24,9999 $25,000 to $29,99929 $30,000 to $34,9996 $35,000 to $39,999119 $40,000 to $49,999119 $50,000 to $59,999166 $60,000 to $69,999600 $70,000 to $79,999218 $80,000 to $89,999266 $90,000 to $99,999790 $100,000 to $124,999425 $125,000 to $149,999448 $150,000 to $174,999447 $175,000 to $199,999352 $200,000 to $249,999341 $250,000 to $299,999131 $300,000 to $399,99987 $400,000 to $499,99925 $500,000 to $749,99978 $750,000 to $999,9995 $1,000,000 to $1,499,999Rent paid by renters in 2022 in zip code 18504 7 $100 to $14931 $150 to $199169 $200 to $24919 $250 to $29982 $300 to $34916 $350 to $399147 $400 to $44959 $450 to $499228 $500 to $549269 $550 to $599226 $600 to $649219 $650 to $699393 $700 to $749159 $750 to $799608 $800 to $899216 $900 to $999182 $1,000 to $1,24926 $1,250 to $1,49953 $1,500 to $1,9999 $2,500 to $2,999160 No cash rent
Median gross rent in 2022: $932.
Median price asked for vacant for-sale houses and condos in 2022: $112,690.
Estimated median house (or condo) value in 2022 for: White Non-Hispanic householders: $132,894Black or African American householders: $77,564Asian householders: $175,469Two or more races householders: $146,511Hispanic or Latino householders: $163,748Estimated median house or condo value in 2022: $133,929
18504:
$133,929Pennsylvania:
$245,500
Lower value quartile - upper value quartile: $96,412 - $198,868
Mean price in 2022: Detached houses: $197,146Here:
$197,146State:
$317,202
Townhouses or other attached units: $158,122Here:
$158,122State:
$254,369
In 2-unit structures: $163,018Here:
$163,018State:
$249,182
In 3-to-4-unit structures: $92,945Here:
$92,945State:
$297,446
Mobile homes: $212,603Here:
$212,603State:
$92,414
Housing units in structures:
One, detached: 5,264One, attached: 1,698Two: 1,3383 or 4: 1,0325 to 9: 12210 to 19: 7620 to 49: 4550 or more: 121Mobile homes: 65Unemployment : 5.0%
Means of transportation to work in zip code 18504 76.9% 7,248 Drove a car alone10.4% 982 Carpooled0.6% 55 Bus or trolley bus0.6% 58 Taxi0.0% 1 Bicycle3.1% 294 Walked0.3% 27 Other means6.3% 594 Worked at homeTravel time to work (commute) in zip code 18504 132 Less than 5 minutes997 5 to 9 minutes2,381 10 to 14 minutes2,128 15 to 19 minutes1,101 20 to 24 minutes424 25 to 29 minutes663 30 to 34 minutes195 35 to 39 minutes135 40 to 44 minutes261 45 to 59 minutes116 60 to 89 minutes79 90 or more minutes
Percentage of zip code residents living and working in this county: 85.0%
Household type by relationship:
Households: 20,488
Male householders: 4,103 (1,138 living alone ), Female householders: 4,410 (1,476 living alone )3,676 spouses (3,583 opposite-sex spouses ), 771 unmarried partners , (760 opposite-sex unmarried partners ), 5,969 children (5,640 natural , 93 adopted , 237 stepchildren ), 279 grandchildren , 209 brothers or sisters , 227 parents , 0 foster children , 247 other relatives , 513 non-relatives In group quarters: 54 (-1 institutionalized population )
Size of family households: 2,359 2-persons , 1,453 3-persons , 966 4-persons , 265 5-persons , 106 6-persons , 155 7-or-more-persons
Size of nonfamily households: 2,614 1-person , 480 2-persons , 70 3-persons , 28 4-persons
2,339 married couples with children. single-parent households (445 men , 1,296 women ).
84.6% of residents of 18504 zip code speak English at home. of residents speak Spanish at home (62% very well, 16% well, 17% not well, 5% not at all ).of residents speak other Indo-European language at home (15% very well, 56% well, 23% not well, 6% not at all ).of residents speak Asian or Pacific Island language at home (26% very well, 35% well, 32% not well, 7% not at all ).
Foreign born population: 1,420 (6.9%)
(47.0%
of them are naturalized citizens )
This zip code:
6.9%Whole state:
7.5%
25% Honduras 18% Dominica 9% Bolivia 8% Guatemala 7% Bhutan 5% Haiti 5% Greece 20% Irish 15% Italian 8% Polish 6% German 5% American 5% English 2% Welsh
Year of entry for the foreign-born population
499 2010 or later 844 2000 to 2009 177 1990 to 1999 479 Before 1990
There are
44 Medical Specialists in Zip Code 18504 .
Facilities with environmental interests located in this zip code:
ARLINGTON IND (1 STAUFFER INDUSTRIAL PARK in SCRANTON, PA)
STATE MASTER (Pennsylvania database) - RCRIS-PAR000505248, HAZARDOUS WASTE PROGRAM Small Quantity Generators, between 100 kg and 1000 kg of hazardous waste/month (Resource Conservation and Recovery Act (tracking hazardous waste)) - notification TRI REPORTER (Tracking of toxic chemicals releasing facilities) Business SIC classification: NONCURRENT-CARRYING WIRING DEVICESOrganizations: STARK THOMAS S (CONTACT/OWNER)
BAMS AUTO BODY (REAR 708 N MAIN AVE in SCRANTON, PA)
Conditionally Exempt Small Quantity Generators, less than 100 kg/month of hazardous waste (Resource Conservation and Recovery Act (tracking hazardous waste)) - notification Organizations: OPERNAME (CONTACT/OPERATOR)
, BILL MOLINARO (CONTACT/OWNER)
Housing units lacking complete plumbing facilities: 1.5%
Housing units lacking complete kitchen facilities: 3.7%
77.1% Utility gas 12.9% Electricity 4.5% Fuel oil, kerosene, etc. 2.3% Bottled, tank, or LP gas 2.0% Coal or coke 0.5% Other fuel
Population in 1990: 22,279.
Place of birth for U.S.-born residents:
This state: 15,123Northeast: 2,659Midwest: 81South: 437West: 91
72% of the 18504 zip code residents lived in the same house 5 years ago.
Out of people who lived in different houses, 85% lived in this county.
Out of people who lived in different counties, 50% lived in Pennsylvania.
92% of the 18504 zip code residents lived in the same house 1 year ago.
Out of people who lived in different houses, 77% moved from this county.
Out of people who lived in different houses, 15% moved from different county within same state.
Out of people who lived in different houses, 7% moved from different state.
Private vs. public school enrollment:
Students in private schools in grades 1 to 8 (elementary and middle school): 159
Here:
8.1%Pennsylvania:
15.7%
Students in private schools in grades 9 to 12 (high school): 107
Here:
8.9%Pennsylvania:
13.4%
Students in private undergraduate colleges: 445
Here:
66.5%Pennsylvania:
39.8%
Occupation by median earnings in the past 12 months ($)
128,097 Fire fighting and prevention, and other protective service workers including supervisors 104,468 Life, physical, and social science occupations 93,585 Law enforcement workers including supervisors 70,225 Health diagnosing and treating practitioners and other technical occupations 66,876 Business and financial operations occupations 62,742 Management occupations
Companies with federal contracts located in this zip code (SCRANTON, PA):
ROBART CONSTRUCTION, INC (320 CRISP AVE; small business) in 11 contracts from 2001 to 2003
Contracts for Maintenance, Repair or Alteration of Real Property -- Office Buildings, Maintenance, Repair or Alteration of Real Property -- Other Utilities, Maintenance, Repair or Alteration of Real Property -- Miscellaneous Buildings by ArmySigned by year: 2000: $0; 2001: $69,000; 2002: $103,036; 2003: $58,466; 2004: $0; 2005: $0; 2006: $0.
Biggest contracts: with Army for Maintenance, Repair or Alteration of Real Property -- Office Buildings. Signed on 2001-10-29. Completion date: 2002-01-07.
, same as above. Signed on 2002-03-06. Completion date: 2002-04-19.
with Army for Maintenance, Repair or Alteration of Real Property -- Other Utilities. Signed on 2002-12-10. Completion date: 2003-01-23.
with Army for Maintenance, Repair or Alteration of Real Property -- Office Buildings. Signed on 2002-07-17. Completion date: 2002-01-17.
JAMES W GERARD, INC. (624 FELLOWS STREET; small business)
$64,300 with Army for Demolition of Buildings. Signed on 1999-12-01. Completion date: 2000-05-31.
MESTEK INC. (888 NORTH KEYSER AVENUE)
$42,646 with Defense Logistics Agency for Aircraft Air Conditioning, Heating, and Pressurizing Equipment. Signed on 2000-05-15. Completion date: 2000-09-12.
KINBACK CORP (1204 SOUTH MAIN AVE; small business) employees , $1700000 revenue
$9,275 with Bureau of Prisoners/Federal Prison System for Construction of Structures and Facilities -- Penal Facilities. Signed on 2005-04-28. Completion date: 2005-05-15.
R J WALKER CO INC (1555 N KEYSER AVE; small business) in 2 contracts from 2005 to 2006
$4,724 with Army for Space and Water Heating Equipment. Signed on 2006-03-15. Completion date: 2006-04-28.
, same as above. Signed on 2005-11-08. Completion date: 2005-11-11.
Top industries in this zip code by the number of employees in 2005:
Construction: Commercial and Institutional Building Construction (100-249 employees: 1 establishment, 20-49 employees: 1 establishment, 5-9 employees: 1 establishment, 1-4 employees: 3 establishments)Professional, Scientific, and Technical Services: Computer Systems Design Services (100-249: 1, 1-4: 1)Wholesale Trade: Home Furnishing Merchant Wholesalers (100-249: 1)Health Care and Social Assistance: Vocational Rehabilitation Services (100-249: 1)Accommodation and Food Services: Limited-Service Restaurants (20-49: 1, 10-19: 3, 1-4: 2)
People in group quarters in 2010:
50 people in nursing facilities/skilled-nursing facilities
34 people in other noninstitutional facilities
3 people in group homes intended for adults
People in group quarters in 2000:
30 people in nursing homes
25 people in other noninstitutional group quarters
24 people in homes for the mentally retarded
10 people in religious group quarters
3 people in other nonhousehold living situations
Fatal accident statistics in 2014:
Fatal accident count: 2Vehicles involved in fatal accidents: 2Fatal accidents caused by drunken drivers: 0Fatalities: 2Persons involved in fatal accidents: 2Pedestrians involved in fatal accidents: 1
Fatal accident statistics in 2010:
Fatal accident count: 1Vehicles involved in fatal accidents: 1Fatal accidents caused by drunken drivers: 0Fatalities: 1Persons involved in fatal accidents: 1Pedestrians involved in fatal accidents: 1
Home Mortgage Disclosure Act Aggregated Statistics For Year 2009(Based on 7 full and 6 partial tracts) A) FHA, FSA/RHS & VA B) Conventional C) Refinancings D) Home Improvement Loans E) Loans on Dwellings For 5+ Families F) Non-occupant Loans on G) Loans On Manufactured Number Average Value Number Average Value Number Average Value Number Average Value Number Average Value Number Average Value Number Average Value
LOANS ORIGINATED 80 $105,942 89 $108,952 407 $114,014 98 $34,824 3 $546,077 36 $96,316 1 $22,830 APPLICATIONS APPROVED, NOT ACCEPTED 5 $74,946 3 $114,557 31 $108,655 6 $20,705 0 $0 0 $0 1 $19,190 APPLICATIONS DENIED 9 $101,096 21 $105,889 203 $118,064 34 $40,319 2 $83,500 13 $88,458 0 $0 APPLICATIONS WITHDRAWN 4 $113,142 6 $197,240 104 $118,312 8 $49,325 0 $0 7 $121,266 0 $0 FILES CLOSED FOR INCOMPLETENESS 3 $149,917 5 $96,028 16 $124,556 0 $0 0 $0 2 $52,460 0 $0
Aggregated Statistics For Year 2008(Based on 7 full and 6 partial tracts) A) FHA, FSA/RHS & VA B) Conventional C) Refinancings D) Home Improvement Loans F) Non-occupant Loans on G) Loans On Manufactured Number Average Value Number Average Value Number Average Value Number Average Value Number Average Value Number Average Value
LOANS ORIGINATED 43 $106,815 134 $97,785 294 $93,405 118 $33,881 66 $80,588 4 $38,138 APPLICATIONS APPROVED, NOT ACCEPTED 1 $112,000 20 $103,160 49 $88,964 16 $18,832 8 $99,629 1 $12,900 APPLICATIONS DENIED 15 $99,794 39 $100,008 269 $104,819 95 $46,605 52 $83,308 5 $42,562 APPLICATIONS WITHDRAWN 9 $92,520 28 $125,827 94 $119,441 12 $90,178 12 $104,582 0 $0 FILES CLOSED FOR INCOMPLETENESS 0 $0 3 $114,243 30 $157,610 4 $48,278 3 $125,267 0 $0
Aggregated Statistics For Year 2007(Based on 7 full and 6 partial tracts) A) FHA, FSA/RHS & VA B) Conventional C) Refinancings D) Home Improvement Loans E) Loans on Dwellings For 5+ Families F) Non-occupant Loans on G) Loans On Manufactured Number Average Value Number Average Value Number Average Value Number Average Value Number Average Value Number Average Value Number Average Value
LOANS ORIGINATED 21 $109,532 246 $96,276 436 $87,516 172 $43,314 0 $0 122 $86,090 1 $32,420 APPLICATIONS APPROVED, NOT ACCEPTED 0 $0 53 $98,511 79 $89,339 28 $71,919 0 $0 28 $95,111 2 $34,705 APPLICATIONS DENIED 4 $125,000 88 $92,923 389 $99,642 101 $41,642 2 $128,350 58 $92,706 5 $33,640 APPLICATIONS WITHDRAWN 1 $100,000 30 $118,742 164 $109,713 29 $66,496 0 $0 12 $87,477 0 $0 FILES CLOSED FOR INCOMPLETENESS 0 $0 4 $168,535 55 $102,913 1 $201,730 0 $0 2 $95,970 0 $0
Aggregated Statistics For Year 2006(Based on 7 full and 6 partial tracts) A) FHA, FSA/RHS & VA B) Conventional C) Refinancings D) Home Improvement Loans E) Loans on Dwellings For 5+ Families F) Non-occupant Loans on G) Loans On Manufactured Number Average Value Number Average Value Number Average Value Number Average Value Number Average Value Number Average Value Number Average Value
LOANS ORIGINATED 26 $116,999 432 $88,600 481 $82,231 173 $40,195 4 $199,592 181 $82,550 1 $30,620 APPLICATIONS APPROVED, NOT ACCEPTED 1 $74,000 66 $82,002 113 $84,995 15 $21,138 1 $206,870 41 $70,232 1 $17,530 APPLICATIONS DENIED 4 $79,195 143 $89,126 473 $99,015 112 $48,548 1 $188,060 63 $73,949 2 $47,470 APPLICATIONS WITHDRAWN 4 $105,740 68 $76,113 297 $95,838 16 $128,323 0 $0 30 $84,706 0 $0 FILES CLOSED FOR INCOMPLETENESS 0 $0 50 $96,202 70 $104,144 1 $78,070 0 $0 13 $76,385 1 $116,000
Aggregated Statistics For Year 2005(Based on 7 full and 6 partial tracts) A) FHA, FSA/RHS & VA B) Conventional C) Refinancings D) Home Improvement Loans E) Loans on Dwellings For 5+ Families F) Non-occupant Loans on G) Loans On Manufactured Number Average Value Number Average Value Number Average Value Number Average Value Number Average Value Number Average Value Number Average Value
LOANS ORIGINATED 20 $93,468 377 $85,759 511 $80,769 131 $36,216 9 $134,743 170 $81,095 0 $0 APPLICATIONS APPROVED, NOT ACCEPTED 4 $64,078 66 $77,151 118 $80,115 18 $44,377 1 $132,820 31 $77,574 1 $21,500 APPLICATIONS DENIED 7 $100,834 170 $78,413 503 $89,459 112 $45,709 1 $72,000 85 $75,692 7 $28,464 APPLICATIONS WITHDRAWN 0 $0 73 $84,865 298 $94,320 33 $97,672 1 $249,180 38 $90,483 1 $157,820 FILES CLOSED FOR INCOMPLETENESS 0 $0 17 $65,415 30 $102,976 7 $34,973 0 $0 2 $64,910 1 $89,000
Aggregated Statistics For Year 2004(Based on 7 full and 6 partial tracts) A) FHA, FSA/RHS & VA B) Conventional C) Refinancings D) Home Improvement Loans E) Loans on Dwellings For 5+ Families F) Non-occupant Loans on G) Loans On Manufactured Number Average Value Number Average Value Number Average Value Number Average Value Number Average Value Number Average Value Number Average Value
LOANS ORIGINATED 24 $84,761 301 $85,052 596 $72,804 169 $34,984 4 $61,192 111 $63,718 1 $53,260 APPLICATIONS APPROVED, NOT ACCEPTED 6 $87,163 33 $74,212 131 $77,790 29 $40,568 0 $0 24 $53,092 0 $0 APPLICATIONS DENIED 12 $93,701 87 $79,216 465 $80,788 102 $36,948 1 $465,000 47 $59,995 4 $53,385 APPLICATIONS WITHDRAWN 3 $103,310 37 $98,041 263 $85,675 17 $44,062 1 $94,620 13 $70,991 2 $59,665 FILES CLOSED FOR INCOMPLETENESS 0 $0 11 $60,135 55 $92,266 7 $27,696 1 $67,000 1 $112,000 0 $0
Aggregated Statistics For Year 2003(Based on 7 full and 6 partial tracts) A) FHA, FSA/RHS & VA B) Conventional C) Refinancings D) Home Improvement Loans E) Loans on Dwellings For 5+ Families F) Non-occupant Loans on Number Average Value Number Average Value Number Average Value Number Average Value Number Average Value Number Average Value
LOANS ORIGINATED 40 $72,738 298 $81,911 895 $72,734 111 $32,379 6 $66,617 99 $59,452 APPLICATIONS APPROVED, NOT ACCEPTED 0 $0 46 $72,593 188 $70,902 21 $32,231 0 $0 25 $59,706 APPLICATIONS DENIED 5 $68,646 83 $77,500 527 $76,412 88 $31,020 0 $0 42 $53,831 APPLICATIONS WITHDRAWN 2 $91,500 28 $74,027 242 $86,174 15 $30,378 0 $0 15 $64,217 FILES CLOSED FOR INCOMPLETENESS 0 $0 11 $69,185 35 $76,496 2 $42,935 0 $0 5 $67,722
Aggregated Statistics For Year 2002(Based on 7 full and 6 partial tracts) A) FHA, FSA/RHS & VA B) Conventional C) Refinancings D) Home Improvement Loans E) Loans on Dwellings For 5+ Families F) Non-occupant Loans on Number Average Value Number Average Value Number Average Value Number Average Value Number Average Value Number Average Value
LOANS ORIGINATED 49 $74,178 197 $79,223 574 $70,241 112 $25,870 3 $92,000 69 $52,507 APPLICATIONS APPROVED, NOT ACCEPTED 3 $118,903 37 $73,822 149 $65,759 8 $24,072 0 $0 11 $40,840 APPLICATIONS DENIED 4 $73,735 45 $49,732 394 $70,959 51 $22,081 1 $154,000 22 $51,609 APPLICATIONS WITHDRAWN 2 $92,000 25 $88,094 181 $78,943 4 $22,482 1 $202,000 10 $59,339 FILES CLOSED FOR INCOMPLETENESS 0 $0 8 $56,926 30 $85,593 0 $0 0 $0 4 $89,442
Aggregated Statistics For Year 2001(Based on 7 full and 6 partial tracts) A) FHA, FSA/RHS & VA B) Conventional C) Refinancings D) Home Improvement Loans E) Loans on Dwellings For 5+ Families F) Non-occupant Loans on Number Average Value Number Average Value Number Average Value Number Average Value Number Average Value Number Average Value
LOANS ORIGINATED 41 $62,791 161 $61,851 520 $65,716 121 $27,578 2 $259,000 57 $50,298 APPLICATIONS APPROVED, NOT ACCEPTED 2 $70,500 34 $56,566 122 $65,414 37 $29,688 0 $0 9 $50,183 APPLICATIONS DENIED 0 $0 59 $43,714 373 $66,967 70 $25,976 1 $60,000 32 $65,155 APPLICATIONS WITHDRAWN 0 $0 16 $68,172 225 $77,062 33 $32,452 0 $0 11 $66,535 FILES CLOSED FOR INCOMPLETENESS 0 $0 2 $54,000 41 $58,788 3 $31,347 0 $0 0 $0
Aggregated Statistics For Year 2000(Based on 7 full and 6 partial tracts) A) FHA, FSA/RHS & VA B) Conventional C) Refinancings D) Home Improvement Loans E) Loans on Dwellings For 5+ Families F) Non-occupant Loans on Number Average Value Number Average Value Number Average Value Number Average Value Number Average Value Number Average Value
LOANS ORIGINATED 41 $70,764 140 $58,889 249 $49,314 144 $23,269 2 $85,540 50 $44,406 APPLICATIONS APPROVED, NOT ACCEPTED 1 $111,000 31 $52,598 99 $59,234 35 $24,541 0 $0 8 $28,424 APPLICATIONS DENIED 5 $68,374 57 $45,547 234 $61,928 79 $26,101 0 $0 13 $41,162 APPLICATIONS WITHDRAWN 1 $69,850 22 $68,183 174 $68,539 11 $37,932 0 $0 4 $137,012 FILES CLOSED FOR INCOMPLETENESS 0 $0 0 $0 31 $59,734 0 $0 0 $0 0 $0
Aggregated Statistics For Year 1999(Based on 6 full and 4 partial tracts) A) FHA, FSA/RHS & VA B) Conventional C) Refinancings D) Home Improvement Loans F) Non-occupant Loans on Number Average Value Number Average Value Number Average Value Number Average Value Number Average Value
LOANS ORIGINATED 27 $70,168 122 $54,669 314 $53,685 85 $24,531 32 $59,520 APPLICATIONS APPROVED, NOT ACCEPTED 2 $65,500 21 $43,565 122 $56,593 23 $31,231 11 $42,145 APPLICATIONS DENIED 1 $76,790 44 $49,282 205 $55,745 53 $20,023 11 $41,575 APPLICATIONS WITHDRAWN 2 $51,775 16 $72,877 130 $63,616 10 $25,421 5 $76,028 FILES CLOSED FOR INCOMPLETENESS 0 $0 6 $66,065 15 $57,523 1 $5,000 4 $49,362
Private Mortgage Insurance Companies Aggregated Statistics For Year 2009(Based on 6 full and 6 partial tracts) A) Conventional B) Refinancings Number Average Value Number Average Value
LOANS ORIGINATED 11 $97,975 12 $164,110 APPLICATIONS APPROVED, NOT ACCEPTED 8 $82,866 7 $155,037 APPLICATIONS DENIED 12 $157,666 1 $68,140 APPLICATIONS WITHDRAWN 0 $0 2 $100,075 FILES CLOSED FOR INCOMPLETENESS 0 $0 0 $0
Aggregated Statistics For Year 2008(Based on 7 full and 6 partial tracts) A) Conventional B) Refinancings C) Non-occupant Loans on Number Average Value Number Average Value Number Average Value
LOANS ORIGINATED 44 $108,199 25 $131,647 9 $70,377 APPLICATIONS APPROVED, NOT ACCEPTED 23 $148,766 32 $173,622 9 $116,796 APPLICATIONS DENIED 5 $73,968 3 $212,207 1 $67,000 APPLICATIONS WITHDRAWN 5 $103,686 6 $129,892 1 $45,000 FILES CLOSED FOR INCOMPLETENESS 1 $81,100 1 $82,000 1 $82,000
Aggregated Statistics For Year 2007(Based on 7 full and 6 partial tracts) A) Conventional B) Refinancings C) Non-occupant Loans on Number Average Value Number Average Value Number Average Value
LOANS ORIGINATED 82 $107,306 33 $131,948 16 $87,527 APPLICATIONS APPROVED, NOT ACCEPTED 11 $105,516 10 $121,932 3 $85,000 APPLICATIONS DENIED 8 $113,015 0 $0 0 $0 APPLICATIONS WITHDRAWN 1 $42,310 2 $166,380 0 $0 FILES CLOSED FOR INCOMPLETENESS 1 $82,000 0 $0 0 $0
Aggregated Statistics For Year 2006(Based on 7 full and 6 partial tracts) A) Conventional B) Refinancings C) Non-occupant Loans on Number Average Value Number Average Value Number Average Value
LOANS ORIGINATED 88 $100,289 20 $123,705 15 $97,113 APPLICATIONS APPROVED, NOT ACCEPTED 9 $132,502 7 $123,923 0 $0 APPLICATIONS DENIED 8 $74,276 0 $0 7 $64,479 APPLICATIONS WITHDRAWN 4 $80,000 2 $151,000 0 $0 FILES CLOSED FOR INCOMPLETENESS 0 $0 0 $0 0 $0
Aggregated Statistics For Year 2005(Based on 7 full and 6 partial tracts) A) Conventional B) Refinancings C) Non-occupant Loans on Number Average Value Number Average Value Number Average Value
LOANS ORIGINATED 90 $106,738 25 $100,106 30 $84,760 APPLICATIONS APPROVED, NOT ACCEPTED 10 $81,307 9 $89,577 3 $59,080 APPLICATIONS DENIED 3 $88,550 1 $105,790 3 $91,683 APPLICATIONS WITHDRAWN 9 $86,082 2 $54,230 6 $80,558 FILES CLOSED FOR INCOMPLETENESS 0 $0 1 $128,000 0 $0
Aggregated Statistics For Year 2004(Based on 7 full and 6 partial tracts) A) Conventional B) Refinancings C) Non-occupant Loans on Number Average Value Number Average Value Number Average Value
LOANS ORIGINATED 69 $90,833 32 $96,566 9 $66,752 APPLICATIONS APPROVED, NOT ACCEPTED 13 $100,422 6 $112,942 2 $39,670 APPLICATIONS DENIED 2 $87,000 4 $84,035 0 $0 APPLICATIONS WITHDRAWN 5 $157,476 2 $74,105 1 $88,000 FILES CLOSED FOR INCOMPLETENESS 1 $72,000 0 $0 0 $0
Aggregated Statistics For Year 2003(Based on 7 full and 6 partial tracts) A) Conventional B) Refinancings C) Non-occupant Loans on Number Average Value Number Average Value Number Average Value
LOANS ORIGINATED 98 $84,083 61 $91,580 12 $64,558 APPLICATIONS APPROVED, NOT ACCEPTED 14 $110,231 13 $99,969 1 $92,000 APPLICATIONS DENIED 4 $70,672 2 $165,740 0 $0 APPLICATIONS WITHDRAWN 6 $106,462 5 $151,684 2 $74,000 FILES CLOSED FOR INCOMPLETENESS 1 $90,230 1 $77,000 0 $0
Aggregated Statistics For Year 2002(Based on 7 full and 6 partial tracts) A) Conventional B) Refinancings C) Non-occupant Loans on Number Average Value Number Average Value Number Average Value
LOANS ORIGINATED 61 $70,135 39 $92,432 6 $40,333 APPLICATIONS APPROVED, NOT ACCEPTED 4 $76,250 6 $96,722 2 $33,500 APPLICATIONS DENIED 4 $114,222 0 $0 1 $177,000 APPLICATIONS WITHDRAWN 9 $64,882 3 $64,333 1 $47,000 FILES CLOSED FOR INCOMPLETENESS 0 $0 0 $0 0 $0
Aggregated Statistics For Year 2001(Based on 7 full and 6 partial tracts) A) Conventional B) Refinancings C) Non-occupant Loans on Number Average Value Number Average Value Number Average Value
LOANS ORIGINATED 44 $70,909 33 $77,851 0 $0 APPLICATIONS APPROVED, NOT ACCEPTED 5 $48,658 6 $98,097 1 $87,190 APPLICATIONS DENIED 0 $0 0 $0 0 $0 APPLICATIONS WITHDRAWN 1 $88,080 2 $59,065 0 $0 FILES CLOSED FOR INCOMPLETENESS 0 $0 0 $0 0 $0
Aggregated Statistics For Year 2000(Based on 6 full and 6 partial tracts) A) Conventional B) Refinancings C) Non-occupant Loans on Number Average Value Number Average Value Number Average Value
LOANS ORIGINATED 40 $69,148 14 $76,953 1 $69,000 APPLICATIONS APPROVED, NOT ACCEPTED 5 $105,428 5 $64,238 0 $0 APPLICATIONS DENIED 2 $35,955 0 $0 0 $0 APPLICATIONS WITHDRAWN 2 $35,265 0 $0 0 $0 FILES CLOSED FOR INCOMPLETENESS 1 $33,000 0 $0 0 $0
Aggregated Statistics For Year 1999(Based on 6 full and 4 partial tracts) A) Conventional B) Refinancings C) Non-occupant Loans on Number Average Value Number Average Value Number Average Value
LOANS ORIGINATED 28 $73,117 10 $78,006 1 $58,000 APPLICATIONS APPROVED, NOT ACCEPTED 5 $70,450 2 $106,660 0 $0 APPLICATIONS DENIED 4 $40,925 1 $60,000 0 $0 APPLICATIONS WITHDRAWN 0 $0 0 $0 0 $0 FILES CLOSED FOR INCOMPLETENESS 0 $0 0 $0 0 $0
2006 - 2018 National Fire Incident Reporting System (NFIRS) incidents See full 2006 National Fire Incident Reporting System statistics for zip code 18504, Pennsylvania
Most common first names in zip code 18504 among deceased individuals Name Count Lived (average)
Mary 549 79.6 years John 523 73.0 years Joseph 368 71.4 years William 300 72.8 years Helen 239 78.8 years Anna 215 80.8 years Margaret 203 78.0 years Robert 181 68.5 years Frank 170 75.7 years Thomas 162 69.6 years
Most common last names in zip code 18504 among deceased individuals Last name Count Lived (average)
Jones 129 78.1 years Williams 106 76.9 years Davis 100 73.7 years Evans 85 77.4 years Thomas 73 75.5 years Morgan 59 77.3 years Smith 56 74.3 years Lewis 45 78.3 years Walsh 43 75.2 years Hughes 40 75.2 years
Businesses in zip code 18504
Name Count Name Count
Advance Auto Parts 1 Little Caesars Pizza 1 AutoZone 1 MasterBrand Cabinets 1 Blockbuster 1 McDonald's 1 Burger King 1 Rite Aid 2 CVS 1 SAS Shoes 1 Curves 1 U-Haul 1 FedEx 1 Volkswagen 1 Kroger 2 Walgreens 1

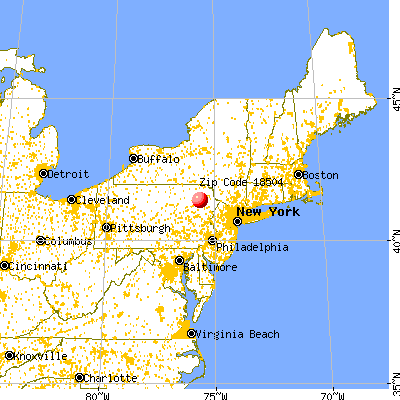


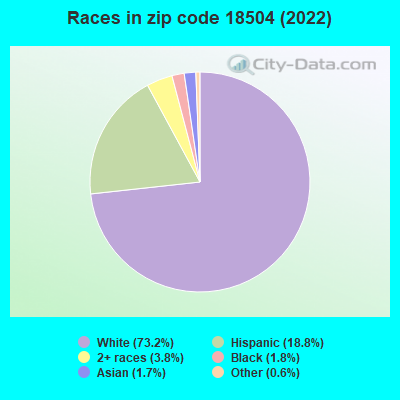


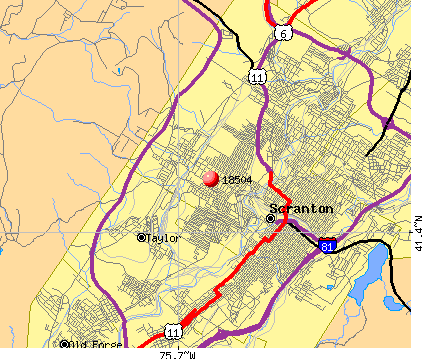 Nearest zip codes: 18517, 18503, 18508, 18411, 18509, 18505.
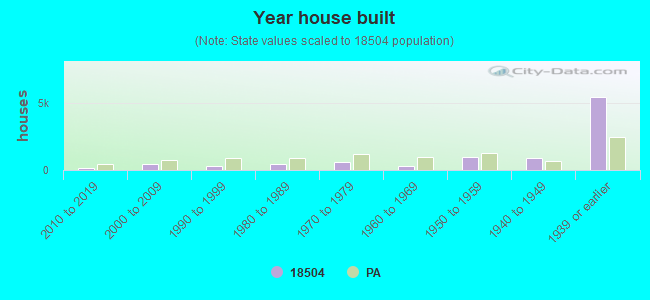
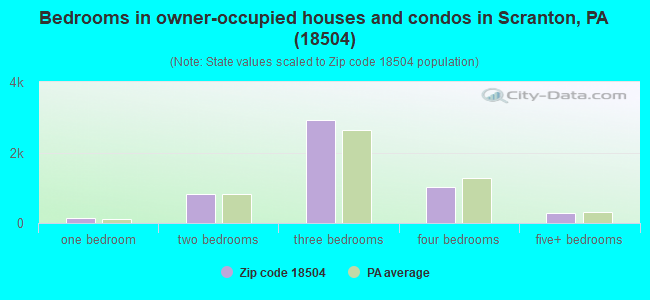
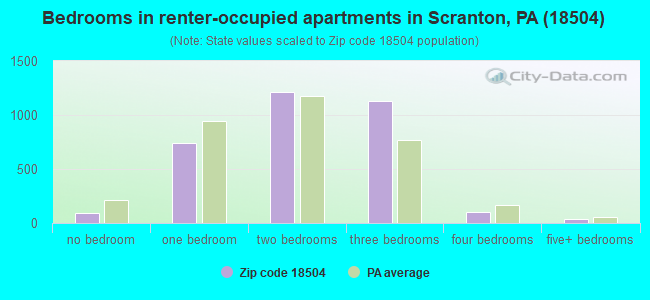
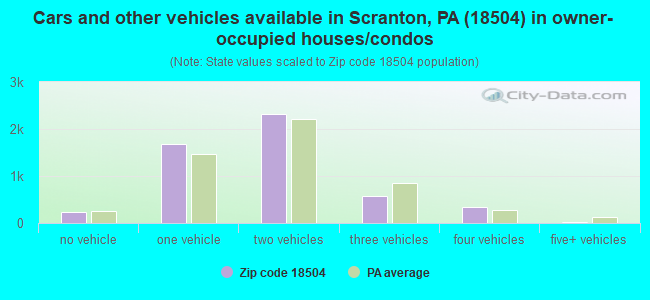
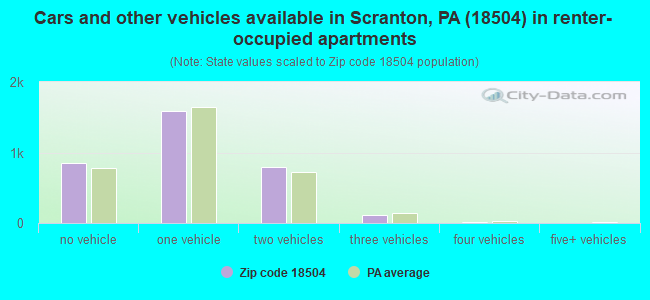


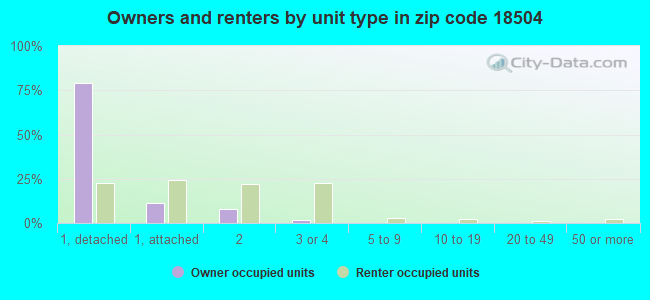
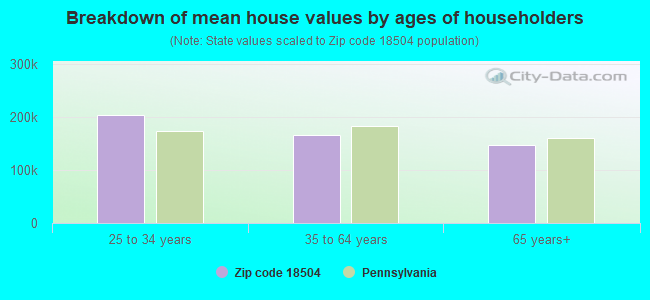


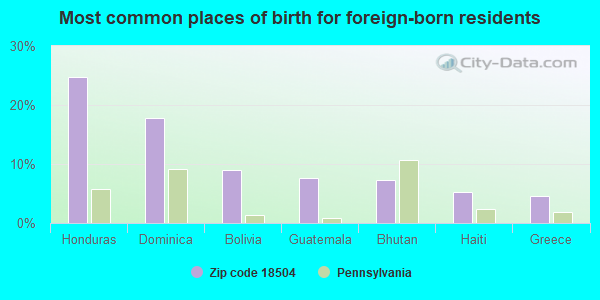
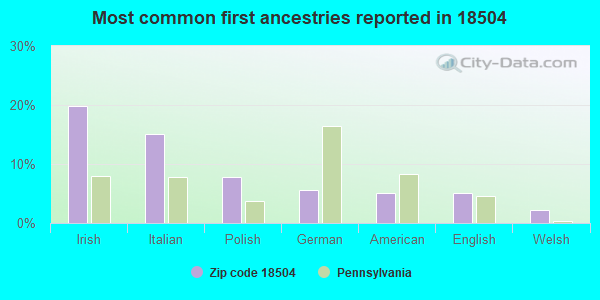
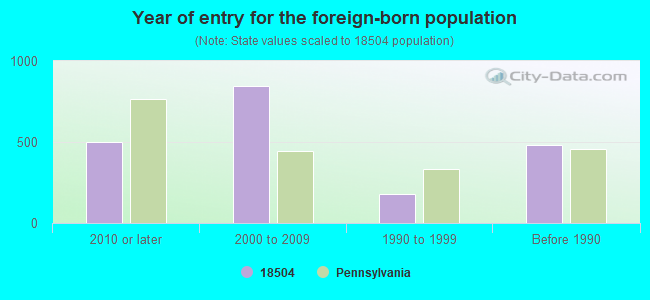


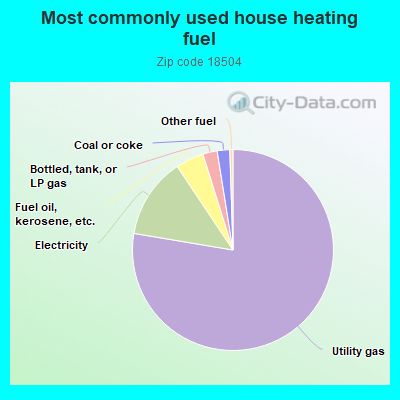
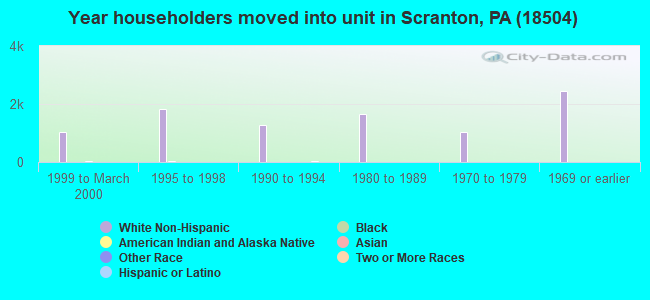
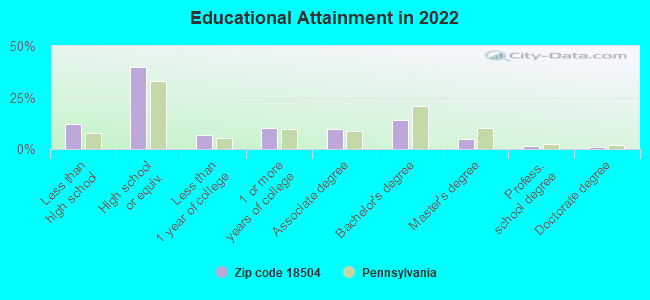
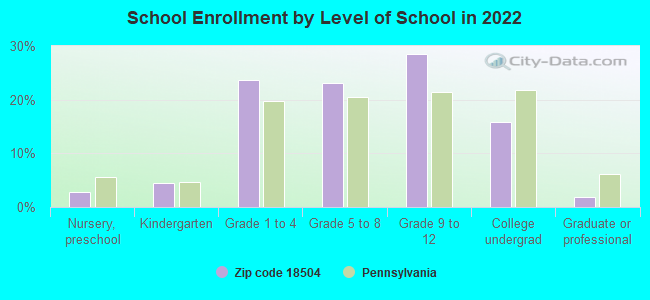
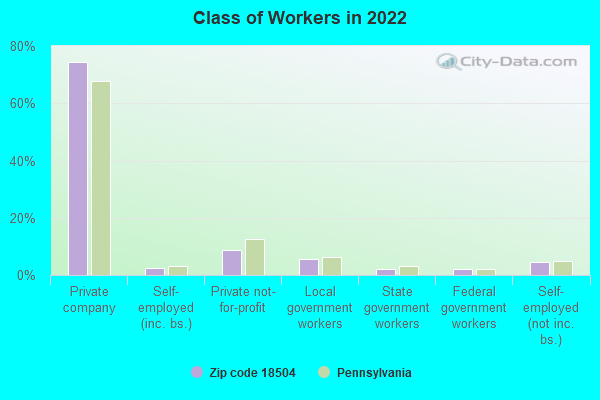
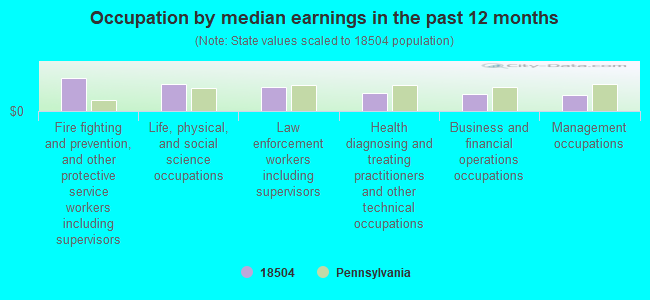
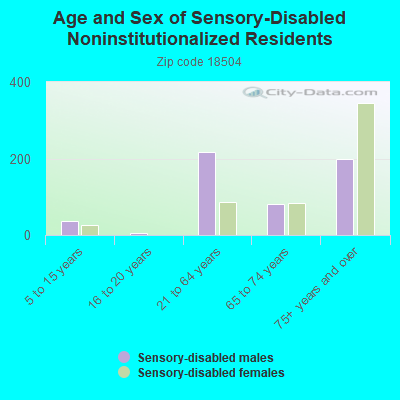
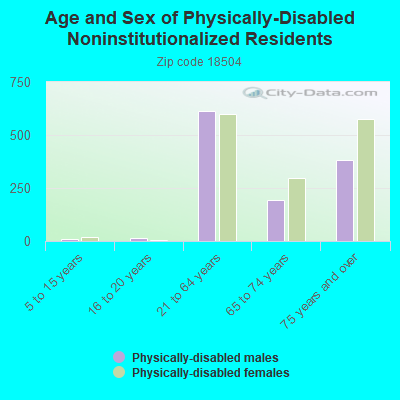
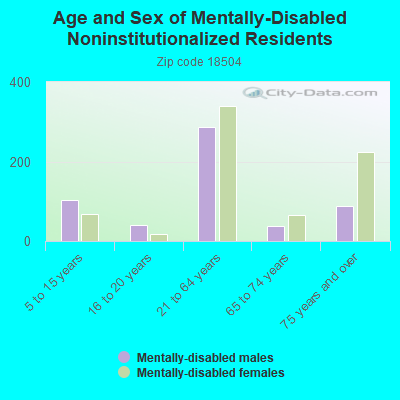
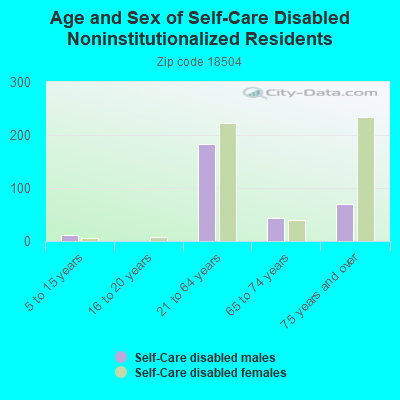
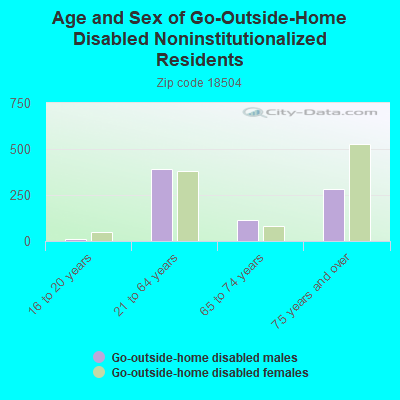
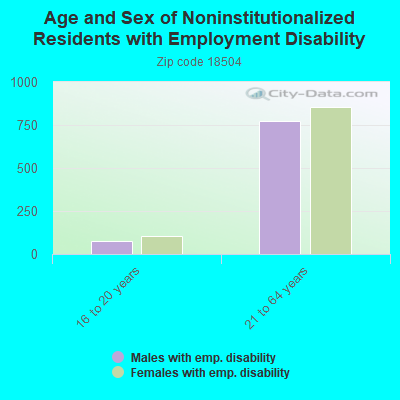
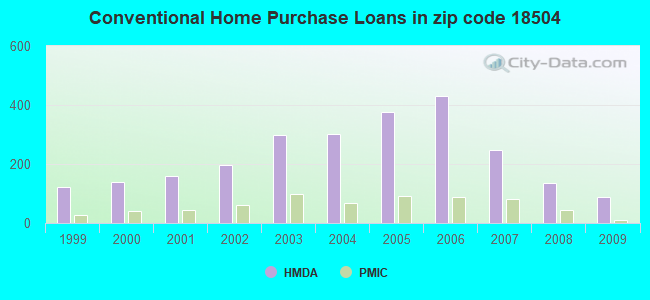
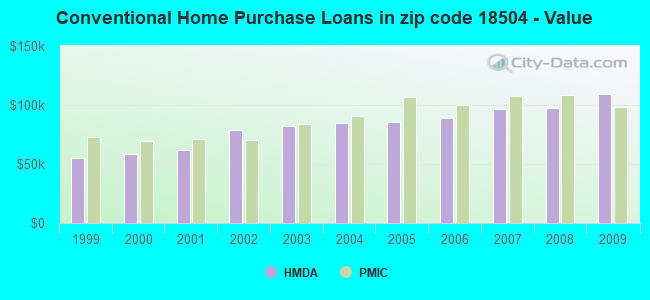
 According to the data from the years 2006 - 2018 the average number of fires per year is 31. The highest number of fires - 76 took place in 2015, and the least - 0 in 2012. The data has a growing trend.
 When looking into fire subcategories, the most incidents belonged to: Structure Fires (48.9%), and Outside Fires (33.8%).