Estimated zip code population in 2022: 22,322 Zip code population in 2010: 19,795 Zip code population in 2000: 15,679
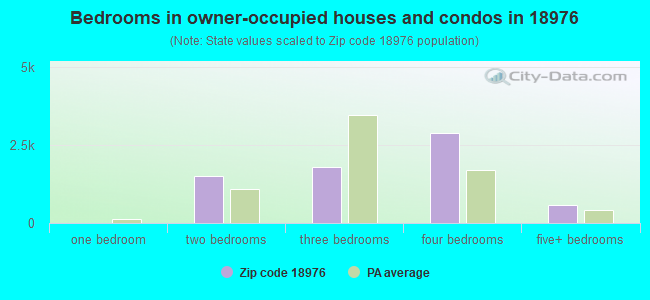
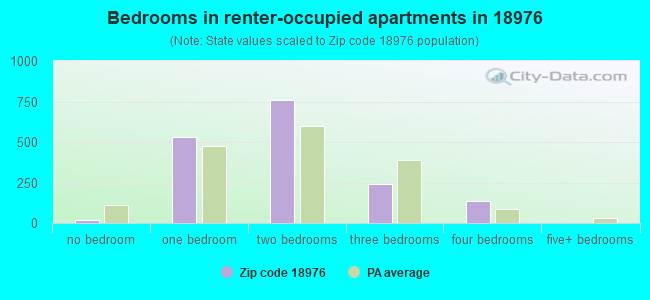
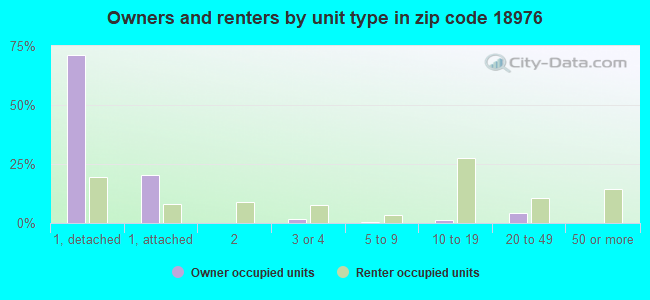
Houses and condos: 8,481 Renter-occupied apartments: 1,687
% of renters here:
20%
State:
31%
March 2022 cost of living index in zip code 18976: 105.9 (more than average, U.S. average is 100)
Land area: 10.8 sq. mi. Water area: 0.1 sq. mi.
Population density: 2,061 people per square mile
(low).
OSM Map
General Map
Google Map
MSN Map
OSM Map
General Map
Google Map
MSN Map
OSM Map
General Map
Google Map
MSN Map
OSM Map
General Map
Google Map
MSN Map
Please wait while loading the map...
Real estate property taxes paid for housing units in 2022:
This zip code:
1.2% ($5,992)
Pennsylvania:
1.3% ($3,094)
Median real estate property taxes paid for housing units with mortgages in 2022: $6,312 (1.2%) Median real estate property taxes paid for housing units with no mortgage in 2022: $5,577 (1.2%)
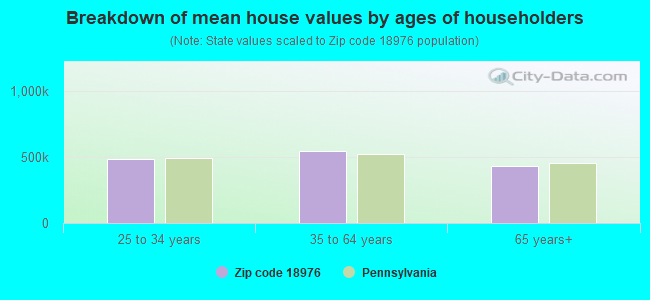
Estimated median house/condo value in 2022: $511,187
18976:
$511,187
Pennsylvania:
$245,500
According to our research of Pennsylvania and other state lists, there were 9 registered sex offenders living in 18976 zip code as of April 27, 2024. The ratio of all residents to sex offenders in zip code 18976 is 2,233 to 1. The ratio of registered sex offenders to all residents in this zip code is much lower than the state average.
Median resident age:
This zip code:
47.2 years
Pennsylvania median age:
40.9 years
Average household size:
This zip code:
2.6 people
Pennsylvania:
2.4 people
Averages for the 2020 tax year for zip code 18976, filed in 2021:
Average Adjusted Gross Income (AGI) in 2020: $103,692 (Individual Income Tax Returns)
Here:
$103,692
State:
$75,707
Salary/wage: $92,046 (reported on 79.2% of returns)
Here:
$92,046
State:
$62,806
(% of AGI for various income ranges: 1139.9% for AGIs below $25k, 3441.6% for AGIs $25k-50k, 6335.5% for AGIs $50k-75k, 8828.9% for AGIs $75k-100k, 18738.9% for AGIs $100k-200k, 75489.2% for AGIs over 200k)
Taxable interest for individuals: $1,462 (reported on 47.2% of returns)
This zip code:
$1,462
Pennsylvania:
$1,633
(% of AGI for various income ranges: 38.6% for AGIs below $25k, 46.4% for AGIs $25k-50k, 75.2% for AGIs $50k-75k, 122.2% for AGIs $75k-100k, 166.1% for AGIs $100k-200k, 537.1% for AGIs over 200k)
Ordinary dividends: $5,113 (reported on 35.3% of returns)
Here:
$5,113
State:
$7,382
(% of AGI for various income ranges: 53.9% for AGIs below $25k, 84.0% for AGIs $25k-50k, 164.1% for AGIs $50k-75k, 299.1% for AGIs $75k-100k, 383.3% for AGIs $100k-200k, 1894.3% for AGIs over 200k)
Net capital gain/loss in AGI: +$15,208 (reported on 30.5% of returns)
Here:
+$15,208
State:
+$23,522
(% of AGI for various income ranges: 28.1% for AGIs below $25k, 52.8% for AGIs $25k-50k, 137.9% for AGIs $50k-75k, 234.3% for AGIs $75k-100k, 663.4% for AGIs $100k-200k, 7888.0% for AGIs over 200k)
Profit/loss from business: +$20,055 (reported on 14.2% of returns)
Here:
+$20,055
State:
+$16,274
(% of AGI for various income ranges: 116.2% for AGIs below $25k, 205.5% for AGIs $25k-50k, 284.0% for AGIs $50k-75k, 396.3% for AGIs $75k-100k, 633.3% for AGIs $100k-200k, 2660.6% for AGIs over 200k)
Taxable individual retirement arrangement distribution: $22,760 (reported on 14.3% of returns)
18976:
$22,760
Pennsylvania:
$18,583
(% of AGI for various income ranges: 115.9% for AGIs below $25k, 204.9% for AGIs $25k-50k, 387.8% for AGIs $50k-75k, 620.9% for AGIs $75k-100k, 1070.1% for AGIs $100k-200k, 1829.0% for AGIs over 200k)
Self-employed (Keogh) retirement plans: $22,170 (reported on 0.9% of returns)
18976:
$22,170
Pennsylvania:
$25,407
(% of AGI for various income ranges: 39.6% for AGIs $100k-200k, 338.4% for AGIs over 200k)
Total itemized deductions: $29,807 (reported on 14.5% of returns)
Here:
$29,807
State:
$34,850
(% of AGI for various income ranges: 152.6% for AGIs below $25k, 202.6% for AGIs $25k-50k, 373.2% for AGIs $50k-75k, 725.2% for AGIs $75k-100k, 1096.7% for AGIs $100k-200k, 3949.2% for AGIs over 200k)
Charity contributions: $6,272 (reported on 12.2% of returns)
Here:
$6,272
State:
$12,392
(% of AGI for various income ranges: 5.8% for AGIs below $25k, 17.3% for AGIs $25k-50k, 44.0% for AGIs $50k-75k, 72.6% for AGIs $75k-100k, 160.6% for AGIs $100k-200k, 1042.9% for AGIs over 200k)
Taxes paid: $8,858 (reported on 14.4% of returns)
18976:
$8,858
State:
$8,200
(% of AGI for various income ranges: 26.5% for AGIs below $25k, 50.5% for AGIs $25k-50k, 123.5% for AGIs $50k-75k, 263.8% for AGIs $75k-100k, 355.0% for AGIs $100k-200k, 1072.2% for AGIs over 200k)
Earned income credit: $1,938 (reported on 5.4% of returns)
Here:
$1,938
State:
$2,100
(% of AGI for various income ranges: 38.0% for AGIs below $25k, 40.9% for AGIs $25k-50k)
Percentage of individuals using paid preparers for their 2020 taxes: 89.9%
Here:
90%
State:
92%
(% for various income ranges: 87.6% for AGIs below $25k, 92.3% for AGIs $25k-50k, 88.8% for AGIs $50k-75k, 90.4% for AGIs $75k-100k, 89.8% for AGIs $100k-200k, 92.5% for AGIs over 200k)
Averages for the 2012 tax year for zip code 18976, filed in 2013:
Average Adjusted Gross Income (AGI) in 2012: $77,621 (Individual Income Tax Returns)
Here:
$77,621
State:
$61,346
Salary/wage: $70,566 (reported on 83.9% of returns)
Here:
$70,566
State:
$51,902
(% of AGI for various income ranges: 70.5% for AGIs below $25k, 73.8% for AGIs $25k-50k, 70.6% for AGIs $50k-75k, 72.2% for AGIs $75k-100k, 81.3% for AGIs $100k-200k, 74.7% for AGIs over 200k)
Taxable interest for individuals: $1,223 (reported on 49.0% of returns)
This zip code:
$1,223
Pennsylvania:
$1,588
(% of AGI for various income ranges: 2.1% for AGIs below $25k, 1.3% for AGIs $25k-50k, 1.0% for AGIs $50k-75k, 0.8% for AGIs $75k-100k, 0.5% for AGIs $100k-200k, 0.7% for AGIs over 200k)
Ordinary dividends: $3,848 (reported on 33.6% of returns)
Here:
$3,848
State:
$5,827
(% of AGI for various income ranges: 2.5% for AGIs below $25k, 2.0% for AGIs $25k-50k, 1.9% for AGIs $50k-75k, 1.6% for AGIs $75k-100k, 1.1% for AGIs $100k-200k, 2.2% for AGIs over 200k)
Net capital gain/loss in AGI: +$5,108 (reported on 25.7% of returns)
Here:
+$5,108
State:
+$14,495
(% of AGI for various income ranges: 0.4% for AGIs $50k-75k, 0.4% for AGIs $75k-100k, 0.9% for AGIs $100k-200k, 4.7% for AGIs over 200k)
Profit/loss from business: +$18,163 (reported on 13.3% of returns)
Here:
+$18,163
State:
+$16,268
(% of AGI for various income ranges: 6.0% for AGIs below $25k, 4.1% for AGIs $25k-50k, 3.5% for AGIs $50k-75k, 3.1% for AGIs $75k-100k, 3.0% for AGIs $100k-200k, 2.4% for AGIs over 200k)
Taxable individual retirement arrangement distribution: $16,563 (reported on 14.9% of returns)
18976:
$16,563
Pennsylvania:
$14,550
(% of AGI for various income ranges: 6.8% for AGIs below $25k, 4.6% for AGIs $25k-50k, 4.3% for AGIs $50k-75k, 4.1% for AGIs $75k-100k, 2.6% for AGIs $100k-200k, 2.2% for AGIs over 200k)
Self-employment retirement plans: $14,444 (reported on 0.9% of returns)
18976:
$14,444
Pennsylvania:
$20,922
Total itemized deductions: $25,009 (20% of AGI, reported on 49.0% of returns)
Here:
$25,009
State:
$23,538
Here:
19.7% of AGI
State:
18.4% of AGI
(% of AGI for various income ranges: 16.3% for AGIs below $25k, 15.7% for AGIs $25k-50k, 16.8% for AGIs $50k-75k, 18.6% for AGIs $75k-100k, 17.1% for AGIs $100k-200k, 12.3% for AGIs over 200k)
Charity contributions: $2,698 (reported on 43.5% of returns)
Here:
$2,698
State:
$4,025
(% of AGI for various income ranges: 0.9% for AGIs below $25k, 1.2% for AGIs $25k-50k, 1.5% for AGIs $50k-75k, 1.6% for AGIs $75k-100k, 1.6% for AGIs $100k-200k, 1.5% for AGIs over 200k)
Taxes paid: $11,301 (reported on 48.9% of returns)
18976:
$11,301
State:
$9,982
(% of AGI for various income ranges: 4.5% for AGIs below $25k, 5.8% for AGIs $25k-50k, 6.4% for AGIs $50k-75k, 7.5% for AGIs $75k-100k, 8.2% for AGIs $100k-200k, 6.6% for AGIs over 200k)
Earned income credit: $1,888 (reported on 6.7% of returns)
Here:
$1,888
State:
$2,106
(% of AGI for various income ranges: 2.8% for AGIs below $25k, 0.6% for AGIs $25k-50k)
Percentage of individuals using paid preparers for their 2012 taxes: 54.4%
Here:
54%
State:
53%
(% for various income ranges: 48.2% for AGIs below $25k, 52.3% for AGIs $25k-50k, 57.0% for AGIs $50k-75k, 58.5% for AGIs $75k-100k, 58.7% for AGIs $100k-200k, 65.2% for AGIs over 200k)
Averages for the 2004 tax year for zip code 18976, filed in 2005:
Average Adjusted Gross Income (AGI) in 2004: $64,668 (Individual Income Tax Returns)
Here:
$64,668
State:
$48,049
Salary/wage: $57,603 (reported on 85.9% of returns)
Here:
$57,603
State:
$42,646
(% of AGI for various income ranges: 132.1% for AGIs below $10k, 70.1% for AGIs $10k-25k, 77.5% for AGIs $25k-50k, 78.3% for AGIs $50k-75k, 84.4% for AGIs $75k-100k, 73.1% for AGIs over 100k)
Taxable interest for individuals: $1,514 (reported on 62.9% of returns)
This zip code:
$1,514
Pennsylvania:
$1,657
(% of AGI for various income ranges: 8.0% for AGIs below $10k, 3.9% for AGIs $10k-25k, 2.2% for AGIs $25k-50k, 1.4% for AGIs $50k-75k, 1.1% for AGIs $75k-100k, 1.2% for AGIs over 100k)
Taxable dividends: $2,212 (reported on 38.7% of returns)
Here:
$2,212
State:
$3,566
(% of AGI for various income ranges: 5.6% for AGIs below $10k, 2.8% for AGIs $10k-25k, 1.6% for AGIs $25k-50k, 1.3% for AGIs $50k-75k, 1.1% for AGIs $75k-100k, 1.2% for AGIs over 100k)
Net capital gain/loss: +$10,408 (reported on 29.1% of returns)
Here:
+$10,408
State:
+$9,716
(% of AGI for various income ranges: -3.3% for AGIs below $10k, 1.0% for AGIs $10k-25k, 0.5% for AGIs $25k-50k, 0.7% for AGIs $50k-75k, 0.4% for AGIs $75k-100k, 8.3% for AGIs over 100k)
Profit/loss from business: +$16,639 (reported on 13.8% of returns)
Here:
+$16,639
State:
+$14,267
(% of AGI for various income ranges: -2.2% for AGIs below $10k, 5.8% for AGIs $10k-25k, 5.1% for AGIs $25k-50k, 3.7% for AGIs $50k-75k, 3.3% for AGIs $75k-100k, 3.2% for AGIs over 100k)
IRA payment deduction: $3,249 (reported on 4.4% of returns)
18976:
$3,249
Pennsylvania:
$2,903
(% of AGI for various income ranges: 0.5% for AGIs $10k-25k, 0.5% for AGIs $25k-50k, 0.3% for AGIs $50k-75k, 0.2% for AGIs $75k-100k, 0.1% for AGIs over 100k)
Self-employed pension: $9,972 (reported on 1.2% of returns)
Here:
$9,972
Pennsylvania:
$14,674
(% of AGI for various income ranges: 0.1% for AGIs $25k-50k, 0.1% for AGIs $50k-75k, 0.2% for AGIs $75k-100k, 0.2% for AGIs over 100k)
Total itemized deductions: $20,698 (20% of AGI, reported on 51.9% of returns)
Here:
$20,698
State:
$18,804
Here:
20.4% of AGI
State:
19.5% of AGI
(% of AGI for various income ranges: 18.0% for AGIs below $10k, 13.8% for AGIs $10k-25k, 17.2% for AGIs $25k-50k, 19.3% for AGIs $50k-75k, 20.5% for AGIs $75k-100k, 14.8% for AGIs over 100k)
Charity contributions deductions: $2,571 (2% of AGI, reported on 48.4% of returns)
Here:
$2,571
State:
$3,337
Here:
2.5% of AGI
State:
3.3% of AGI
(% of AGI for various income ranges: 1.1% for AGIs below $10k, 1.3% for AGIs $10k-25k, 1.6% for AGIs $25k-50k, 1.9% for AGIs $50k-75k, 2.0% for AGIs $75k-100k, 2.0% for AGIs over 100k)
Total tax: $10,186 (reported on 81.9% of returns)
18976:
$10,186
State:
$8,008
(% of AGI for various income ranges: 5.4% for AGIs below $10k, 4.9% for AGIs $10k-25k, 7.8% for AGIs $25k-50k, 9.2% for AGIs $50k-75k, 9.5% for AGIs $75k-100k, 16.7% for AGIs over 100k)
Earned income credit: $1,406 (reported on 5.6% of returns)
Here:
$1,406
State:
$1,643
Percentage of individuals using paid preparers for their 2004 taxes: 52.8%
Here:
53%
State:
56%
(% for various income ranges: 43.5% for AGIs below $10k, 51.4% for AGIs $10k-25k, 52.0% for AGIs $25k-50k, 58.0% for AGIs $50k-75k, 57.5% for AGIs $75k-100k, 56.5% for AGIs over 100k)
Household received Food Stamps/SNAP in the past 12 months: 216 Household did not receive Food Stamps/SNAP in the past 12 months: 8,177
Women who had a birth in the past 12 months: 333 (270 now married, 68 unmarried) Women who did not have a birth in the past 12 months: 3,986 (1,874 now married, 2,101 unmarried)
Housing units in zip code 18976 with a mortgage: 4,194 (571 second mortgage, 556 both second mortgage and home equity loan) Houses without a mortgage: 257
Median monthly owner costs for units with a mortgage: $2,339 Median monthly owner costs for units without a mortgage: $927
Residents with income below the poverty level in 2022:
This zip code:
3.3%
Whole state:
11.8%
Residents with income below 50% of the poverty level in 2022:
This zip code:
1.3%
Whole state:
6.1%
Median number of rooms in houses and condos:
Here:
7.8
State:
6.8
Median number of rooms in apartments:
Here:
4.4
State:
4.3
Notable locations in this zip code not listed on our city pages
Notable locations in zip code 18976: Palomino Glen (A), Warrington Mews (B), Samuel Farms (C), Paul Valley Industrial Park (D), Willow Farms (E), Warrington Industrial Park (F), Neshaminy Gardens (G), Hampton Greens (H), Fairways (I), Warrington Village (J), Fairway Golf Course (K), Doylestown Industrial Park (L), Twin Brook Estates (M), Woodridge (N), Springdale (O), Buck Hills (P), Pebble Ridge Farms (Q), Hideaway Haven (R), Warrington Plaza (S), Bucks County Water and Sewer Authority (T). Display/hide their locations on the map
Shopping Centers: Warrington Mews Pavilion Shopping Center (1), Warrington Shopping Center (2), Warrington Plaza Shopping Center (3). Display/hide their locations on the map
Churches in zip code 18976 include: Warrington Fellowship Church (A), Saint Pauls Church (B), Saint Josephs Catholic Church (C). Display/hide their locations on the map
Parks in zip code 18976 include: Bradford Reservoir Recreation Area (1), Twin Oaks Park (2), Upper Nike Park (3), Lower Nike Park (4). Display/hide their locations on the map
Tourist attractions (not listed on the city page) : Happy Tymes Family Fun Center Inc (2071 County Line Road), AAA Travel (Tours & Charters; 1635 Easton Road), AAA Travel Services (Tours & Charters; 1635 Easton Road).
In group quarters: 475 (-1 institutionalized population)
Size of family households: 2,473 2-persons, 1,493 3-persons, 1,107 4-persons, 808 5-persons, 102 6-persons, 69 7-or-more-persons
Size of nonfamily households: 1,932 1-person, 411 2-persons, 13 3-persons
3,830 married couples with children.
538 single-parent households (206 men, 332 women).
84.0% of residents of 18976 zip code speak English at home.
3.4% of residents speak Spanish at home (50% very well, 30% well, 20% not well).
8.3% of residents speak other Indo-European language at home (60% very well, 28% well, 11% not well, 1% not at all).
4.0% of residents speak Asian or Pacific Island language at home (41% very well, 36% well, 19% not well, 5% not at all).
0.2% of residents speak other language at home (74% very well, 26% well).
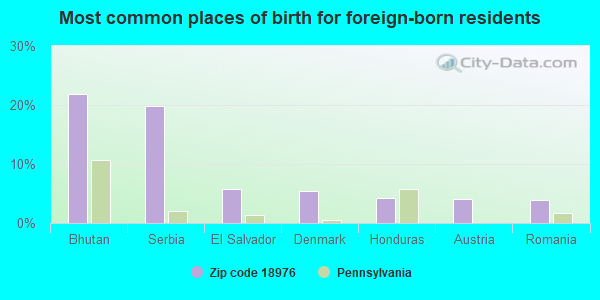
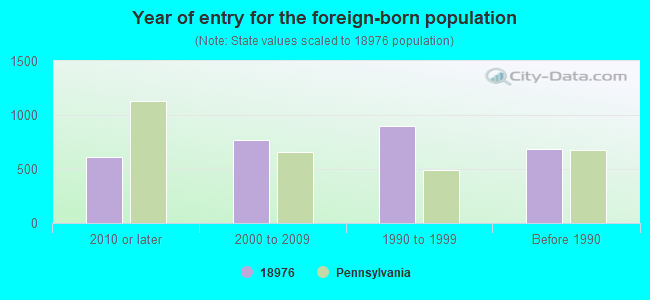
Foreign born population: 2,818 (12.6%) (76.2% of them are naturalized citizens)
This zip code:
12.6%
Whole state:
7.5%
22%Bhutan
20%Serbia
6%El Salvador
5%Denmark
4%Honduras
4%Austria
4%Romania
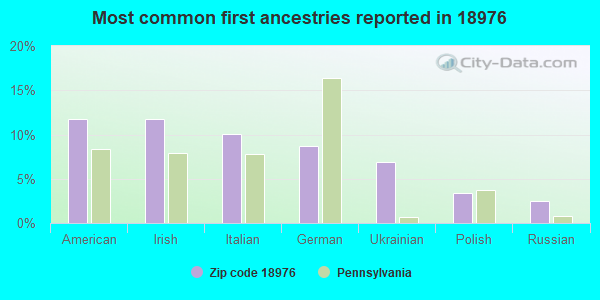
12%American
12%Irish
10%Italian
9%German
7%Ukrainian
3%Polish
3%Russian
Year of entry for the foreign-born population
6092010 or later
7672000 to 2009
8961990 to 1999
685Before 1990
Facilities with environmental interests located in this zip code:
BIDDLE TRUCK RENTAL (350 EASTON RD in WARRINGTON, PA)
STATE MASTER (Pennsylvania database) - RCRIS-PAD981105687, HAZARDOUS WASTE PROGRAM Small Quantity Generators, between 100 kg and 1000 kg of hazardous waste/month (Resource Conservation and Recovery Act (tracking hazardous waste)) - notification Organizations: OPERNAME (CONTACT/OPERATOR)
, SCHEMM, RICHARD (CONTACT/OWNER)
BILLS TOWING (2346 STREET ROAD in WARRINGTON, PA)
STATE MASTER (Pennsylvania database) - RCRIS-PAD981938616, HAZARDOUS WASTE PROGRAM, AFS-00-1100381-1, AIR PROGRAM Small Quantity Generators, between 100 kg and 1000 kg of hazardous waste/month (Resource Conservation and Recovery Act (tracking hazardous waste)) - notification Business SIC classification: TOP, BODY, AND UPHOLSTERY REPAIR SHOPS AND PAINT SHOPS Business NAICS classification: AUTOMOTIVE BODY, PAINT, AND INTERIOR REPAIR AND MAINTENANCE. Organizations: OPERNAME (CONTACT/OPERATOR)
, GALLEN, WILLIAM JB (CONTACT/OWNER)
Housing units lacking complete kitchen facilities: 0.6%
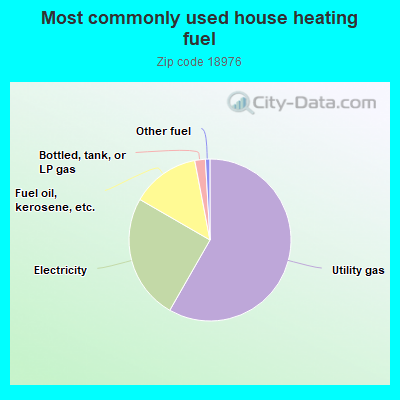
58.1%Utility gas
25.0%Electricity
13.6%Fuel oil, kerosene, etc.
2.1%Bottled, tank, or LP gas
0.9%Other fuel
Population in 1990: 13,862. Population change in the 1990s: +1,817 (+13.1%).
Place of birth for U.S.-born residents:
This state: 15,567
Northeast: 2,499
Midwest: 366
South: 543
West: 267
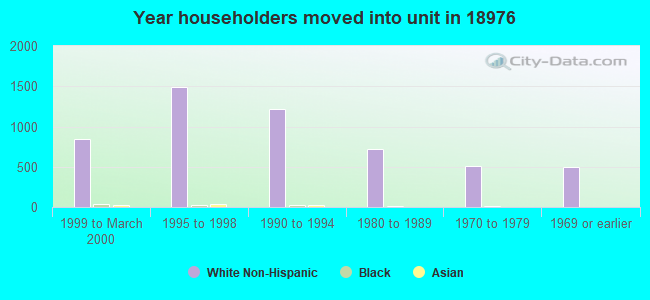
60% of the 18976 zip code residents lived in the same house 5 years ago. Out of people who lived in different houses, 46% lived in this county. Out of people who lived in different counties, 50% lived in Pennsylvania.
92% of the 18976 zip code residents lived in the same house 1 year ago. Out of people who lived in different houses, 56% moved from this county. Out of people who lived in different houses, 30% moved from different county within same state. Out of people who lived in different houses, 10% moved from different state. Out of people who lived in different houses, 5% moved from abroad.
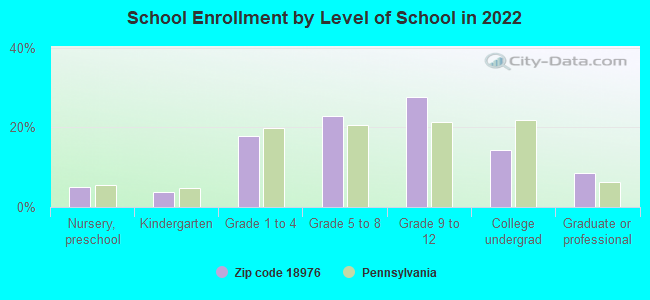
Private vs. public school enrollment:
Students in private schools in grades 1 to 8 (elementary and middle school): 62
Here:
3.0%
Pennsylvania:
15.7%
Students in private schools in grades 9 to 12 (high school): 165
Here:
11.6%
Pennsylvania:
13.4%
Students in private undergraduate colleges: 187
Here:
25.4%
Pennsylvania:
39.8%
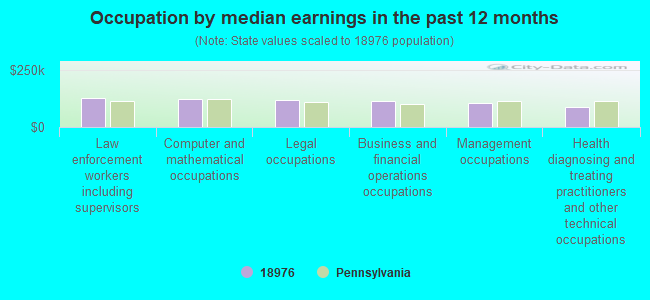
Occupation by median earnings in the past 12 months ($)
129,289Law enforcement workers including supervisors
124,173Computer and mathematical occupations
121,010Legal occupations
112,728Business and financial operations occupations
104,674Management occupations
89,581Health diagnosing and treating practitioners and other technical occupations
Companies with federal contracts located in this zip code (WARRINGTON, PA):
STEFANOWICZ & LUTZ INC (242 VALLEY RD; small business) : $1,544,389 in 39 contractsfrom 1999 to 2006
Contracts for Flags and Pennants, Boxes, Cartons, and Crates, Hardware, Commercial, Marine Hardware and Hull Items, and moreby Defense Logistics Agency, Bureau of Prisoners/Federal Prison System, Navy, Army, and others Signed by year:2000: $49,896; 2001: $30,320; 2002: $574,993; 2003: $0; 2004: $548,982; 2005: $240,048; 2006: $58,776.
Biggest contracts:
$409,109 with Defense Logistics Agency for Flags and Pennants. Signed on 2002-01-25. Completion date: 2002-08-23.
$276,690, same as above.Signed on 2004-06-16. Completion date: 2005-11-13.
$138,170, same as above.Signed on 2002-08-16. Completion date: 2003-06-13.
$96,768, same as above.Signed on 2005-09-30. Completion date: 2006-04-30.
WARREN MACHINE CO INC (429 EASTON RD STE A; small business) : $546,219 in 10 contractsfrom 2000 to 2005
Contracts for Aircraft Ground Servicing Equipment, Combination and Miscellaneous Instruments, Aircraft Maintenance and Repair Shop Specialized Equipment, Guided Missile Maintenance, Repair, and Checkout Specialized Equipment, and moreby Navy, Defense Logistics Agency, Air Force Signed by year:2000: $184,460; 2001: $0; 2002: $3,047; 2003: $323,296; 2004: $13,896; 2005: $21,520; 2006: $0.
Biggest contracts:
$272,720 with Navy for Aircraft Ground Servicing Equipment. Signed on 2003-09-29. Completion date: 2004-02-02.
$68,120 with Defense Logistics Agency for Combination and Miscellaneous Instruments. Signed on 2000-02-15. Completion date: 2000-06-14.
$50,576 with Navy for Aircraft Maintenance and Repair Shop Specialized Equipment. Signed on 2003-12-04. Completion date: 2004-04-02.
$49,840 with Navy for Guided Missile Maintenance, Repair, and Checkout Specialized Equipment. Signed on 2000-08-28. Completion date: 2000-11-27.
CRANE CHEMPUMP (175 TITUS AV) : $443,093 in 17 contractsfrom 1999 to 2006
Contracts for Power and Hand Pumps, Radio and Television Communication Equipment, Airborne, Bearings, Plain, Unmounted, Electrical and Electronic Properties Measuring and Testing Instruments, and moreby Navy, Defense Logistics Agency Signed by year:2000: $32,030; 2001: $0; 2002: $91,700; 2003: $0; 2004: $32,557; 2005: $101,844; 2006: $154,810.
Biggest contracts:
$109,068 with Navy for Power and Hand Pumps. Signed on 2006-04-18. Completion date: 2006-07-30.
$91,700, same as above.Signed on 2002-02-07. Completion date: 2002-07-31.
$73,800, same as above.Signed on 2005-02-14. Completion date: 2005-07-21.
$32,557 with Navy for Radio and Television Communication Equipment, Airborne. Signed on 2004-10-13. Completion date: 2004-10-13.
LUCIFER FURNACES INC (2048 BUNNELL RD; small business) : $159,915 in 7 contractsfrom 2001 to 2005
Contracts for Metal Heat Treating and Non-Thermal Treating Equipment, Additive Metal Materials, Industrial Furnaces, Kilns, Lehrs, and Ovens, Laboratory Equipment and Supplies by Air Force, Navy, Army Signed by year:2000: $0; 2001: $76,595; 2002: $0; 2003: $23,280; 2004: $4,260; 2005: $55,780; 2006: $0.
Biggest contracts:
$39,940 with Air Force for Metal Heat Treating and Non-Thermal Treating Equipment. Signed on 2001-09-20. Completion date: 2002-02-01.
$36,655 with Navy for Additive Metal Materials. Signed on 2001-03-28. Completion date: 2001-06-28.
$30,870 with Air Force for Industrial Furnaces, Kilns, Lehrs, and Ovens. Signed on 2005-04-18. Completion date: 2005-07-11.
$23,280 with Army for Industrial Furnaces, Kilns, Lehrs, and Ovens. Signed on 2003-12-15. Completion date: 2004-03-08.
COUNTY LINE FENCE CO (2051 COUNTY LINE RD) : $61,200 in 6 contractsfrom 2000 to 2005
Contracts for Construction of Structures and Facilities -- Other Non-Building Facilities, Maintenance, Repair or Alteration of Real Property -- Other Non-Building Facilities, Fencing, Fences, Gates and Components by Navy, Army Signed by year:2000: $24,770; 2001: $0; 2002: $0; 2003: $30,330; 2004: $0; 2005: $6,100; 2006: $0.
Biggest contracts:
$27,530 with Navy for Construction of Structures and Facilities -- Other Non-Building Facilities. Signed on 2003-04-07. Completion date: 2003-04-25.
$13,470 with Navy for Maintenance, Repair or Alteration of Real Property -- Other Non-Building Facilities. Signed on 2000-07-26. Completion date: 2000-08-28.
$8,550, same as above.Signed on 2000-07-28. Completion date: 2000-08-30.
$6,100 with Army for Fencing, Fences, Gates and Components. Signed on 2005-03-31. Completion date: 2005-04-29.
SHAFER, GARY W (816 PHILADELPHIA AVE; small business) : $60,788 in 3 contractsin 2005
$29,499 with Navy for Maintenance, Repair and Rebuilding of Equipment -- Miscellaneous. Taking place in NC. Signed on 2005-05-23. Completion date: 2005-06-15.
$25,201, same as above.Signed on 2005-07-01. Completion date: 2005-06-15.
$6,088, same as above.Signed on 2005-08-22. Completion date: 2005-06-15.
LOWE'S HOME CENTERS, INC (425 EASTON ROAD) : $19,739 in 2 contractsfrom 2003 to 2005
$12,309 with Army for Lumber and Related Basic Wood Materials. Signed on 2003-04-02. Completion date: 2003-03-27.
$7,430 with Navy for Miscellaneous Construction Materials. Signed on 2005-08-17. Completion date: 2005-12-31.
FCG INC (202 VALLEY RD; small business) : $18,259 in 4 contractsin 2005
$14,580 with Defense Logistics Agency for Cable, Cord, and Wire Assemblies: Communications Equipment. Signed on 2005-08-16. Completion date: 2005-10-15.
$3,180 with Navy for Cable, Cord, and Wire Assemblies: Communications Equipment. Signed on 2005-05-13. Completion date: 2005-06-02.
$250, same as above.Signed on 2005-05-18. Completion date: 2005-06-02.
$249, same as above.Signed on 2005-07-25. Completion date: 2005-06-02.
ST JOSEPHS R C CHURCH (1795 COLUMBIA AVENUE; small business) : $10,800 in 2 contractsfrom 2003 to 2004
$6,300 with Navy for Chaplain Services. Signed on 2003-10-01. Completion date: 2004-09-30.
$4,500 with Navy for Other Social Services. Signed on 2004-10-01. Completion date: 2005-09-30.
GALLEN, JANE (2346 STREET RD; small business) : $10,442 in 2 contractsin 2004
$7,116 with Navy for Maintenance, Repair or Alteration of Real Property -- Miscellaneous Buildings. Signed on 2004-07-16. Completion date: 2004-07-30.
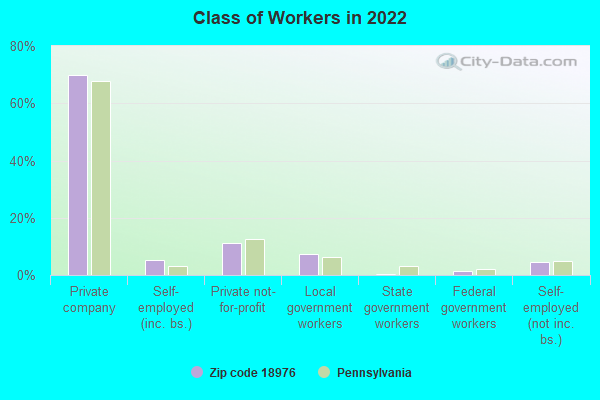
$3,326, same as above.Signed on 2004-06-15. Completion date: 2004-06-30.
Top industries in this zip code by the number of employees in 2005:
2003 - 2018 National Fire Incident Reporting System (NFIRS) incidents
According to the data from the years 2003 - 2018 the average number of fire incidents per year is 33. The highest number of fire incidents - 87 took place in 2003, and the least - 5 in 2004. The data has a declining trend.
When looking into fire subcategories, the most incidents belonged to: Structure Fires (65.0%), and Outside Fires (18.5%).
Fire incident types reported to NFIRS in Zip Code 18976

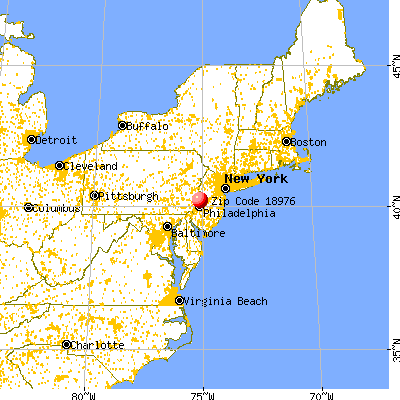


 Nearest zip codes: 18901, 19044, 18929, 18914, 18974, 19040.


 According to the data from the years 2003 - 2018 the average number of fire incidents per year is 33. The highest number of fire incidents - 87 took place in 2003, and the least - 5 in 2004. The data has a declining trend.
 When looking into fire subcategories, the most incidents belonged to: Structure Fires (65.0%), and Outside Fires (18.5%).