Estimated zip code population in 2022: 33,829 Zip code population in 2010: 35,056 Zip code population in 2000: 32,578
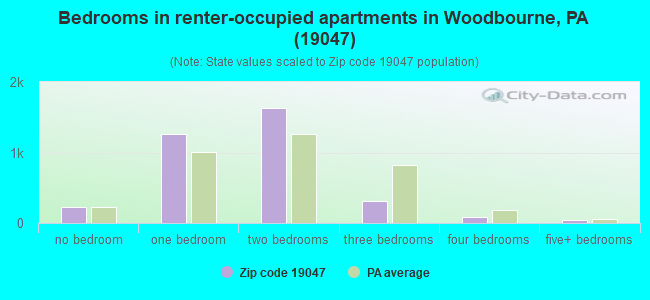
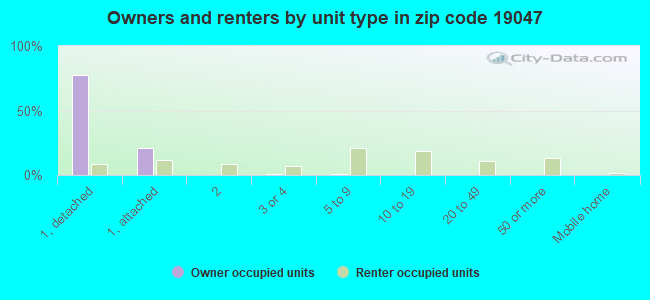
Houses and condos: 13,194 Renter-occupied apartments: 3,522
% of renters here:
27%
State:
31%
March 2022 cost of living index in zip code 19047: 106.2 (more than average, U.S. average is 100)
Land area: 17.5 sq. mi. Water area: 0.5 sq. mi.
Population density: 1,933 people per square mile
(low).
OSM Map
General Map
Google Map
MSN Map
OSM Map
General Map
Google Map
MSN Map
OSM Map
General Map
Google Map
MSN Map
OSM Map
General Map
Google Map
MSN Map
Please wait while loading the map...
Real estate property taxes paid for housing units in 2022:
This zip code:
1.4% ($6,447)
Pennsylvania:
1.3% ($3,094)
Median real estate property taxes paid for housing units with mortgages in 2022: $6,422 (1.4%) Median real estate property taxes paid for housing units with no mortgage in 2022: $6,512 (1.4%)
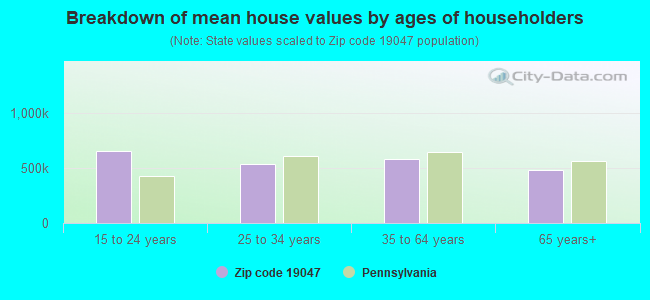
Estimated median house/condo value in 2022: $453,339
19047:
$453,339
Pennsylvania:
$245,500
According to our research of Pennsylvania and other state lists, there were 16 registered sex offenders living in 19047 zip code as of April 27, 2024. The ratio of all residents to sex offenders in zip code 19047 is 2,238 to 1. The ratio of registered sex offenders to all residents in this zip code is much lower than the state average.
Median resident age:
This zip code:
44.7 years
Pennsylvania median age:
40.9 years
Average household size:
This zip code:
2.5 people
Pennsylvania:
2.4 people
Averages for the 2020 tax year for zip code 19047, filed in 2021:
Average Adjusted Gross Income (AGI) in 2020: $97,452 (Individual Income Tax Returns)
Here:
$97,452
State:
$75,707
Salary/wage: $84,238 (reported on 78.0% of returns)
Here:
$84,238
State:
$62,806
(% of AGI for various income ranges: 1073.3% for AGIs below $25k, 3319.1% for AGIs $25k-50k, 6192.0% for AGIs $50k-75k, 8709.5% for AGIs $75k-100k, 17769.0% for AGIs $100k-200k, 73064.8% for AGIs over 200k)
Taxable interest for individuals: $1,525 (reported on 44.3% of returns)
This zip code:
$1,525
Pennsylvania:
$1,633
(% of AGI for various income ranges: 37.2% for AGIs below $25k, 46.5% for AGIs $25k-50k, 78.0% for AGIs $50k-75k, 109.9% for AGIs $75k-100k, 165.7% for AGIs $100k-200k, 574.2% for AGIs over 200k)
Ordinary dividends: $5,807 (reported on 32.0% of returns)
Here:
$5,807
State:
$7,382
(% of AGI for various income ranges: 60.0% for AGIs below $25k, 75.3% for AGIs $25k-50k, 142.5% for AGIs $50k-75k, 216.6% for AGIs $75k-100k, 416.6% for AGIs $100k-200k, 2514.2% for AGIs over 200k)
Net capital gain/loss in AGI: +$16,793 (reported on 27.4% of returns)
Here:
+$16,793
State:
+$23,522
(% of AGI for various income ranges: 23.3% for AGIs below $25k, 54.2% for AGIs $25k-50k, 147.2% for AGIs $50k-75k, 226.3% for AGIs $75k-100k, 616.5% for AGIs $100k-200k, 10149.2% for AGIs over 200k)
Profit/loss from business: +$19,419 (reported on 13.9% of returns)
Here:
+$19,419
State:
+$16,274
(% of AGI for various income ranges: 119.8% for AGIs below $25k, 189.1% for AGIs $25k-50k, 278.9% for AGIs $50k-75k, 317.0% for AGIs $75k-100k, 677.7% for AGIs $100k-200k, 2673.3% for AGIs over 200k)
Taxable individual retirement arrangement distribution: $22,474 (reported on 14.2% of returns)
19047:
$22,474
Pennsylvania:
$18,583
(% of AGI for various income ranges: 106.9% for AGIs below $25k, 184.4% for AGIs $25k-50k, 332.3% for AGIs $50k-75k, 556.6% for AGIs $75k-100k, 956.0% for AGIs $100k-200k, 2454.3% for AGIs over 200k)
Self-employed (Keogh) retirement plans: $20,586 (reported on 0.8% of returns)
19047:
$20,586
Pennsylvania:
$25,407
(% of AGI for various income ranges: 18.0% for AGIs $50k-75k, 24.9% for AGIs $100k-200k, 331.3% for AGIs over 200k)
Total itemized deductions: $30,669 (reported on 13.0% of returns)
Here:
$30,669
State:
$34,850
(% of AGI for various income ranges: 116.8% for AGIs below $25k, 226.0% for AGIs $25k-50k, 441.3% for AGIs $50k-75k, 672.7% for AGIs $75k-100k, 994.8% for AGIs $100k-200k, 3976.7% for AGIs over 200k)
Charity contributions: $6,434 (reported on 11.0% of returns)
Here:
$6,434
State:
$12,392
(% of AGI for various income ranges: 5.6% for AGIs below $25k, 19.8% for AGIs $25k-50k, 49.1% for AGIs $50k-75k, 76.6% for AGIs $75k-100k, 171.5% for AGIs $100k-200k, 1047.7% for AGIs over 200k)
Taxes paid: $8,759 (reported on 13.0% of returns)
19047:
$8,759
State:
$8,200
(% of AGI for various income ranges: 31.7% for AGIs below $25k, 58.4% for AGIs $25k-50k, 127.9% for AGIs $50k-75k, 227.4% for AGIs $75k-100k, 316.0% for AGIs $100k-200k, 948.3% for AGIs over 200k)
Earned income credit: $1,632 (reported on 6.4% of returns)
Here:
$1,632
State:
$2,100
(% of AGI for various income ranges: 39.8% for AGIs below $25k, 35.3% for AGIs $25k-50k)
Percentage of individuals using paid preparers for their 2020 taxes: 91.1%
Here:
91%
State:
92%
(% for various income ranges: 88.7% for AGIs below $25k, 91.8% for AGIs $25k-50k, 91.8% for AGIs $50k-75k, 92.3% for AGIs $75k-100k, 91.8% for AGIs $100k-200k, 91.4% for AGIs over 200k)
Averages for the 2012 tax year for zip code 19047, filed in 2013:
Average Adjusted Gross Income (AGI) in 2012: $76,000 (Individual Income Tax Returns)
Here:
$76,000
State:
$61,346
Salary/wage: $68,011 (reported on 82.4% of returns)
Here:
$68,011
State:
$51,902
(% of AGI for various income ranges: 67.1% for AGIs below $25k, 74.8% for AGIs $25k-50k, 71.9% for AGIs $50k-75k, 71.3% for AGIs $75k-100k, 77.9% for AGIs $100k-200k, 70.7% for AGIs over 200k)
Taxable interest for individuals: $1,296 (reported on 47.6% of returns)
This zip code:
$1,296
Pennsylvania:
$1,588
(% of AGI for various income ranges: 1.9% for AGIs below $25k, 0.9% for AGIs $25k-50k, 1.1% for AGIs $50k-75k, 0.8% for AGIs $75k-100k, 0.6% for AGIs $100k-200k, 0.7% for AGIs over 200k)
Ordinary dividends: $4,396 (reported on 31.5% of returns)
Here:
$4,396
State:
$5,827
(% of AGI for various income ranges: 3.0% for AGIs below $25k, 1.5% for AGIs $25k-50k, 1.7% for AGIs $50k-75k, 1.7% for AGIs $75k-100k, 1.5% for AGIs $100k-200k, 2.4% for AGIs over 200k)
Net capital gain/loss in AGI: +$4,110 (reported on 23.6% of returns)
Here:
+$4,110
State:
+$14,495
(% of AGI for various income ranges: 0.3% for AGIs $50k-75k, 0.7% for AGIs $75k-100k, 0.7% for AGIs $100k-200k, 3.5% for AGIs over 200k)
Profit/loss from business: +$17,221 (reported on 13.4% of returns)
Here:
+$17,221
State:
+$16,268
(% of AGI for various income ranges: 7.4% for AGIs below $25k, 3.5% for AGIs $25k-50k, 3.4% for AGIs $50k-75k, 2.6% for AGIs $75k-100k, 3.1% for AGIs $100k-200k, 2.1% for AGIs over 200k)
Taxable individual retirement arrangement distribution: $16,687 (reported on 14.5% of returns)
19047:
$16,687
Pennsylvania:
$14,550
(% of AGI for various income ranges: 5.5% for AGIs below $25k, 3.8% for AGIs $25k-50k, 3.8% for AGIs $50k-75k, 3.7% for AGIs $75k-100k, 3.2% for AGIs $100k-200k, 2.1% for AGIs over 200k)
Self-employment retirement plans: $18,500 (reported on 0.9% of returns)
19047:
$18,500
Pennsylvania:
$20,922
(% of AGI for various income ranges: 0.3% for AGIs $50k-75k, 0.2% for AGIs $100k-200k, 0.4% for AGIs over 200k)
Total itemized deductions: $24,450 (20% of AGI, reported on 48.0% of returns)
Here:
$24,450
State:
$23,538
Here:
20.0% of AGI
State:
18.4% of AGI
(% of AGI for various income ranges: 18.5% for AGIs below $25k, 13.7% for AGIs $25k-50k, 16.6% for AGIs $50k-75k, 18.3% for AGIs $75k-100k, 16.8% for AGIs $100k-200k, 11.7% for AGIs over 200k)
Charity contributions: $2,813 (reported on 42.4% of returns)
Here:
$2,813
State:
$4,025
(% of AGI for various income ranges: 0.8% for AGIs below $25k, 1.0% for AGIs $25k-50k, 1.5% for AGIs $50k-75k, 1.6% for AGIs $75k-100k, 1.8% for AGIs $100k-200k, 1.6% for AGIs over 200k)
Taxes paid: $11,117 (reported on 47.8% of returns)
19047:
$11,117
State:
$9,982
(% of AGI for various income ranges: 5.1% for AGIs below $25k, 4.8% for AGIs $25k-50k, 6.3% for AGIs $50k-75k, 7.7% for AGIs $75k-100k, 7.9% for AGIs $100k-200k, 6.8% for AGIs over 200k)
Earned income credit: $1,694 (reported on 7.1% of returns)
Here:
$1,694
State:
$2,106
(% of AGI for various income ranges: 2.7% for AGIs below $25k, 0.4% for AGIs $25k-50k)
Percentage of individuals using paid preparers for their 2012 taxes: 55.7%
Here:
56%
State:
53%
(% for various income ranges: 48.9% for AGIs below $25k, 52.3% for AGIs $25k-50k, 59.0% for AGIs $50k-75k, 60.7% for AGIs $75k-100k, 61.3% for AGIs $100k-200k, 66.7% for AGIs over 200k)
Averages for the 2004 tax year for zip code 19047, filed in 2005:
Average Adjusted Gross Income (AGI) in 2004: $61,859 (Individual Income Tax Returns)
Here:
$61,859
State:
$48,049
Salary/wage: $57,782 (reported on 84.8% of returns)
Here:
$57,782
State:
$42,646
(% of AGI for various income ranges: 134.8% for AGIs below $10k, 68.7% for AGIs $10k-25k, 78.7% for AGIs $25k-50k, 77.8% for AGIs $50k-75k, 83.7% for AGIs $75k-100k, 78.2% for AGIs over 100k)
Taxable interest for individuals: $1,598 (reported on 60.6% of returns)
This zip code:
$1,598
Pennsylvania:
$1,657
(% of AGI for various income ranges: 9.1% for AGIs below $10k, 3.4% for AGIs $10k-25k, 1.8% for AGIs $25k-50k, 1.7% for AGIs $50k-75k, 1.2% for AGIs $75k-100k, 1.3% for AGIs over 100k)
Taxable dividends: $2,337 (reported on 36.4% of returns)
Here:
$2,337
State:
$3,566
(% of AGI for various income ranges: 6.9% for AGIs below $10k, 2.8% for AGIs $10k-25k, 1.6% for AGIs $25k-50k, 1.3% for AGIs $50k-75k, 1.1% for AGIs $75k-100k, 1.2% for AGIs over 100k)
Net capital gain/loss: +$4,965 (reported on 28.2% of returns)
Here:
+$4,965
State:
+$9,716
(% of AGI for various income ranges: -5.0% for AGIs below $10k, 0.5% for AGIs $10k-25k, 0.2% for AGIs $25k-50k, 0.8% for AGIs $50k-75k, 0.3% for AGIs $75k-100k, 4.0% for AGIs over 100k)
Profit/loss from business: +$17,321 (reported on 13.8% of returns)
Here:
+$17,321
State:
+$14,267
(% of AGI for various income ranges: 13.4% for AGIs below $10k, 6.1% for AGIs $10k-25k, 4.4% for AGIs $25k-50k, 3.4% for AGIs $50k-75k, 3.8% for AGIs $75k-100k, 3.5% for AGIs over 100k)
IRA payment deduction: $3,263 (reported on 3.8% of returns)
19047:
$3,263
Pennsylvania:
$2,903
(% of AGI for various income ranges: 0.7% for AGIs below $10k, 0.3% for AGIs $10k-25k, 0.4% for AGIs $25k-50k, 0.3% for AGIs $50k-75k, 0.2% for AGIs $75k-100k, 0.1% for AGIs over 100k)
Self-employed pension: $11,659 (reported on 1.3% of returns)
Here:
$11,659
Pennsylvania:
$14,674
(% of AGI for various income ranges: 0.5% for AGIs below $10k, 0.1% for AGIs $25k-50k, 0.1% for AGIs $50k-75k, 0.2% for AGIs $75k-100k, 0.4% for AGIs over 100k)
Total itemized deductions: $20,932 (21% of AGI, reported on 50.2% of returns)
Here:
$20,932
State:
$18,804
Here:
21.1% of AGI
State:
19.5% of AGI
(% of AGI for various income ranges: 41.2% for AGIs below $10k, 16.5% for AGIs $10k-25k, 16.5% for AGIs $25k-50k, 20.9% for AGIs $50k-75k, 20.3% for AGIs $75k-100k, 14.7% for AGIs over 100k)
Charity contributions deductions: $2,596 (3% of AGI, reported on 47.0% of returns)
Here:
$2,596
State:
$3,337
Here:
2.5% of AGI
State:
3.3% of AGI
(% of AGI for various income ranges: 1.5% for AGIs below $10k, 1.2% for AGIs $10k-25k, 1.6% for AGIs $25k-50k, 2.1% for AGIs $50k-75k, 2.2% for AGIs $75k-100k, 2.0% for AGIs over 100k)
Total tax: $10,340 (reported on 80.8% of returns)
19047:
$10,340
State:
$8,008
(% of AGI for various income ranges: 3.9% for AGIs below $10k, 4.8% for AGIs $10k-25k, 7.9% for AGIs $25k-50k, 9.4% for AGIs $50k-75k, 10.1% for AGIs $75k-100k, 17.8% for AGIs over 100k)
Earned income credit: $1,428 (reported on 5.3% of returns)
Here:
$1,428
State:
$1,643
Percentage of individuals using paid preparers for their 2004 taxes: 57.5%
Here:
57%
State:
56%
(% for various income ranges: 48.3% for AGIs below $10k, 57.0% for AGIs $10k-25k, 57.0% for AGIs $25k-50k, 63.2% for AGIs $50k-75k, 60.7% for AGIs $75k-100k, 61.9% for AGIs over 100k)
Likely homosexual households (counted as self-reported same-sex unmarried-partner households)
Lesbian couples: 0.1% of all households
Gay men: 0.1% of all households
Household received Food Stamps/SNAP in the past 12 months: 839 Household did not receive Food Stamps/SNAP in the past 12 months: 11,964
Women who had a birth in the past 12 months: 454 (410 now married, 61 unmarried) Women who did not have a birth in the past 12 months: 6,647 (2,480 now married, 4,172 unmarried)
Housing units in zip code 19047 with a mortgage: 6,044 (783 second mortgage, 24 home equity loan, 666 both second mortgage and home equity loan) Houses without a mortgage: 402
Median monthly owner costs for units with a mortgage: $2,305 Median monthly owner costs for units without a mortgage: $988
Residents with income below the poverty level in 2022:
This zip code:
6.4%
Whole state:
11.8%
Residents with income below 50% of the poverty level in 2022:
This zip code:
3.4%
Whole state:
6.1%
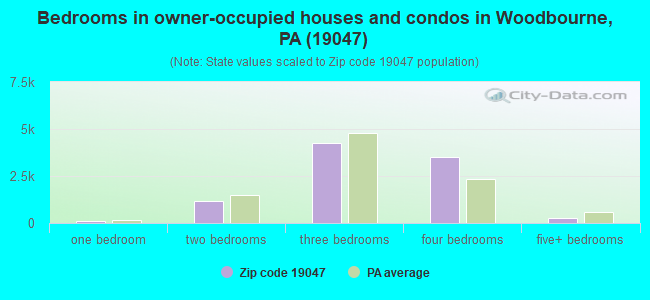
Median number of rooms in houses and condos:
Here:
7.5
State:
6.8
Median number of rooms in apartments:
Here:
4.0
State:
4.3
Notable locations in this zip code not listed on our city pages
Notable locations in zip code 19047: Flowers Mill (A), Silver Lake at Newtown (B), Langhorne Country Club (C), Sweetwater Farms (D), Millway Farms (E), Summit Trace (F), Pennwood (G), Green Valley (H), Sturbridge (I), Hampton Bridge (J), Sunny Hill (K), Old Mill Woods (L), Strawberry Ridge (M), Woodbourne Station (N), Valley View Estates (O), Langhorne Crest (P), Tareyton Estates (Q), Brenwood (R), Bucks County Business Park (S), Langhorne Station (T). Display/hide their locations on the map
Shopping Centers: Pine Watson Shopping Center (1), Summit Square Shopping Center (2), Oxford Valley Mall (3), Oxford Valley Mall (4). Display/hide their locations on the map
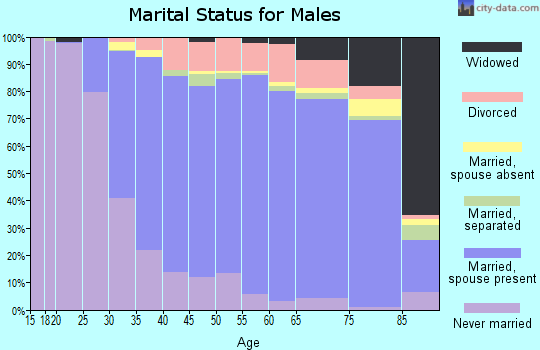
4,427 married couples with children.
949 single-parent households (239 men, 710 women).
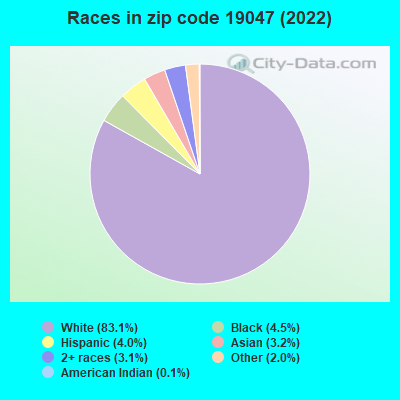
91.2% of residents of 19047 zip code speak English at home.
2.1% of residents speak Spanish at home (74% very well, 15% well, 9% not well, 3% not at all).
4.7% of residents speak other Indo-European language at home (67% very well, 21% well, 12% not well).
1.7% of residents speak Asian or Pacific Island language at home (51% very well, 36% well, 11% not well, 2% not at all).
0.3% of residents speak other language at home (98% very well, 2% well).
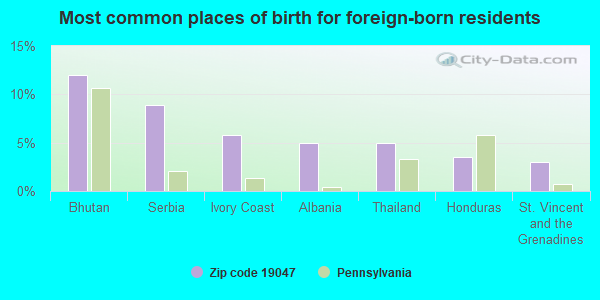
Foreign born population: 2,443 (7.2%) (64.3% of them are naturalized citizens)
This zip code:
7.2%
Whole state:
7.5%
12%Bhutan
9%Serbia
6%Ivory Coast
5%Albania
5%Thailand
4%Honduras
3%St. Vincent and the Grenadines
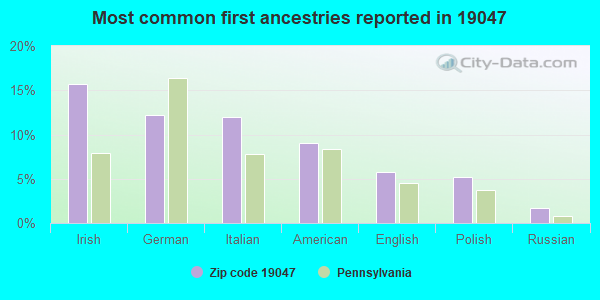
16%Irish
12%German
12%Italian
9%American
6%English
5%Polish
2%Russian
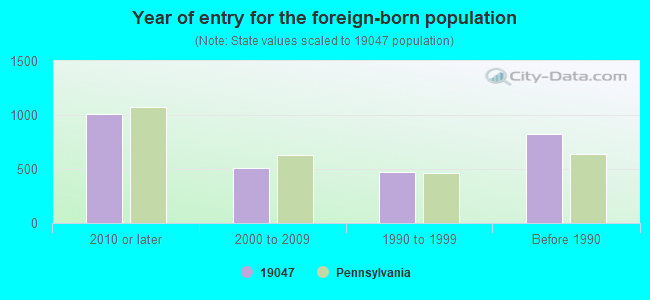
Year of entry for the foreign-born population
1,0102010 or later
5092000 to 2009
4711990 to 1999
822Before 1990
Major facilities with environmental interests located in this zip code:
BLUE RIBBON CLNR SVC (1862 W MAPLE AVE in LANGHORNE, PA)
AIR MINOR (AIRS/AFS) STATE MASTER (Pennsylvania database) - RCRIS-PAD987378015, HAZARDOUS WASTE PROGRAM, AFS-00-1100070-1, AIR PROGRAM Conditionally Exempt Small Quantity Generators, less than 100 kg/month of hazardous waste (Resource Conservation and Recovery Act (tracking hazardous waste)) Business SIC classification: DRYCLEANING PLANTS, EXCEPT RUG CLEANING Business NAICS classification: DRYCLEANING AND LAUNDRY SERVICES (EXCEPT COIN-OPERATED). Organizations: BLUE RIBBON CLEANERS (CONTACT/OWNER)
Alternative names: BLUE RIBBON CLEANERS, BOULEVARD DRAPERY CLEANERS
BECK (2100 W CABOT BLVD in LANGHORNE, PA)
STATE MASTER (Pennsylvania database) - RCRIS-PAD002292787, HAZARDOUS WASTE PROGRAM (Resource Conservation and Recovery Act (tracking hazardous waste)) Organizations: OPERNAME (CONTACT/OPERATOR)
, THE BECK CO (CONTACT/OWNER)
BOB BURNS SVC CTR (628 W MAPLE AVE in LANGHORNE, PA)
STATE MASTER (Pennsylvania database) - RCRIS-PAD987344983, HAZARDOUS WASTE PROGRAM (Resource Conservation and Recovery Act (tracking hazardous waste)) Organizations: OPERNAME (CONTACT/OPERATOR)
, BURNS ROBERT F (CONTACT/OWNER)
ARMOUR & SONS ELEC (23 E CABOT BLVD in LANGHORNE, PA)
STATE MASTER (Pennsylvania database) - RCRIS-PAD987400678, HAZARDOUS WASTE PROGRAM Conditionally Exempt Small Quantity Generators, less than 100 kg/month of hazardous waste (Resource Conservation and Recovery Act (tracking hazardous waste)) - notification Organizations: ARMOUR & SONS ELECTRIC INC (CONTACT/OWNER)
AIR O DYNAMIX (400 E LINCOLN HWY in LANGHORNE, PA)
AMOCO NO 12076 TANKS (111 E LINCOLN HWY in PENNDEL, PA)
(Resource Conservation and Recovery Act (tracking hazardous waste)) Organizations: AMOCO OIL CO (CONTACT/OWNER)
AKZO NOBEL INKS CORPORATION (2200 CABOT BOULEVARD WEST in LANGHORNE, PA)
National Pollutant Discharge Elimination System NON-MAJOR (Tracking pollutant discharge elimination systems) - permit Business SIC classification: PRINTING INK Alternative names: AKZO NOBELS INKS CORPORATION, ANI HOLDING LANGHORNE FAC
AL'S COLLISION INC (4122 OLD LINCOLN HWY in TREVOSE, PA)
Small Quantity Generators, between 100 kg and 1000 kg of hazardous waste/month (Resource Conservation and Recovery Act (tracking hazardous waste)) - notification Organizations: OPERNAME (CONTACT/OPERATOR)
, KIRNER WILLIAM (CONTACT/OWNER)
ART CRAFT MACHINE & TOOL (115 W GILLOW AVE in LANGHORNE, PA)
Small Quantity Generators, between 100 kg and 1000 kg of hazardous waste/month (Resource Conservation and Recovery Act (tracking hazardous waste)) - notification Organizations: OPERNAME (CONTACT/OPERATOR)
, MCCOMB, FRANK (CONTACT/OWNER)
ASEPSIS ENVIRONMENTAL SERVICES (424 W LINCOLN HWY in PENNDEL, PA)
TRANSPORTER (Resource Conservation and Recovery Act (tracking hazardous waste)) Organizations: OPERNAME (CONTACT/OPERATOR)
, ASEPSIS ENV SER (CONTACT/OWNER)
BELMONTS GARAGE (633 W MAPLE AVE in LANGHORNE, PA)
Conditionally Exempt Small Quantity Generators, less than 100 kg/month of hazardous waste (Resource Conservation and Recovery Act (tracking hazardous waste)) - notification Organizations: OPERNAME (CONTACT/OPERATOR)
, BELMONT CHARLES A (CONTACT/OWNER)
Housing units lacking complete plumbing facilities: 0.6% Housing units lacking complete kitchen facilities: 1.1%
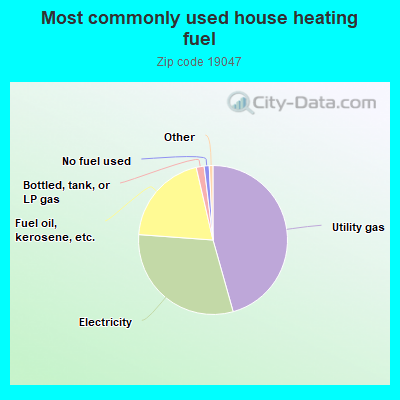
45.6%Utility gas
30.5%Electricity
20.2%Fuel oil, kerosene, etc.
1.7%Bottled, tank, or LP gas
1.1%No fuel used
Population in 1990: 34,108.
Place of birth for U.S.-born residents:
This state: 21,172
Northeast: 7,212
Midwest: 611
South: 1,551
West: 544
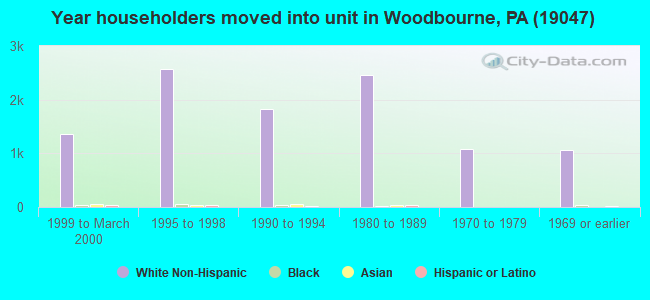
62% of the 19047 zip code residents lived in the same house 5 years ago. Out of people who lived in different houses, 60% lived in this county. Out of people who lived in different counties, 50% lived in Pennsylvania.
91% of the 19047 zip code residents lived in the same house 1 year ago. Out of people who lived in different houses, 59% moved from this county. Out of people who lived in different houses, 20% moved from different county within same state. Out of people who lived in different houses, 17% moved from different state. Out of people who lived in different houses, 4% moved from abroad.
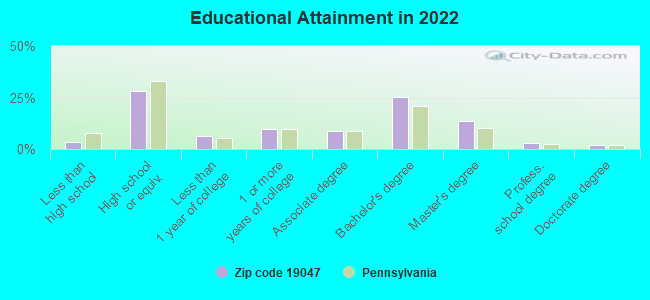
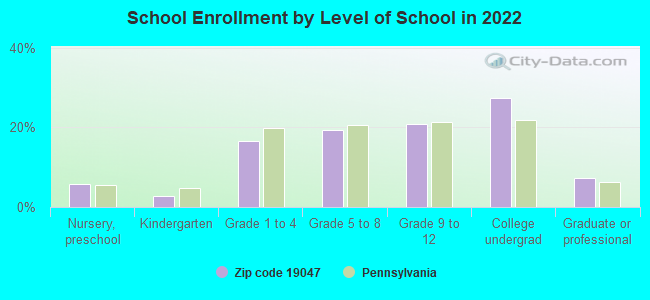
Private vs. public school enrollment:
Students in private schools in grades 1 to 8 (elementary and middle school): 377
Here:
14.8%
Pennsylvania:
15.7%
Students in private schools in grades 9 to 12 (high school): 238
Here:
16.0%
Pennsylvania:
13.4%
Students in private undergraduate colleges: 1,029
Here:
52.7%
Pennsylvania:
39.8%
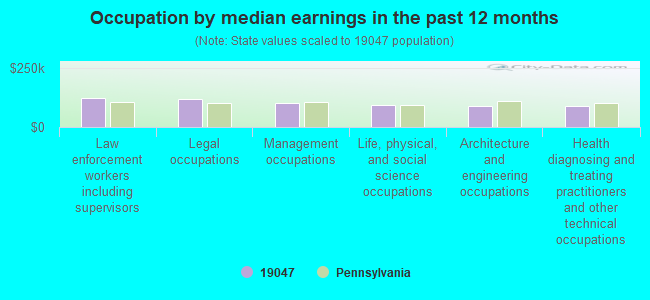
Occupation by median earnings in the past 12 months ($)
124,398Law enforcement workers including supervisors
120,289Legal occupations
100,300Management occupations
94,700Life, physical, and social science occupations
91,007Architecture and engineering occupations
87,012Health diagnosing and treating practitioners and other technical occupations
Companies with biggest federal contracts located in this zip code:
INTERSTATE STEEL SUPPLY COMPAN (50 E CABOT BLVD in LANGHORNE, PA; small business) : $14,753,051 in 286 contractsfrom 1999 to 2006
Contracts for Plate, Sheet, Strip, Foil; and Leaf, Structural Shapes, Pipe, Tube and Rigid Tubing, Non-nuclear Ship Repair (West) Ship repair (including overhauls and conversions) performed on. non-nuclear propelled and nonpropelled ships west of the 108th meridian, and moreby Defense Logistics Agency, Minerals Management Service, Federal Highway Administration, Navy, and others Signed by year:2000: $2,112,379; 2001: $6,405,047; 2002: $3,868,081; 2003: -$384; 2004: $428,875; 2005: $423,137; 2006: $523,202.
Biggest contracts:
$749,931 with Defense Logistics Agency for Plate, Sheet, Strip, Foil; and Leaf. Signed on 2002-08-26. Completion date: 2002-08-27.
$573,768, same as above.Signed on 2000-03-30. Completion date: 2000-08-30.
$569,620 with Defense Logistics Agency for Structural Shapes. Signed on 2001-08-29. Completion date: 2002-08-28.
$430,143 with Defense Logistics Agency for Plate, Sheet, Strip, Foil; and Leaf. Signed on 2001-10-09. Completion date: 2001-10-09.
GENESYS LTD (1 OXFORD VLY STE 810 in LANGHORNE, PA; small business) : $9,234,453 in 2 contractsfrom 2004 to 2005
$6,504,880 with Army for Trucks and Truck Tractors, Wheeled. Signed on 2004-11-08. Completion date: 2006-11-05.
$2,729,573 with Army for Trailers. Signed on 2005-12-27. Completion date: 2008-06-23.
TETRA TECH FW, INC (2300 LINCOLN HWY E in LANGHORNE, PA) : $9,094,198 in 134 contractsfrom 2003 to 2006
Contracts for Construction of Structures and Facilities -- Other Non-Building Facilities, Architect - Engineer Services (including landscaping, interior layout, and designing), Other Architect and Engineering Services by Navy, Army, U.S. Army Corps of Engineers - civil program financing only Signed by year:2000: $0; 2001: $0; 2002: $0; 2003: $2,894,460; 2004: $5,616,239; 2005: $309,757; 2006: $273,742.
Biggest contracts:
$2,395,799 with Navy for Construction of Structures and Facilities -- Other Non-Building Facilities. Taking place in ME. Signed on 2003-12-31. Completion date: 2004-09-30.
$927,479 with Navy for Construction of Structures and Facilities -- Other Non-Building Facilities. Taking place in NY. Signed on 2004-02-19. Completion date: 2005-03-31.
$889,557 with Navy for Construction of Structures and Facilities -- Other Non-Building Facilities. Taking place in CT. Signed on 2004-06-17. Completion date: 2004-12-17.
$695,465 with Navy for Construction of Structures and Facilities -- Other Non-Building Facilities. Taking place in MA. Signed on 2004-09-29. Completion date: 2005-12-30.
OPTELLIOS, INC (2260 CABOT BLVD WEST in LANGHORNE, PA; small business) : $3,956,972 in 15 contractsfrom 2001 to 2005
Contracts for Ammunition -- Operational Systems Development (R&D), Defense Missile and Space Systems -- Advanced Development (R&D), Defense Electronics and Communication Equipment -- Applied Research and Exploratory Development (R&D), Defense Electronics and Communication Equipment -- Management and Support (R&D), and moreby Air Force, Army, National Institute of Standards and Technology Signed by year:2000: $0; 2001: $579,798; 2002: $1,873,633; 2003: $734,898; 2004: $393,670; 2005: $374,973; 2006: $0.
Biggest contracts:
$998,871 with Air Force for Ammunition -- Operational Systems Development (R&D). Taking place in NJ. Signed on 2002-03-08. Completion date: 2004-03-15.
$500,000 with Army for Defense Missile and Space Systems -- Advanced Development (R&D). Taking place in NJ. Signed on 2002-03-31. Completion date: 2004-03-31.
$496,184, same as above.Signed on 2003-02-05. Completion date: 2004-03-31.
$375,000 with Air Force for Defense Electronics and Communication Equipment -- Applied Research and Exploratory Development (R&D). Taking place in NJ. Signed on 2004-05-07. Completion date: 2006-05-31.
D & R MACHINE CO INC (2310 BIG OAK RD in LANGHORNE, PA; small business) : $2,058,397 in 45 contractsfrom 2000 to 2006
Contracts for Aircraft Ground Servicing Equipment, Gas Turbines and Jet Engines, Aircraft; Prime Moving, and Components, Guns, through 30 mm, Studs, and moreby Navy, Army, Defense Logistics Agency Signed by year:2000: $630,000; 2001: $463,621; 2002: $123,828; 2003: $543,474; 2004: $167,495; 2005: $76,721; 2006: $53,258.
Biggest contracts:
$630,000 with Navy for Aircraft Ground Servicing Equipment. Signed on 2000-02-09. Completion date: 2000-09-09.
$256,760, same as above.Signed on 2001-06-21. Completion date: 2002-02-21.
$174,960 with Army for Gas Turbines and Jet Engines, Aircraft; Prime Moving, and Components. Signed on 2003-07-07. Completion date: 2005-09-30.
$117,631, same as above.Signed on 2003-08-15. Completion date: 2004-11-30.
PENNSYLVANIA MANUFACTURING TEC (1 CABOT BLVD E in LANGHORNE, PA; small business) : $741,414 in 32 contractsfrom 2004 to 2006
Contracts for Vehicular Power Transmission Components, Gears, Pulleys, Sprockets, and Transmission Chain, Miscellaneous Power Transmission Equipment, Vehicular Brake, Steering, Axle, Wheel, and Track Components by Army, Defense Logistics Agency, Navy Signed by year:2000: $0; 2001: $0; 2002: $0; 2003: $0; 2004: $112,584; 2005: $531,169; 2006: $97,661.
Biggest contracts:
$222,855 with Army for Vehicular Power Transmission Components. Signed on 2005-07-06. Completion date: 2006-04-26.
$86,940, same as above.Signed on 2004-09-27. Completion date: 2009-09-27.
$65,612 with Defense Logistics Agency for Gears, Pulleys, Sprockets, and Transmission Chain. Signed on 2005-06-18. Completion date: 2005-10-18.
$40,061 with Defense Logistics Agency for Miscellaneous Power Transmission Equipment. Signed on 2005-07-21. Completion date: 2005-11-08.
BUILDING SERVICE INTERNATIONAL (36 KATIE DR in LANGHORNE, PA; small business) : $388,801 in 5 contractsin 1999
Contracts for Custodial Janitorial Services by Navy Signed by year:2000: $0; 2001: $0; 2002: $0; 2003: $0; 2004: $0; 2005: $0; 2006: $0.
Biggest contracts:
$159,120 with Navy for Custodial Janitorial Services. Taking place in FL. Signed on 1999-10-01. Completion date: 2000-09-30.
$152,001, same as above.Signed on 1999-10-20. Completion date: 2000-09-30.
$77,680, same as above.Signed on 1999-12-20. Completion date: 2000-09-30.
$0, same as above.Signed on 1999-10-01. Completion date: 2000-09-30.
LOEFFLER CORPORATION (201 E LINCOLN HWY in PENNDEL, PA; small business) : $271,443 in 12 contractsfrom 2000 to 2006
Contracts for Plumbing Fixtures and Accessories, Valves, Nonpowered by Defense Logistics Agency Signed by year:2000: $72,870; 2001: $112,152; 2002: $26,599; 2003: $0; 2004: $0; 2005: $35,973; 2006: $23,849.
Biggest contracts:
$80,500 with Defense Logistics Agency for Plumbing Fixtures and Accessories. Signed on 2001-01-31. Completion date: 2001-05-01.
$36,435, same as above.Signed on 2000-12-21. Completion date: 2001-03-02.
$36,435, same as above.Signed on 2000-12-21. Completion date: 2001-03-02.
$31,652 with Defense Logistics Agency for Valves, Nonpowered. Signed on 2001-12-27. Completion date: 2002-02-25.
JAIME SANTIAGOS INSTRUCTIONAL (1104 LANGHORNE-NEWTOWN RD in LANGHORNE, PA; small business) : $225,350 in 4 contractsfrom 2001 to 2003
$88,400 with Defense Logistics Agency for Other Management Support Services. Signed on 2001-08-31. Completion date: 2001-11-01.
$61,200, same as above.Signed on 2002-08-31. Completion date: 2002-09-01.
$41,750 with Department of Defense for Other Management Support Services. Taking place in WA. Signed on 2003-04-09. Completion date: 2003-09-19.
$34,000 with Defense Logistics Agency for Other Management Support Services. Signed on 2001-08-30. Completion date: 2001-11-01.
PARAMOUNT INDUSTRIES, INC (2475 BIG OAK RD in LANGHORNE, PA; small business) : $122,666 in 8 contractsfrom 2004 to 2006
Contracts for Indoor and Outdoor Electric Lighting Fixtures, Production Jigs, Fixtures, and Templates by Army Signed by year:2000: $0; 2001: $0; 2002: $0; 2003: $0; 2004: $87,666; 2005: $18,500; 2006: $16,500.
Biggest contracts:
$50,000 with Army for Indoor and Outdoor Electric Lighting Fixtures. Signed on 2004-06-30. Completion date: 2004-11-30.
$31,600, same as above.Signed on 2004-07-16. Completion date: 2004-11-30.
$13,500 with Army for Production Jigs, Fixtures, and Templates. Signed on 2005-04-11. Completion date: 2005-05-13.
$9,000, same as above.Signed on 2006-04-18. Completion date: 2006-05-18.
Top industries in this zip code by the number of employees in 2005:
Health Care and Social Assistance: General Medical and Surgical Hospitals (over 1000 employees: 1 establishment, 500-999 employees: 1 establishment)
2003 - 2018 National Fire Incident Reporting System (NFIRS) incidents
According to the data from the years 2003 - 2018 the average number of fire incidents per year is 91. The highest number of reported fires - 195 took place in 2016, and the least - 24 in 2014. The data has a rising trend.
When looking into fire subcategories, the most incidents belonged to: Structure Fires (55.6%), and Outside Fires (26.8%).
Fire incident types reported to NFIRS in Zip Code 19047

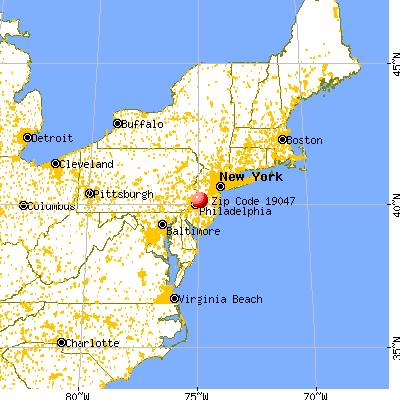


 Nearest zip codes: 19056, 19053, 19057, 19030, 19055, 19020.


 According to the data from the years 2003 - 2018 the average number of fire incidents per year is 91. The highest number of reported fires - 195 took place in 2016, and the least - 24 in 2014. The data has a rising trend.
 When looking into fire subcategories, the most incidents belonged to: Structure Fires (55.6%), and Outside Fires (26.8%).