Estimated zip code population in 2022: 53,249 Zip code population in 2010: 51,334 Zip code population in 2000: 53,212
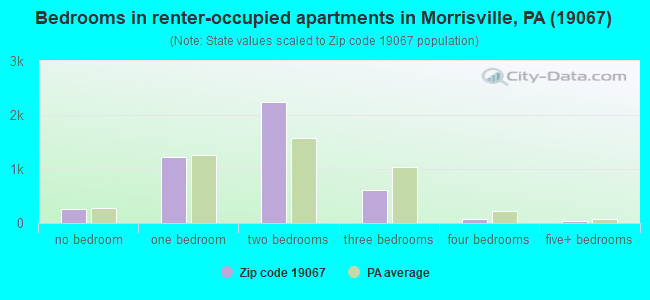
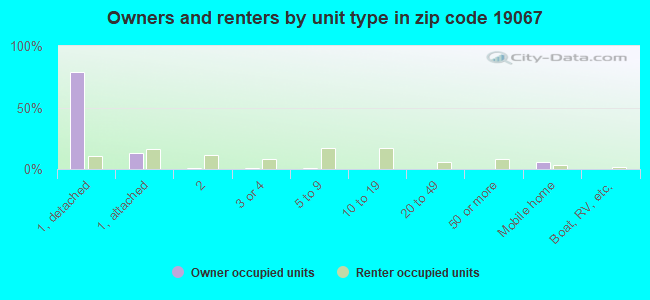
Houses and condos: 22,151 Renter-occupied apartments: 4,403
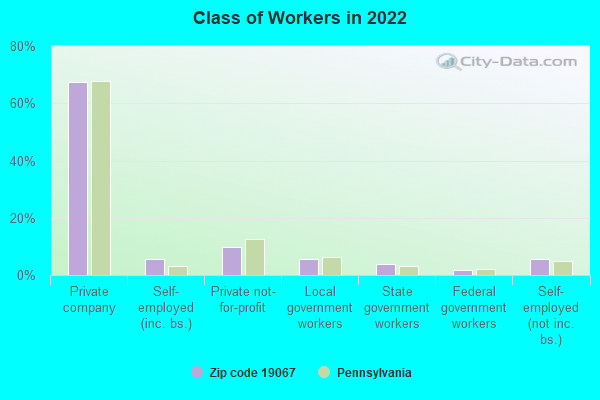
% of renters here:
21%
State:
31%
March 2022 cost of living index in zip code 19067: 104.9 (near average, U.S. average is 100)
Land area: 28.5 sq. mi. Water area: 2.5 sq. mi.
Population density: 1,868 people per square mile
(low).
OSM Map
General Map
Google Map
MSN Map
OSM Map
General Map
Google Map
MSN Map
OSM Map
General Map
Google Map
MSN Map
OSM Map
General Map
Google Map
MSN Map
Please wait while loading the map...
Real estate property taxes paid for housing units in 2022:
This zip code:
1.4% ($6,971)
Pennsylvania:
1.3% ($3,094)
Median real estate property taxes paid for housing units with mortgages in 2022: $7,163 (1.4%) Median real estate property taxes paid for housing units with no mortgage in 2022: $6,429 (1.4%)
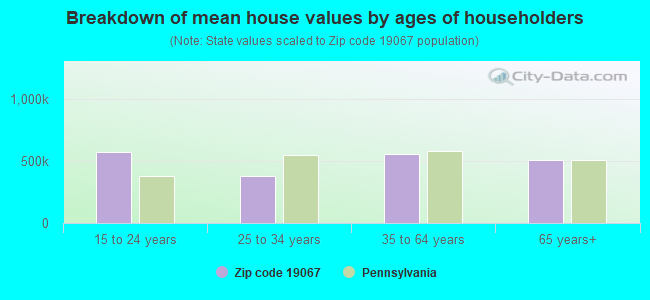
Estimated median house/condo value in 2022: $482,426
19067:
$482,426
Pennsylvania:
$245,500
According to our research of Pennsylvania and other state lists, there were 13 registered sex offenders living in 19067 zip code as of April 27, 2024. The ratio of all residents to sex offenders in zip code 19067 is 4,028 to 1. The ratio of registered sex offenders to all residents in this zip code is much lower than the state average.
Median resident age:
This zip code:
43.5 years
Pennsylvania median age:
40.9 years
Average household size:
This zip code:
2.5 people
Pennsylvania:
2.4 people
Averages for the 2020 tax year for zip code 19067, filed in 2021:
Average Adjusted Gross Income (AGI) in 2020: $126,665 (Individual Income Tax Returns)
Here:
$126,665
State:
$75,707
Salary/wage: $108,073 (reported on 80.6% of returns)
Here:
$108,073
State:
$62,806
(% of AGI for various income ranges: 1099.2% for AGIs below $25k, 3600.8% for AGIs $25k-50k, 6330.3% for AGIs $50k-75k, 9190.5% for AGIs $75k-100k, 19048.5% for AGIs $100k-200k, 99138.3% for AGIs over 200k)
Taxable interest for individuals: $2,298 (reported on 43.6% of returns)
This zip code:
$2,298
Pennsylvania:
$1,633
(% of AGI for various income ranges: 28.6% for AGIs below $25k, 39.1% for AGIs $25k-50k, 57.7% for AGIs $50k-75k, 117.1% for AGIs $75k-100k, 194.9% for AGIs $100k-200k, 1167.2% for AGIs over 200k)
Ordinary dividends: $10,687 (reported on 36.8% of returns)
Here:
$10,687
State:
$7,382
(% of AGI for various income ranges: 52.0% for AGIs below $25k, 79.9% for AGIs $25k-50k, 152.0% for AGIs $50k-75k, 320.4% for AGIs $75k-100k, 586.3% for AGIs $100k-200k, 5641.9% for AGIs over 200k)
Net capital gain/loss in AGI: +$24,665 (reported on 32.1% of returns)
Here:
+$24,665
State:
+$23,522
(% of AGI for various income ranges: 26.7% for AGIs below $25k, 54.6% for AGIs $25k-50k, 100.0% for AGIs $50k-75k, 261.4% for AGIs $75k-100k, 734.9% for AGIs $100k-200k, 13678.4% for AGIs over 200k)
Profit/loss from business: +$23,963 (reported on 16.2% of returns)
Here:
+$23,963
State:
+$16,274
(% of AGI for various income ranges: 118.6% for AGIs below $25k, 196.0% for AGIs $25k-50k, 287.4% for AGIs $50k-75k, 431.5% for AGIs $75k-100k, 841.3% for AGIs $100k-200k, 4113.8% for AGIs over 200k)
Taxable individual retirement arrangement distribution: $29,034 (reported on 12.0% of returns)
19067:
$29,034
Pennsylvania:
$18,583
(% of AGI for various income ranges: 67.9% for AGIs below $25k, 140.5% for AGIs $25k-50k, 294.9% for AGIs $50k-75k, 525.3% for AGIs $75k-100k, 1098.1% for AGIs $100k-200k, 2874.0% for AGIs over 200k)
Self-employed (Keogh) retirement plans: $25,524 (reported on 1.6% of returns)
19067:
$25,524
Pennsylvania:
$25,407
(% of AGI for various income ranges: 3.4% for AGIs below $25k, 10.1% for AGIs $50k-75k, 17.8% for AGIs $75k-100k, 76.0% for AGIs $100k-200k, 630.7% for AGIs over 200k)
Total itemized deductions: $36,659 (reported on 16.9% of returns)
Here:
$36,659
State:
$34,850
(% of AGI for various income ranges: 123.3% for AGIs below $25k, 213.4% for AGIs $25k-50k, 486.3% for AGIs $50k-75k, 784.4% for AGIs $75k-100k, 1276.9% for AGIs $100k-200k, 6966.7% for AGIs over 200k)
Charity contributions: $10,391 (reported on 14.4% of returns)
Here:
$10,391
State:
$12,392
(% of AGI for various income ranges: 8.1% for AGIs below $25k, 17.8% for AGIs $25k-50k, 65.4% for AGIs $50k-75k, 93.3% for AGIs $75k-100k, 201.3% for AGIs $100k-200k, 2283.6% for AGIs over 200k)
Taxes paid: $9,029 (reported on 16.8% of returns)
19067:
$9,029
State:
$8,200
(% of AGI for various income ranges: 27.7% for AGIs below $25k, 52.7% for AGIs $25k-50k, 155.0% for AGIs $50k-75k, 280.3% for AGIs $75k-100k, 422.2% for AGIs $100k-200k, 1294.1% for AGIs over 200k)
Earned income credit: $1,825 (reported on 7.5% of returns)
Here:
$1,825
State:
$2,100
(% of AGI for various income ranges: 53.4% for AGIs below $25k, 47.2% for AGIs $25k-50k)
Percentage of individuals using paid preparers for their 2020 taxes: 91.3%
Here:
91%
State:
92%
(% for various income ranges: 89.2% for AGIs below $25k, 92.3% for AGIs $25k-50k, 91.1% for AGIs $50k-75k, 91.1% for AGIs $75k-100k, 91.7% for AGIs $100k-200k, 93.3% for AGIs over 200k)
Averages for the 2012 tax year for zip code 19067, filed in 2013:
Average Adjusted Gross Income (AGI) in 2012: $100,384 (Individual Income Tax Returns)
Here:
$100,384
State:
$61,346
Salary/wage: $86,700 (reported on 83.1% of returns)
Here:
$86,700
State:
$51,902
(% of AGI for various income ranges: 68.3% for AGIs below $25k, 76.5% for AGIs $25k-50k, 72.7% for AGIs $50k-75k, 74.0% for AGIs $75k-100k, 78.4% for AGIs $100k-200k, 66.8% for AGIs over 200k)
Taxable interest for individuals: $1,718 (reported on 46.5% of returns)
This zip code:
$1,718
Pennsylvania:
$1,588
(% of AGI for various income ranges: 1.8% for AGIs below $25k, 0.7% for AGIs $25k-50k, 0.9% for AGIs $50k-75k, 0.7% for AGIs $75k-100k, 0.7% for AGIs $100k-200k, 0.8% for AGIs over 200k)
Ordinary dividends: $5,768 (reported on 36.5% of returns)
Here:
$5,768
State:
$5,827
(% of AGI for various income ranges: 3.3% for AGIs below $25k, 1.7% for AGIs $25k-50k, 1.9% for AGIs $50k-75k, 1.7% for AGIs $75k-100k, 1.8% for AGIs $100k-200k, 2.4% for AGIs over 200k)
Net capital gain/loss in AGI: +$17,193 (reported on 28.7% of returns)
Here:
+$17,193
State:
+$14,495
(% of AGI for various income ranges: 0.2% for AGIs $25k-50k, 0.4% for AGIs $50k-75k, 0.4% for AGIs $75k-100k, 0.7% for AGIs $100k-200k, 10.0% for AGIs over 200k)
Profit/loss from business: +$24,663 (reported on 15.7% of returns)
Here:
+$24,663
State:
+$16,268
(% of AGI for various income ranges: 8.6% for AGIs below $25k, 4.4% for AGIs $25k-50k, 3.4% for AGIs $50k-75k, 3.2% for AGIs $75k-100k, 4.3% for AGIs $100k-200k, 3.5% for AGIs over 200k)
Taxable individual retirement arrangement distribution: $22,034 (reported on 12.4% of returns)
19067:
$22,034
Pennsylvania:
$14,550
(% of AGI for various income ranges: 4.0% for AGIs below $25k, 3.0% for AGIs $25k-50k, 3.6% for AGIs $50k-75k, 3.7% for AGIs $75k-100k, 2.9% for AGIs $100k-200k, 2.2% for AGIs over 200k)
Self-employment retirement plans: $22,538 (reported on 1.8% of returns)
19067:
$22,538
Pennsylvania:
$20,922
(% of AGI for various income ranges: 0.2% for AGIs $50k-75k, 0.1% for AGIs $75k-100k, 0.3% for AGIs $100k-200k, 0.6% for AGIs over 200k)
Total itemized deductions: $30,124 (18% of AGI, reported on 50.1% of returns)
Here:
$30,124
State:
$23,538
Here:
18.0% of AGI
State:
18.4% of AGI
(% of AGI for various income ranges: 16.5% for AGIs below $25k, 12.8% for AGIs $25k-50k, 16.3% for AGIs $50k-75k, 17.0% for AGIs $75k-100k, 17.2% for AGIs $100k-200k, 13.4% for AGIs over 200k)
Charity contributions: $3,669 (reported on 44.3% of returns)
Here:
$3,669
State:
$4,025
(% of AGI for various income ranges: 0.9% for AGIs below $25k, 1.1% for AGIs $25k-50k, 1.5% for AGIs $50k-75k, 1.5% for AGIs $75k-100k, 1.8% for AGIs $100k-200k, 1.7% for AGIs over 200k)
Taxes paid: $13,800 (reported on 49.9% of returns)
19067:
$13,800
State:
$9,982
(% of AGI for various income ranges: 5.2% for AGIs below $25k, 4.2% for AGIs $25k-50k, 6.2% for AGIs $50k-75k, 7.1% for AGIs $75k-100k, 8.0% for AGIs $100k-200k, 6.7% for AGIs over 200k)
Earned income credit: $1,837 (reported on 8.3% of returns)
Here:
$1,837
State:
$2,106
(% of AGI for various income ranges: 3.6% for AGIs below $25k, 0.7% for AGIs $25k-50k)
Percentage of individuals using paid preparers for their 2012 taxes: 57.2%
Here:
57%
State:
53%
(% for various income ranges: 50.7% for AGIs below $25k, 54.1% for AGIs $25k-50k, 58.3% for AGIs $50k-75k, 61.2% for AGIs $75k-100k, 60.0% for AGIs $100k-200k, 69.4% for AGIs over 200k)
Averages for the 2004 tax year for zip code 19067, filed in 2005:
Average Adjusted Gross Income (AGI) in 2004: $81,648 (Individual Income Tax Returns)
Here:
$81,648
State:
$48,049
Salary/wage: $72,560 (reported on 84.3% of returns)
Here:
$72,560
State:
$42,646
(% of AGI for various income ranges: 112.3% for AGIs below $10k, 69.2% for AGIs $10k-25k, 79.4% for AGIs $25k-50k, 79.1% for AGIs $50k-75k, 80.7% for AGIs $75k-100k, 72.7% for AGIs over 100k)
Taxable interest for individuals: $1,800 (reported on 59.1% of returns)
This zip code:
$1,800
Pennsylvania:
$1,657
(% of AGI for various income ranges: 9.6% for AGIs below $10k, 3.3% for AGIs $10k-25k, 1.7% for AGIs $25k-50k, 1.4% for AGIs $50k-75k, 1.1% for AGIs $75k-100k, 1.1% for AGIs over 100k)
Taxable dividends: $4,304 (reported on 41.6% of returns)
Here:
$4,304
State:
$3,566
(% of AGI for various income ranges: 9.1% for AGIs below $10k, 3.0% for AGIs $10k-25k, 1.6% for AGIs $25k-50k, 1.5% for AGIs $50k-75k, 1.6% for AGIs $75k-100k, 2.4% for AGIs over 100k)
Net capital gain/loss: +$17,187 (reported on 33.3% of returns)
Here:
+$17,187
State:
+$9,716
(% of AGI for various income ranges: -6.4% for AGIs below $10k, 0.2% for AGIs $10k-25k, 0.5% for AGIs $25k-50k, 0.3% for AGIs $50k-75k, 1.0% for AGIs $75k-100k, 10.3% for AGIs over 100k)
Profit/loss from business: +$21,845 (reported on 14.9% of returns)
Here:
+$21,845
State:
+$14,267
(% of AGI for various income ranges: 4.2% for AGIs below $10k, 7.7% for AGIs $10k-25k, 4.1% for AGIs $25k-50k, 3.8% for AGIs $50k-75k, 3.6% for AGIs $75k-100k, 3.9% for AGIs over 100k)
IRA payment deduction: $3,354 (reported on 3.4% of returns)
19067:
$3,354
Pennsylvania:
$2,903
(% of AGI for various income ranges: 0.6% for AGIs below $10k, 0.3% for AGIs $10k-25k, 0.3% for AGIs $25k-50k, 0.2% for AGIs $50k-75k, 0.2% for AGIs $75k-100k, 0.1% for AGIs over 100k)
Self-employed pension: $15,716 (reported on 2.1% of returns)
Here:
$15,716
Pennsylvania:
$14,674
(% of AGI for various income ranges: 0.1% for AGIs $10k-25k, 0.1% for AGIs $25k-50k, 0.3% for AGIs $50k-75k, 0.2% for AGIs $75k-100k, 0.5% for AGIs over 100k)
Total itemized deductions: $23,836 (18% of AGI, reported on 50.6% of returns)
Here:
$23,836
State:
$18,804
Here:
17.7% of AGI
State:
19.5% of AGI
(% of AGI for various income ranges: 17.8% for AGIs below $10k, 15.2% for AGIs $10k-25k, 14.7% for AGIs $25k-50k, 18.0% for AGIs $50k-75k, 19.5% for AGIs $75k-100k, 13.5% for AGIs over 100k)
Charity contributions deductions: $3,329 (2% of AGI, reported on 47.4% of returns)
Here:
$3,329
State:
$3,337
Here:
2.4% of AGI
State:
3.3% of AGI
(% of AGI for various income ranges: 1.1% for AGIs below $10k, 1.1% for AGIs $10k-25k, 1.6% for AGIs $25k-50k, 2.0% for AGIs $50k-75k, 2.2% for AGIs $75k-100k, 2.0% for AGIs over 100k)
Total tax: $16,106 (reported on 81.5% of returns)
19067:
$16,106
State:
$8,008
(% of AGI for various income ranges: 4.0% for AGIs below $10k, 4.9% for AGIs $10k-25k, 7.9% for AGIs $25k-50k, 10.1% for AGIs $50k-75k, 10.5% for AGIs $75k-100k, 19.6% for AGIs over 100k)
Earned income credit: $1,452 (reported on 6.5% of returns)
Here:
$1,452
State:
$1,643
Percentage of individuals using paid preparers for their 2004 taxes: 58.7%
Here:
59%
State:
56%
(% for various income ranges: 49.9% for AGIs below $10k, 60.3% for AGIs $10k-25k, 58.4% for AGIs $25k-50k, 60.6% for AGIs $50k-75k, 60.2% for AGIs $75k-100k, 63.2% for AGIs over 100k)
Likely homosexual households (counted as self-reported same-sex unmarried-partner households)
Lesbian couples: 0.1% of all households
Gay men: 0.2% of all households
Household received Food Stamps/SNAP in the past 12 months: 1,664 Household did not receive Food Stamps/SNAP in the past 12 months: 19,570
Women who had a birth in the past 12 months: 428 (372 now married, 68 unmarried) Women who did not have a birth in the past 12 months: 10,303 (5,144 now married, 5,123 unmarried)
Housing units in zip code 19067 with a mortgage: 10,795 (1,258 second mortgage, 45 home equity loan, 1,069 both second mortgage and home equity loan) Houses without a mortgage: 625
Median monthly owner costs for units with a mortgage: $2,603 Median monthly owner costs for units without a mortgage: $1,061
Residents with income below the poverty level in 2022:
This zip code:
4.9%
Whole state:
11.8%
Residents with income below 50% of the poverty level in 2022:
This zip code:
2.1%
Whole state:
6.1%
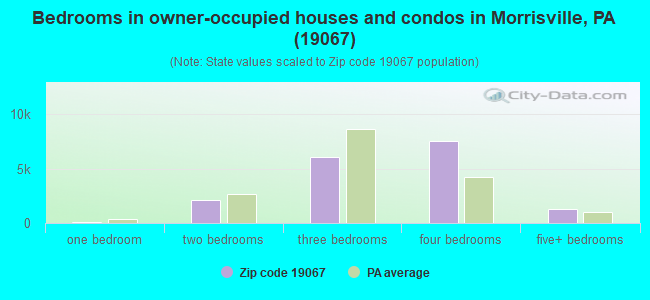
Median number of rooms in houses and condos:
Here:
7.6
State:
6.8
Median number of rooms in apartments:
Here:
4.1
State:
4.3
Notable locations in this zip code not listed on our city pages
Notable locations in zip code 19067: Penn Trailer Court (A), Pennwood Crossing Trailer Park (B), Cedar Lake Trailer Park (C), Warner Station (D). Display/hide their locations on the map
8,167 married couples with children.
2,179 single-parent households (492 men, 1,687 women).
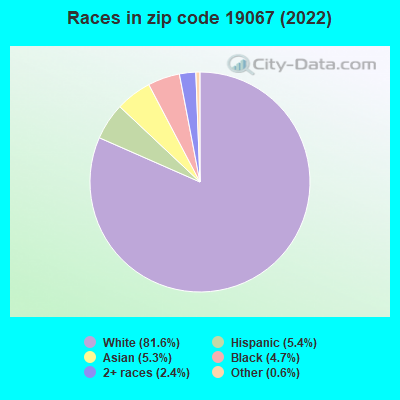
88.1% of residents of 19067 zip code speak English at home.
2.3% of residents speak Spanish at home (72% very well, 17% well, 11% not well).
6.3% of residents speak other Indo-European language at home (65% very well, 24% well, 11% not well).
2.3% of residents speak Asian or Pacific Island language at home (55% very well, 27% well, 7% not well, 11% not at all).
0.7% of residents speak other language at home (35% very well, 49% well, 13% not well, 3% not at all).
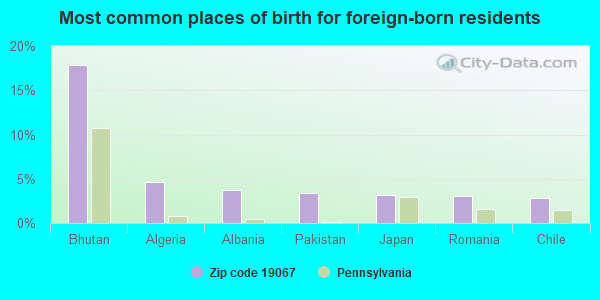
Foreign born population: 5,704 (10.7%) (62.0% of them are naturalized citizens)
Facilities with environmental interests located in this zip code:
AIR LIQUIDE ELECTRONICS GP LLC (19 STEEL ROAD WEST in MORRISVILLE, PA)
AIR MINOR (AIRS/AFS) STATE MASTER (Pennsylvania database) - AFS-55-0884195-1, AIR PROGRAM National Pollutant Discharge Elimination System NON-MAJOR (Tracking pollutant discharge elimination systems) - permit HAZARDOUS WASTE BIENNIAL REPORTER (Resource Conservation and Recovery Act (tracking hazardous waste)) Large Quantity Generators, more that 1000 kg of hazardous waste/month (Resource Conservation and Recovery Act (tracking hazardous waste)) TRI REPORTER (Tracking of toxic chemicals releasing facilities) Business SIC classification: INDUSTRIAL GASES Organizations: AIR LIQUIDE AMERICA LP (CONTACT/OPERATOR)
, AIR LIQUIDE AMERICA L.P. (CONTACT/OWNER)
Alternative names: AIR LIQUIDE AMERICA CORP, AIR LIQUIDE AMER MFG PLT, AIR LIQUIDE MORRISVILLE PENNSYLVANIA PLANT, ALPHAGAZ/AIR LIQUIDE, ALPHAGAZ DIV LIQUID AIR CORP
AIR PROD & CHEM (351 PHILADELPHIA AVENUE in MORRISVILLE, PA)
AIR MINOR (AIRS/AFS) CRITERIA AND HAZARDOUS AIR POLLUTANT INVENTORY (Inventory of air pollution sources) STATE MASTER (Pennsylvania database) - AFS-23-1274455-5, AIR PROGRAM, RCRIS-PAD065407132, HAZARDOUS WASTE PROGRAM, RCRIS-PAD981111735, HAZARDOUS WASTE BIENNIAL REPORTER (Resource Conservation and Recovery Act (tracking hazardous waste)) Large Quantity Generators, more that 1000 kg of hazardous waste/month (Resource Conservation and Recovery Act (tracking hazardous waste)) - notification TRI REPORTER (Tracking of toxic chemicals releasing facilities) Business SIC classification: INDUSTRIAL GASES; CHEMICALS AND CHEMICAL PREPARATIONS Business NAICS classification: INDUSTRIAL GAS MANUFACTURING. Organizations: AIR PRODUCTS AND CHEMICALS INC (CONTACT/OPERATOR)
, AIR PRODUCTS AND CHEMICALS, INC. (CONTACT/OWNER)
Alternative names: AIR PRODS. & CHEMICALS INC., SOLKATRONIC, SOLKATRONIC CHEMICALS INC., SOLKATRONIC CHEMICALS BUSINESS UNIT OF AIR PRODS. & CHEM, SOLKATRONIC CHEM GAS MFG
ASHLAND DISTR (1101 NEW FORD MILL RD in MORRISVILLE, PA)
STATE MASTER (Pennsylvania database) - RCRIS-PAD043566595, HAZARDOUS WASTE PROGRAM HAZARDOUS WASTE BIENNIAL REPORTER (Resource Conservation and Recovery Act (tracking hazardous waste)) Large Quantity Generators, more that 1000 kg of hazardous waste/month (Resource Conservation and Recovery Act (tracking hazardous waste)) Organizations: ASHLAND DISTRIBUTION CO. (CONTACT/OPERATOR)
, ASHLAND INC (CONTACT/OWNER)
, ASHLAND DISTRIBUTION COMPANY, A DIVISION OF ASHLAND INC. (CONTACT/OWNER)
Alternative names: ASHLAND CHEM CO, ASHLAND DISTRIBUTION CO
BAYER MATERIALSCIENCE LLC (1 PROGRESS DR USX IND PARK in MORRISVILLE, PA)
STATE MASTER (Pennsylvania database) - RCRIS-PAR000019570, HAZARDOUS WASTE PROGRAM Large Quantity Generators, more that 1000 kg of hazardous waste/month (Resource Conservation and Recovery Act (tracking hazardous waste)) - notification Organizations: SANJAYLAN CO LLC (CONTACT/OWNER)
, BAYER POLYMERS LLC (OWNER/OPERATOR)
Alternative names: BAYER CORP NEDC, NORTHEAST DISTRIBUTION CENTER
BASIC CHEM SOLUTIONS MORRISVILLE FAC (5 STEEL RD E in MORRISVILLE, PA)
AIR MINOR (AIRS/AFS) STATE MASTER (Pennsylvania database) - AFS-22-3367517-1, AIR PROGRAM TRI REPORTER (Tracking of toxic chemicals releasing facilities) Business SIC classification: CHEMICALS AND ALLIED PRODUCTS Organizations: BASIC CHEMICAL SOLUTIONS, LLC (CONTACT/OWNER)
Alternative names: BASIC CHEMICAL SOLUTIONS L L C, BASIC CHEMICAL SOLUTIONS LLC, BASIC CHEM SOLUTIONS LLC/MORRISVILLE, BASIC CHEMICAL SOULTIONS L L C
BLUE CHIP PROD PLNT (1101 NEW FORD ROAD in MORRISVILLE, PA)
COMPLIANCE ACTIVITY (Tracking inspections of insecticide, fungicide, and rodenticide, and toxic substances) STATE MASTER (Pennsylvania database) - RCRIS-PAD049618986, HAZARDOUS WASTE PROGRAM (Resource Conservation and Recovery Act (tracking hazardous waste)) Business SIC classification: COATING, ENGRAVING, AND ALLIED SERVICES; PUMPS AND PUMPING EQUIPMENT Business NAICS classification: MECHANICAL POWER TRANSMISSION EQUIPMENT MANUFACTURING.; PUMP AND PUMPING EQUIPMENT MANUFACTURING.; MOTOR AND GENERATOR MANUFACTURING.; RELAY AND INDUSTRIAL CONTROL MANUFACTURING.; OTHER MOTOR VEHICLE ELECTRICAL AND ELECTRONIC EQUIPMENT MANUFACTURING. Alternative names: BLUE CHIP PRODUCTS
AFTON EL SCH ( in YARDLEY, PA)
(National Center for Education Statistics) - STATE ID-7519 Organizations: PENNSBURY SD (SCHOOL DISTRICT)
BEECHAM PRODUCTS MORRISVILLE PLANT (PO BOX 269 POST ROAD in MORRISVILLE, PA)
ALLIED WASTE SERVICES (MORRISVILLE FAC in MORRISVILLE, PA)
National Pollutant Discharge Elimination System NON-MAJOR (Tracking pollutant discharge elimination systems) - permit Business SIC classification: LOCAL TRUCKING WITHOUT STORAGE Alternative names: ALLIED WASTE SERVICES/MORRISVI, BFI WASTE SVC OF PA LLC
BARRETT ASPHALT INC/MORRISVILLE (STEEL RD NORTH in MORRISVILLE, PA)
AIR MINOR (AIRS/AFS) Business SIC classification: ASPHALT PAVING MIXTURES AND BLOCKS Alternative names: ARAWAK PAVING CO
ABRAMS HEBREW ACADEMY (31 WEST COLLEGE AVENUE in YARDLEY, PA)
(Geographic Names Information System) COMPLIANCE ACTIVITY (Tracking inspections of insecticide, fungicide, and rodenticide, and toxic substances)
Housing units lacking complete plumbing facilities: 1.4% Housing units lacking complete kitchen facilities: 1.0%
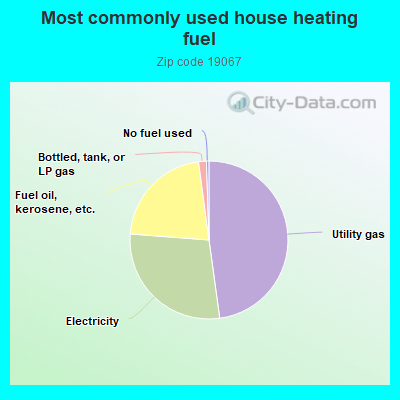
47.5%Utility gas
28.2%Electricity
21.5%Fuel oil, kerosene, etc.
1.6%Bottled, tank, or LP gas
0.5%No fuel used
Population in 1990: 47,492. Population change in the 1990s: +5,720 (+12.0%).
Place of birth for U.S.-born residents:
This state: 23,206
Northeast: 18,603
Midwest: 1,961
South: 2,834
West: 1,005
62% of the 19067 zip code residents lived in the same house 5 years ago. Out of people who lived in different houses, 50% lived in this county. Out of people who lived in different counties, 50% lived in Pennsylvania.
92% of the 19067 zip code residents lived in the same house 1 year ago. Out of people who lived in different houses, 51% moved from this county. Out of people who lived in different houses, 12% moved from different county within same state. Out of people who lived in different houses, 37% moved from different state. Out of people who lived in different houses, 2% moved from abroad.
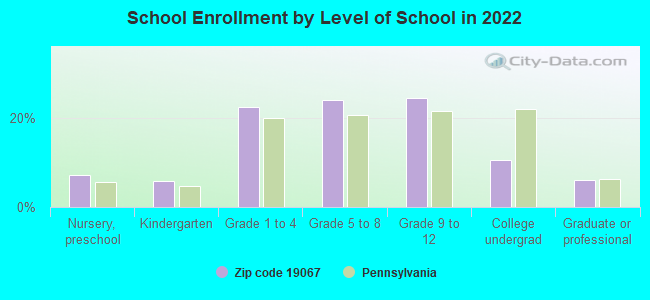
Private vs. public school enrollment:
Students in private schools in grades 1 to 8 (elementary and middle school): 588
Here:
11.1%
Pennsylvania:
15.7%
Students in private schools in grades 9 to 12 (high school): 712
Here:
25.4%
Pennsylvania:
13.4%
Students in private undergraduate colleges: 309
Here:
25.2%
Pennsylvania:
39.8%
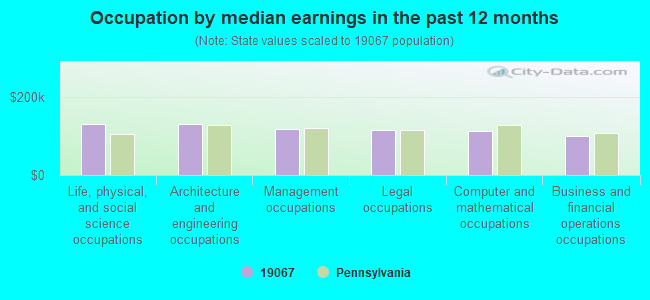
Occupation by median earnings in the past 12 months ($)
129,935Life, physical, and social science occupations
129,661Architecture and engineering occupations
119,013Management occupations
115,798Legal occupations
113,022Computer and mathematical occupations
99,173Business and financial operations occupations
Companies with biggest federal contracts located in this zip code:
MICRODISC, INC (301 OXFORD VALLEY ROAD in YARDLEY, PA; small business) : $3,163,849 in 36 contractsfrom 2000 to 2006
Contracts for Miscellaneous Electrical and Electronic Components, Photographic Supplies, Other Professional Services, ADP Support Equipment, and moreby Navy, Defense Logistics Agency, Army Signed by year:2000: $1,003,546; 2001: $615,630; 2002: $996,724; 2003: $0; 2004: $140,980; 2005: $369,799; 2006: $37,170.
Biggest contracts:
$465,346 with Navy for Miscellaneous Electrical and Electronic Components. Signed on 2002-09-30. Completion date: 2002-11-30.
$446,694 with Defense Logistics Agency for Photographic Supplies. Signed on 2000-09-21. Completion date: 2001-01-09.
$421,821 with Navy for Other Professional Services. Signed on 2004-03-08. Completion date: 2005-12-31.
$205,200 with Defense Logistics Agency for Photographic Supplies. Signed on 2001-11-26. Completion date: 2002-01-15.
RHOMBIC SYSTEMS (1701 S CRESCENT in YARDLEY, PA) : $3,070,973 in 29 contractsfrom 2000 to 2003
Contracts for Engineering and Technical Services, Other Architect and Engineering Services by Navy Signed by year:2000: $428,692; 2001: $612,895; 2002: $1,524,946; 2003: $504,440; 2004: $0; 2005: $0; 2006: $0.
Biggest contracts:
$533,091 with Navy for Engineering and Technical Services. Taking place in MD. Signed on 2001-06-13. Completion date: 2001-12-31.
$285,891 with Navy for Engineering and Technical Services. Signed on 2002-03-20. Completion date: 2002-12-31.
$282,927, same as above.Signed on 2002-07-24. Completion date: 2002-09-30.
$229,500, same as above.Signed on 2002-03-20. Completion date: 2002-12-31.
MG INDUSTRIES INC (1 STEEL RD E in MORRISVILLE, PA) : $1,100,575 in 16 contractsfrom 1999 to 2000
Contracts for Liquid Propellant Fuels and Oxidizers, Chemical Base by Air Force Signed by year:2000: $916,428; 2001: $0; 2002: $0; 2003: $0; 2004: $0; 2005: $0; 2006: $0.
Biggest contracts:
$135,380 with Air Force for Liquid Propellant Fuels and Oxidizers, Chemical Base. Signed on 2000-01-31. Completion date: 2000-03-30.
$116,457, same as above.Signed on 1999-12-10. Completion date: 2001-11-01.
$110,755, same as above.Signed on 2000-05-03. Completion date: 2000-12-31.
$107,082, same as above.Signed on 2000-01-31. Completion date: 2001-11-01.
CARLYLE CONSULTING (1009 BUCKINGHAM WAY in YARDLEY, PA; small business) : $798,240 in 14 contractsfrom 2001 to 2005
Contracts for Engineering -- Applied Research and Exploratory Development (R&D), Engineering -- Basic Research (R&D), Water Pollution -- Applied Research and Exploratory Development (R&D), Engineering and Technical Services, and moreby Army, U.S. Army Corps of Engineers - civil program financing only Signed by year:2000: $0; 2001: $89,928; 2002: $84,989; 2003: $109,588; 2004: $135,378; 2005: $378,357; 2006: $0.
Biggest contracts:
$330,125 with Army for Engineering -- Applied Research and Exploratory Development (R&D). Signed on 2005-10-27. Completion date: 2006-12-26.
$89,928 with Army for Engineering -- Basic Research (R&D). Signed on 2001-09-25. Completion date: 2002-09-30.
$79,970 with Army for Water Pollution -- Applied Research and Exploratory Development (R&D). Taking place in TX. Signed on 2004-06-18. Completion date: 2005-06-18.
$77,499 with Army for Engineering and Technical Services. Signed on 2003-01-29. Completion date: 2003-04-15.
KLIPPER CONSTRUCTION ASSOCIATI (301 OXFORD VALLEYRD in YARDLEY, PA; small business) : $487,312 in 6 contractsfrom 1999 to 2003
Contracts for Maintenance, Repair or Alteration of Real Property -- Other Utilities, Maintenance, Repair or Alteration of Real Property -- Other Non-Building Facilities, Construction of Structures and Facilities -- Other Administrative Facilities and Service Buildings, Maintenance, Repair or Alteration of Real Property -- Other Airfield Structures by Navy, U.S. Army Corps of Engineers - civil program financing only, Army Signed by year:2000: $0; 2001: $1,758; 2002: $112,213; 2003: $208,716; 2004: $0; 2005: $0; 2006: $0.
Biggest contracts:
$208,716 with Navy for Maintenance, Repair or Alteration of Real Property -- Other Utilities. Taking place in NJ. Signed on 2003-03-05. Completion date: 1999-08-07.
$164,625 with U.S. Army Corps of Engineers - civil program financing only for Maintenance, Repair or Alteration of Real Property -- Other Non-Building Facilities. Taking place in NJ. Signed on 1999-11-05. Completion date: 2000-02-08.
$112,213 with Army for Construction of Structures and Facilities -- Other Administrative Facilities and Service Buildings. Taking place in NC. Signed on 2002-04-04. Completion date: 1999-10-14.
$53,000 with U.S. Army Corps of Engineers - civil program financing only for Maintenance, Repair or Alteration of Real Property -- Other Non-Building Facilities. Taking place in NJ. Signed on 2000-08-01. Completion date: 2000-05-18.
PENNSBURY EXCAVATING & LANDSCA (1414 BRISTOL PIKE in MORRISVILLE, PA; small business)
$325,000 with U.S. Army Corps of Engineers - civil program financing only for Lease or Rental of Equipment -- Construction, Mining, Excavating, and Highway Maintenance Equipment. Signed on 2000-07-31. Completion date: 2000-12-31.
WASTE MANAGEMENT OF PENNSYLVAN (1121 BORDENTOWN RD in MORRISVILLE, PA) : $235,067 in 27 contractsfrom 2003 to 2006
Contracts for Trash/Garbage Collection Services - Including Portable Sanitation Services, Waste Treatment and Storage by Department of Veterans Affairs, Army, Bureau of Prisoners/Federal Prison System, National Park Service, and others Signed by year:2000: $0; 2001: $0; 2002: $0; 2003: $1,875; 2004: $65,116; 2005: $140,026; 2006: $28,050.
Biggest contracts:
$52,800 with Department of Veterans Affairs for Trash/Garbage Collection Services - Including Portable Sanitation Services. Taking place in DE. Signed on 2005-10-01. Completion date: 2005-09-30.
$52,720, same as above.Signed on 2004-10-01. Completion date: 2005-09-30.
$12,840 with Army for Trash/Garbage Collection Services - Including Portable Sanitation Services. Signed on 2005-11-28. Completion date: 2005-09-30.
$12,396, same as above.Signed on 2004-10-01. Completion date: 2005-09-30.
BASIC CHEMICAL SOLUTIONS, LLC (5 STEEL ROAD EAST in MORRISVILLE, MA; small business) : $105,386 in 9 contractsfrom 2001 to 2005
Contracts for Chemicals, Paints, Dopes, Varnishes, and Related Products, Technical Representation Services -- Chemicals and Chemical Products by Navy, Army, U.S. Army Corps of Engineers - civil program financing only Signed by year:2000: $0; 2001: $7,537; 2002: $0; 2003: $37,441; 2004: $58,568; 2005: $1,840; 2006: $0.
Biggest contracts:
$38,341 with Navy for Chemicals. Signed on 2004-09-23. Completion date: 2005-09-30.
$37,441, same as above.Signed on 2003-10-03. Completion date: 2004-09-30.
$14,720 with Army for Paints, Dopes, Varnishes, and Related Products. Signed on 2005-02-17. Completion date: 2006-02-17.
$7,537 with Navy for Chemicals. Signed on 2001-11-29. Completion date: 2001-12-31.
HEALTH INK & VITALITY COMMUNIC (780 TOWNSHIP LINE RD in YARDLEY, PA; small business) : $77,141 in 7 contractsfrom 2003 to 2006
Contracts for Medical and Surgical Instruments, Equipment, and Supplies, Miscellaneous Items, Newspapers and Periodicals, Books and Pamphlets by Army, Defense Logistics Agency, Air Force, Department of Veterans Affairs, and others Signed by year:2000: $0; 2001: $0; 2002: $0; 2003: $54,021; 2004: $5,412; 2005: $17,468; 2006: $240.
Biggest contracts:
$54,021 with Army for Medical and Surgical Instruments, Equipment, and Supplies. Taking place in GA. Signed on 2003-06-13. Completion date: 2003-06-30.
$5,852 with Defense Logistics Agency for Miscellaneous Items. Signed on 2005-07-27. Completion date: 2005-08-01.
$5,412 with Air Force for Newspapers and Periodicals. Signed on 2004-10-01. Completion date: 2005-09-30.
$4,896 with Air Force for Books and Pamphlets. Signed on 2005-09-14. Completion date: 2005-09-12.
INTERNATIONAL INTELLECTUAL PRO (321 RICHARD ROAD in MORRISVILLE, PA) : $37,097 in 3 contractsfrom 2003 to 2004
$17,465 with Navy for General Photographic Services - Still. Signed on 2003-04-07. Completion date: 2003-04-07.
$17,183 with Navy for Photographic Sets, Kits, and Outfits. Signed on 2003-11-20. Completion date: 2003-11-24.
$2,449, same as above.Signed on 2004-04-01. Completion date: 2003-11-24.
Top industries in this zip code by the number of employees in 2005:
Wholesale Trade: Other Chemical and Allied Products Merchant Wholesalers (250-499 employees: 1 establishment, 100-249 employees: 1 establishment, 50-99 employees: 1 establishment, 20-49 employees: 5 establishments, 1-4 employees: 5 establishments)
Other Services (except Public Administration): Religious Organizations (50-99: 2, 20-49: 4, 5-9: 5, 1-4: 4)
Professional, Scientific, and Technical Services: Research and Development in the Physical, Engineering, and Life Sciences (100-249: 1, 50-99: 1, 20-49: 2, 1-4: 6)
People in group quarters in 2010:
176 people in nursing facilities/skilled-nursing facilities
128 people in group homes intended for adults
People in group quarters in 2000:
113 people in nursing homes
89 people in other nonhousehold living situations
44 people in other group homes
31 people in homes or halfway houses for drug/alcohol abuse
17 people in other noninstitutional group quarters
8 people in religious group quarters
7 people in agriculture workers' dormitories on farms
2 people in homes for the mentally retarded
Home Mortgage Disclosure Act Aggregated Statistics For Year 2009 (Based on 7 full and 16 partial tracts)
A) FHA, FSA/RHS & VA Home Purchase Loans
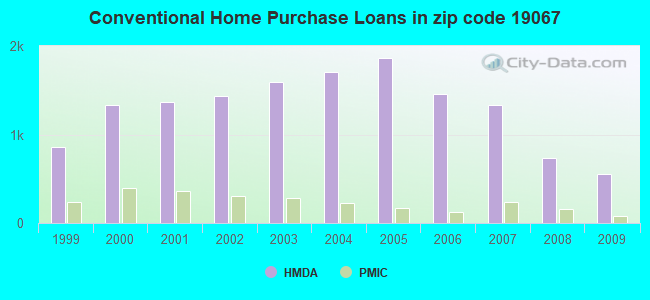
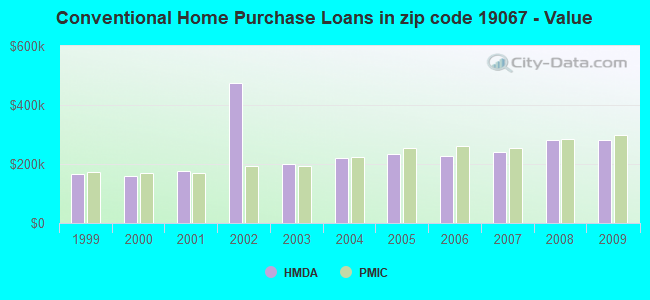
B) Conventional Home Purchase Loans
C) Refinancings
D) Home Improvement Loans
E) Loans on Dwellings For 5+ Families
F) Non-occupant Loans on < 5 Family Dwellings (A B C & D)
G) Loans On Manufactured Home Dwelling (A B C & D)
Number
Average Value
Number
Average Value
Number
Average Value
Number
Average Value
Number
Average Value
Number
Average Value
Number
Average Value
LOANS ORIGINATED
302
$241,370
551
$282,076
2,866
$251,054
168
$113,402
2
$19,346,280
69
$208,356
10
$61,091
APPLICATIONS APPROVED, NOT ACCEPTED
10
$287,891
74
$321,058
263
$257,471
16
$100,821
0
$0
13
$170,409
12
$50,556
APPLICATIONS DENIED
21
$211,011
48
$240,889
744
$256,267
74
$91,652
0
$0
34
$181,443
13
$47,812
APPLICATIONS WITHDRAWN
40
$221,214
71
$299,961
544
$250,436
17
$129,447
0
$0
3
$292,560
1
$19,150
FILES CLOSED FOR INCOMPLETENESS
10
$255,704
24
$240,488
144
$249,400
2
$236,510
0
$0
3
$210,517
2
$44,680
Aggregated Statistics For Year 2008 (Based on 7 full and 16 partial tracts)
A) FHA, FSA/RHS & VA Home Purchase Loans
B) Conventional Home Purchase Loans
C) Refinancings
D) Home Improvement Loans
E) Loans on Dwellings For 5+ Families
F) Non-occupant Loans on < 5 Family Dwellings (A B C & D)
G) Loans On Manufactured Home Dwelling (A B C & D)
Number
Average Value
Number
Average Value
Number
Average Value
Number
Average Value
Number
Average Value
Number
Average Value
Number
Average Value
LOANS ORIGINATED
169
$244,233
736
$279,862
1,417
$206,139
278
$59,393
5
$487,226
120
$204,253
17
$51,735
APPLICATIONS APPROVED, NOT ACCEPTED
13
$230,888
101
$265,581
360
$212,374
93
$64,039
0
$0
33
$209,011
6
$78,517
APPLICATIONS DENIED
14
$209,685
74
$220,634
724
$248,513
162
$75,950
0
$0
39
$147,843
21
$63,126
APPLICATIONS WITHDRAWN
17
$219,684
69
$279,488
309
$235,492
21
$110,467
2
$2,259,000
19
$203,998
0
$0
FILES CLOSED FOR INCOMPLETENESS
0
$0
21
$269,777
67
$253,847
15
$112,111
0
$0
4
$239,455
2
$55,620
Aggregated Statistics For Year 2007 (Based on 7 full and 16 partial tracts)
A) FHA, FSA/RHS & VA Home Purchase Loans
B) Conventional Home Purchase Loans
C) Refinancings
D) Home Improvement Loans
E) Loans on Dwellings For 5+ Families
F) Non-occupant Loans on < 5 Family Dwellings (A B C & D)
G) Loans On Manufactured Home Dwelling (A B C & D)
Number
Average Value
Number
Average Value
Number
Average Value
Number
Average Value
Number
Average Value
Number
Average Value
Number
Average Value
LOANS ORIGINATED
37
$244,410
1,330
$239,432
1,553
$202,535
460
$76,585
3
$468,993
135
$181,977
17
$55,206
APPLICATIONS APPROVED, NOT ACCEPTED
1
$419,870
154
$224,287
363
$209,527
91
$57,954
0
$0
24
$226,786
9
$39,891
APPLICATIONS DENIED
9
$209,222
143
$226,469
780
$219,359
205
$82,665
2
$305,415
64
$228,712
30
$39,340
APPLICATIONS WITHDRAWN
7
$253,083
124
$259,252
334
$236,497
47
$76,557
0
$0
24
$216,396
1
$25,530
FILES CLOSED FOR INCOMPLETENESS
0
$0
51
$205,801
152
$274,301
4
$164,388
0
$0
5
$310,334
0
$0
Aggregated Statistics For Year 2006 (Based on 7 full and 16 partial tracts)
A) FHA, FSA/RHS & VA Home Purchase Loans
B) Conventional Home Purchase Loans
C) Refinancings
D) Home Improvement Loans
E) Loans on Dwellings For 5+ Families
F) Non-occupant Loans on < 5 Family Dwellings (A B C & D)
G) Loans On Manufactured Home Dwelling (A B C & D)
Number
Average Value
Number
Average Value
Number
Average Value
Number
Average Value
Number
Average Value
Number
Average Value
Number
Average Value
LOANS ORIGINATED
40
$233,355
1,457
$227,436
1,794
$192,238
505
$80,063
7
$1,459,501
162
$196,174
13
$45,208
APPLICATIONS APPROVED, NOT ACCEPTED
2
$280,310
194
$202,413
382
$174,319
95
$99,073
0
$0
16
$134,995
17
$41,470
APPLICATIONS DENIED
5
$238,928
156
$212,493
821
$203,536
243
$77,612
1
$160,000
55
$147,777
34
$45,086
APPLICATIONS WITHDRAWN
4
$306,218
161
$236,806
558
$212,303
56
$86,699
0
$0
27
$152,303
1
$38,300
FILES CLOSED FOR INCOMPLETENESS
0
$0
43
$255,616
140
$235,981
16
$77,166
0
$0
4
$109,550
0
$0
Aggregated Statistics For Year 2005 (Based on 7 full and 16 partial tracts)
A) FHA, FSA/RHS & VA Home Purchase Loans
B) Conventional Home Purchase Loans
C) Refinancings
D) Home Improvement Loans
E) Loans on Dwellings For 5+ Families
F) Non-occupant Loans on < 5 Family Dwellings (A B C & D)
G) Loans On Manufactured Home Dwelling (A B C & D)
Number
Average Value
Number
Average Value
Number
Average Value
Number
Average Value
Number
Average Value
Number
Average Value
Number
Average Value
LOANS ORIGINATED
28
$184,690
1,867
$235,542
2,472
$195,080
592
$82,281
5
$3,349,406
176
$173,690
26
$41,920
APPLICATIONS APPROVED, NOT ACCEPTED
0
$0
215
$222,667
425
$179,811
144
$72,869
2
$3,698,540
20
$114,724
26
$51,790
APPLICATIONS DENIED
3
$85,710
211
$183,401
788
$189,250
289
$70,373
0
$0
47
$110,219
51
$52,142
APPLICATIONS WITHDRAWN
10
$195,707
288
$220,308
719
$199,109
125
$142,830
0
$0
44
$241,926
7
$122,360
FILES CLOSED FOR INCOMPLETENESS
0
$0
46
$232,140
264
$234,046
16
$61,883
0
$0
16
$167,996
0
$0
Aggregated Statistics For Year 2004 (Based on 7 full and 16 partial tracts)
A) FHA, FSA/RHS & VA Home Purchase Loans
B) Conventional Home Purchase Loans
C) Refinancings
D) Home Improvement Loans
E) Loans on Dwellings For 5+ Families
F) Non-occupant Loans on < 5 Family Dwellings (A B C & D)
G) Loans On Manufactured Home Dwelling (A B C & D)
Number
Average Value
Number
Average Value
Number
Average Value
Number
Average Value
Number
Average Value
Number
Average Value
Number
Average Value
LOANS ORIGINATED
52
$173,511
1,702
$221,340
2,691
$179,457
512
$66,777
24
$4,380,202
175
$149,625
13
$53,214
APPLICATIONS APPROVED, NOT ACCEPTED
2
$174,220
205
$234,188
499
$165,037
96
$64,708
0
$0
37
$156,500
7
$34,761
APPLICATIONS DENIED
3
$124,503
201
$180,974
882
$177,557
254
$58,557
0
$0
70
$128,690
40
$28,007
APPLICATIONS WITHDRAWN
12
$163,263
188
$225,691
671
$181,537
86
$82,714
2
$6,092,860
27
$143,159
6
$89,467
FILES CLOSED FOR INCOMPLETENESS
0
$0
49
$209,992
307
$218,167
29
$59,259
0
$0
16
$162,509
0
$0
Aggregated Statistics For Year 2003 (Based on 7 full and 16 partial tracts)
A) FHA, FSA/RHS & VA Home Purchase Loans
B) Conventional Home Purchase Loans
C) Refinancings
D) Home Improvement Loans
E) Loans on Dwellings For 5+ Families
F) Non-occupant Loans on < 5 Family Dwellings (A B C & D)
Number
Average Value
Number
Average Value
Number
Average Value
Number
Average Value
Number
Average Value
Number
Average Value
LOANS ORIGINATED
63
$142,847
1,595
$199,728
7,426
$174,376
376
$73,100
6
$946,383
274
$140,304
APPLICATIONS APPROVED, NOT ACCEPTED
0
$0
181
$186,648
1,038
$159,158
155
$56,640
2
$419,270
40
$136,908
APPLICATIONS DENIED
16
$139,117
162
$159,619
1,228
$161,877
133
$47,951
0
$0
43
$72,982
APPLICATIONS WITHDRAWN
6
$139,488
181
$201,114
866
$170,595
74
$46,168
2
$542,160
20
$142,379
FILES CLOSED FOR INCOMPLETENESS
1
$233,100
47
$231,563
314
$173,220
40
$59,316
0
$0
16
$119,674
Aggregated Statistics For Year 2002 (Based on 7 full and 16 partial tracts)
A) FHA, FSA/RHS & VA Home Purchase Loans
B) Conventional Home Purchase Loans
C) Refinancings
D) Home Improvement Loans
E) Loans on Dwellings For 5+ Families
F) Non-occupant Loans on < 5 Family Dwellings (A B C & D)
Number
Average Value
Number
Average Value
Number
Average Value
Number
Average Value
Number
Average Value
Number
Average Value
LOANS ORIGINATED
89
$134,929
1,439
$475,789
4,772
$248,163
353
$51,342
7
$781,641
195
$121,822
APPLICATIONS APPROVED, NOT ACCEPTED
4
$159,895
137
$182,629
732
$153,968
132
$40,962
0
$0
31
$100,943
APPLICATIONS DENIED
2
$137,235
121
$118,815
842
$139,318
156
$39,976
2
$1,021,965
30
$92,749
APPLICATIONS WITHDRAWN
14
$125,676
109
$1,162,401
626
$225,381
39
$62,276
0
$0
14
$121,181
FILES CLOSED FOR INCOMPLETENESS
0
$0
44
$172,157
261
$166,563
22
$41,119
0
$0
2
$67,385
Aggregated Statistics For Year 2001 (Based on 7 full and 16 partial tracts)
A) FHA, FSA/RHS & VA Home Purchase Loans
B) Conventional Home Purchase Loans
C) Refinancings
D) Home Improvement Loans
E) Loans on Dwellings For 5+ Families
F) Non-occupant Loans on < 5 Family Dwellings (A B C & D)
Number
Average Value
Number
Average Value
Number
Average Value
Number
Average Value
Number
Average Value
Number
Average Value
LOANS ORIGINATED
123
$129,445
1,367
$175,830
3,061
$154,085
408
$35,572
5
$1,016,172
98
$122,139
APPLICATIONS APPROVED, NOT ACCEPTED
4
$146,512
120
$170,481
425
$126,388
129
$35,968
0
$0
8
$92,628
APPLICATIONS DENIED
6
$132,942
157
$99,788
664
$123,588
181
$33,648
0
$0
27
$70,992
APPLICATIONS WITHDRAWN
6
$114,070
85
$174,074
444
$130,503
66
$35,610
0
$0
10
$111,824
FILES CLOSED FOR INCOMPLETENESS
2
$125,555
33
$178,032
156
$133,916
15
$62,078
0
$0
5
$57,112
Aggregated Statistics For Year 2000 (Based on 7 full and 16 partial tracts)
A) FHA, FSA/RHS & VA Home Purchase Loans
B) Conventional Home Purchase Loans
C) Refinancings
D) Home Improvement Loans
F) Non-occupant Loans on < 5 Family Dwellings (A B C & D)
Number
Average Value
Number
Average Value
Number
Average Value
Number
Average Value
Number
Average Value
LOANS ORIGINATED
138
$118,980
1,328
$159,450
662
$94,420
441
$31,387
48
$89,478
APPLICATIONS APPROVED, NOT ACCEPTED
3
$88,253
182
$180,910
219
$84,989
127
$32,882
14
$109,195
APPLICATIONS DENIED
12
$130,178
198
$88,132
379
$90,976
167
$31,543
20
$78,240
APPLICATIONS WITHDRAWN
9
$104,761
107
$183,753
260
$94,935
71
$58,689
13
$77,688
FILES CLOSED FOR INCOMPLETENESS
2
$177,525
21
$135,356
93
$125,553
7
$68,710
2
$113,775
Aggregated Statistics For Year 1999 (Based on 5 full and 8 partial tracts)
A) FHA, FSA/RHS & VA Home Purchase Loans
B) Conventional Home Purchase Loans
C) Refinancings
D) Home Improvement Loans
E) Loans on Dwellings For 5+ Families
F) Non-occupant Loans on < 5 Family Dwellings (A B C & D)
2003 - 2018 National Fire Incident Reporting System (NFIRS) incidents
According to the data from the years 2003 - 2018 the average number of fires per year is 74. The highest number of reported fires - 171 took place in 2006, and the least - 9 in 2014. The data has a rising trend.
When looking into fire subcategories, the most incidents belonged to: Structure Fires (65.9%), and Other (15.1%).
Fire incident types reported to NFIRS in Zip Code 19067

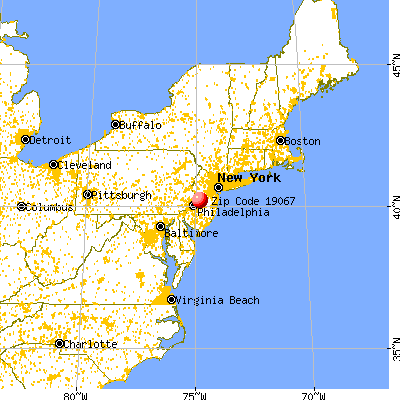


 Nearest zip codes: 19030, 19054, 08618, 08608, 08628, 19055.
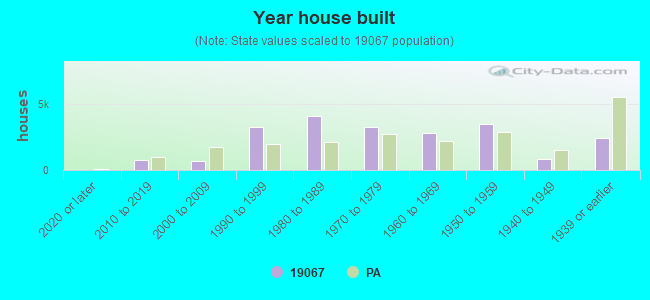


 According to the data from the years 2003 - 2018 the average number of fires per year is 74. The highest number of reported fires - 171 took place in 2006, and the least - 9 in 2014. The data has a rising trend.
 When looking into fire subcategories, the most incidents belonged to: Structure Fires (65.9%), and Other (15.1%).