Estimated zip code population in 2022: 7,875 Zip code population in 2010: 6,895 Zip code population in 2000: 7,408
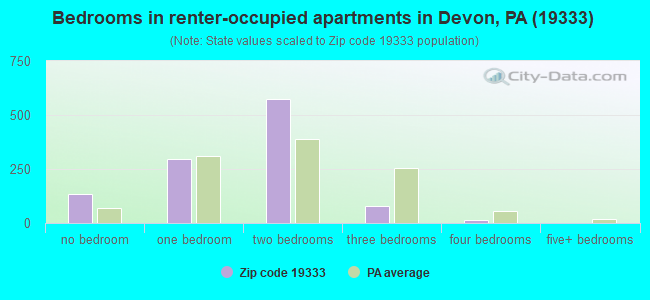
Houses and condos: 3,248 Renter-occupied apartments: 1,079
% of renters here:
35%
State:
31%
March 2022 cost of living index in zip code 19333: 107.9 (more than average, U.S. average is 100)
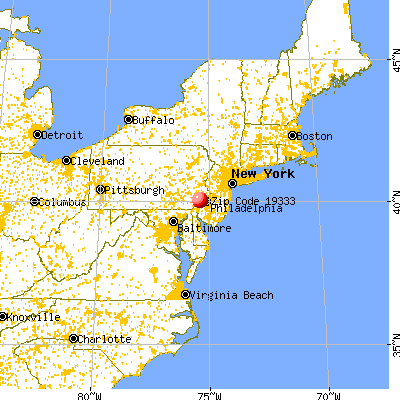
Land area: 3.5 sq. mi. Water area: 0.0 sq. mi.
Population density: 2,281 people per square mile
(low).
OSM Map
General Map
Google Map
MSN Map
OSM Map
General Map
Google Map
MSN Map
OSM Map
General Map
Google Map
MSN Map
OSM Map
General Map
Google Map
MSN Map
Please wait while loading the map...
Real estate property taxes paid for housing units in 2022:
This zip code:
1.1% ($8,005)
Pennsylvania:
1.3% ($3,094)
Median real estate property taxes paid for housing units with mortgages in 2022: $7,879 (1.0%) Median real estate property taxes paid for housing units with no mortgage in 2022: $8,192 (1.1%)
Business Search- 14 Million verified businesses
Males: 3,961
(50.3%)
Females: 3,914
(49.7%)
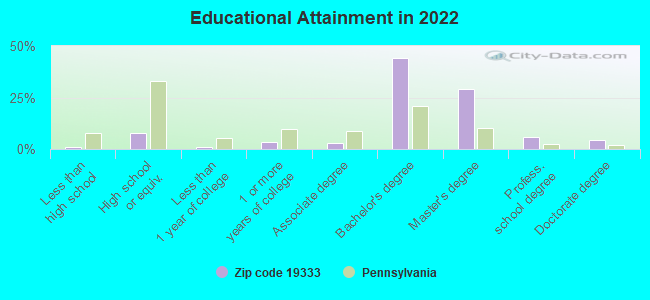
For population 25 years and over in 19333:
High school or higher: 101.8%
Bachelor's degree or higher: 86.3%
Graduate or professional degree: 40.9%
Unemployed: 3.1%
Mean travel time to work (commute): 24.8 minutes
For population 15 years and over in 19333:
Never married: 27.0%
Now married: 60.7%
Separated: 1.2%
Widowed: 5.0%
Divorced: 6.2%
Zip code 19333 compared to state average:
Median household income above state average.
Median house value significantly above state average.
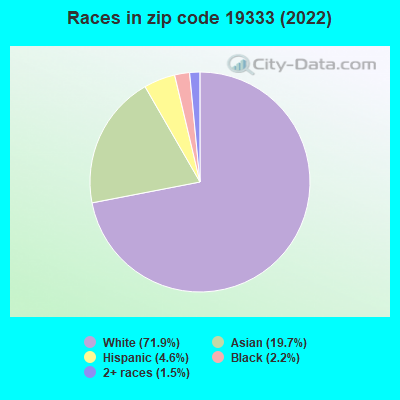
Black race population percentage significantly below state average.
Hispanic race population percentage below state average.
Foreign-born population percentage significantly above state average.
Length of stay since moving in significantly above state average.
Number of college students below state average.
Percentage of population with a bachelor's degree or higher significantly above state average.
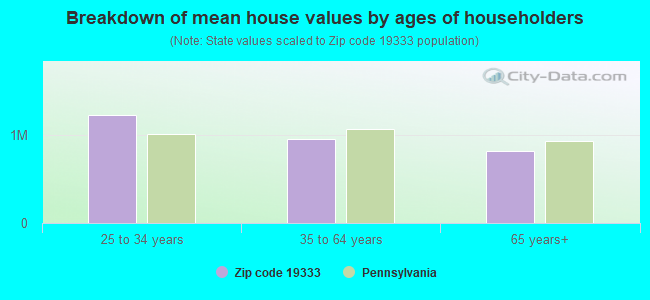
Estimated median house/condo value in 2022: $745,942
19333:
$745,942
Pennsylvania:
$245,500
According to our research of Pennsylvania and other state lists, there was 1 registered sex offender living in 19333 zip code as of April 27, 2024. The ratio of all residents to sex offenders in zip code 19333 is 6,523 to 1. The ratio of registered sex offenders to all residents in this zip code is much lower than the state average.
Median resident age:
This zip code:
42.0 years
Pennsylvania median age:
40.9 years
Average household size:
This zip code:
2.5 people
Pennsylvania:
2.4 people
Averages for the 2020 tax year for zip code 19333, filed in 2021:
Average Adjusted Gross Income (AGI) in 2020: $234,845 (Individual Income Tax Returns)
Here:
$234,845
State:
$75,707
Salary/wage: $185,699 (reported on 76.8% of returns)
Here:
$185,699
State:
$62,806
(% of AGI for various income ranges: 996.7% for AGIs below $25k, 3786.8% for AGIs $25k-50k, 6808.5% for AGIs $50k-75k, 10475.2% for AGIs $75k-100k, 20002.6% for AGIs $100k-200k, 168194.6% for AGIs over 200k)
Taxable interest for individuals: $4,621 (reported on 51.9% of returns)
This zip code:
$4,621
Pennsylvania:
$1,633
(% of AGI for various income ranges: 36.9% for AGIs below $25k, 109.7% for AGIs $25k-50k, 75.6% for AGIs $50k-75k, 119.5% for AGIs $75k-100k, 277.6% for AGIs $100k-200k, 2916.7% for AGIs over 200k)
Ordinary dividends: $21,258 (reported on 53.5% of returns)
Here:
$21,258
State:
$7,382
(% of AGI for various income ranges: 159.2% for AGIs below $25k, 323.5% for AGIs $25k-50k, 473.3% for AGIs $50k-75k, 625.7% for AGIs $75k-100k, 1290.0% for AGIs $100k-200k, 13973.3% for AGIs over 200k)
Net capital gain/loss in AGI: +$63,422 (reported on 49.5% of returns)
Here:
+$63,422
State:
+$23,522
(% of AGI for various income ranges: 83.3% for AGIs below $25k, 163.5% for AGIs $25k-50k, 367.4% for AGIs $50k-75k, 480.5% for AGIs $75k-100k, 1072.6% for AGIs $100k-200k, 45670.0% for AGIs over 200k)
Profit/loss from business: +$46,041 (reported on 18.4% of returns)
Here:
+$46,041
State:
+$16,274
(% of AGI for various income ranges: 161.4% for AGIs below $25k, 303.5% for AGIs $25k-50k, 427.0% for AGIs $50k-75k, 511.9% for AGIs $75k-100k, 1230.6% for AGIs $100k-200k, 9739.2% for AGIs over 200k)
Taxable individual retirement arrangement distribution: $32,564 (reported on 12.7% of returns)
19333:
$32,564
Pennsylvania:
$18,583
(% of AGI for various income ranges: 91.9% for AGIs below $25k, 302.9% for AGIs $25k-50k, 310.0% for AGIs $50k-75k, 580.5% for AGIs $75k-100k, 1236.2% for AGIs $100k-200k, 3240.0% for AGIs over 200k)
Self-employed (Keogh) retirement plans: $30,814 (reported on 3.8% of returns)
19333:
$30,814
Pennsylvania:
$25,407
(% of AGI for various income ranges: 238.6% for AGIs $75k-100k, 1588.8% for AGIs over 200k)
Total itemized deductions: $48,003 (reported on 24.6% of returns)
Here:
$48,003
State:
$34,850
(% of AGI for various income ranges: 476.5% for AGIs $25k-50k, 392.6% for AGIs $50k-75k, 701.9% for AGIs $75k-100k, 1601.8% for AGIs $100k-200k, 14260.8% for AGIs over 200k)
Charity contributions: $17,523 (reported on 21.9% of returns)
Here:
$17,523
State:
$12,392
(% of AGI for various income ranges: 42.9% for AGIs $25k-50k, 33.7% for AGIs $50k-75k, 69.0% for AGIs $75k-100k, 239.7% for AGIs $100k-200k, 5420.8% for AGIs over 200k)
Taxes paid: $9,267 (reported on 24.6% of returns)
19333:
$9,267
State:
$8,200
(% of AGI for various income ranges: 107.1% for AGIs $25k-50k, 99.6% for AGIs $50k-75k, 206.2% for AGIs $75k-100k, 472.4% for AGIs $100k-200k, 2413.8% for AGIs over 200k)
Earned income credit: $1,608 (reported on 3.2% of returns)
Here:
$1,608
State:
$2,100
(% of AGI for various income ranges: 31.4% for AGIs below $25k, 25.8% for AGIs $25k-50k)
Percentage of individuals using paid preparers for their 2020 taxes: 91.1%
Here:
91%
State:
92%
(% for various income ranges: 86.3% for AGIs below $25k, 91.7% for AGIs $25k-50k, 90.7% for AGIs $50k-75k, 91.7% for AGIs $75k-100k, 92.8% for AGIs $100k-200k, 93.1% for AGIs over 200k)
Averages for the 2012 tax year for zip code 19333, filed in 2013:
Average Adjusted Gross Income (AGI) in 2012: $174,162 (Individual Income Tax Returns)
Here:
$174,162
State:
$61,346
Salary/wage: $135,324 (reported on 78.8% of returns)
Here:
$135,324
State:
$51,902
(% of AGI for various income ranges: 60.7% for AGIs below $25k, 74.0% for AGIs $25k-50k, 72.6% for AGIs $50k-75k, 67.8% for AGIs $75k-100k, 72.0% for AGIs $100k-200k, 57.1% for AGIs over 200k)
Taxable interest for individuals: $3,378 (reported on 53.7% of returns)
This zip code:
$3,378
Pennsylvania:
$1,588
(% of AGI for various income ranges: 2.7% for AGIs below $25k, 1.8% for AGIs $25k-50k, 1.4% for AGIs $50k-75k, 1.5% for AGIs $75k-100k, 0.6% for AGIs $100k-200k, 1.0% for AGIs over 200k)
Ordinary dividends: $17,917 (reported on 50.1% of returns)
Here:
$17,917
State:
$5,827
(% of AGI for various income ranges: 9.7% for AGIs below $25k, 3.4% for AGIs $25k-50k, 3.6% for AGIs $50k-75k, 4.6% for AGIs $75k-100k, 4.7% for AGIs $100k-200k, 5.4% for AGIs over 200k)
Net capital gain/loss in AGI: +$37,122 (reported on 41.9% of returns)
Here:
+$37,122
State:
+$14,495
(% of AGI for various income ranges: 1.4% for AGIs below $25k, 1.4% for AGIs $25k-50k, 1.6% for AGIs $50k-75k, 1.7% for AGIs $75k-100k, 2.0% for AGIs $100k-200k, 11.9% for AGIs over 200k)
Profit/loss from business: +$35,958 (reported on 19.0% of returns)
Here:
+$35,958
State:
+$16,268
(% of AGI for various income ranges: 11.0% for AGIs below $25k, 5.9% for AGIs $25k-50k, 3.7% for AGIs $50k-75k, 4.1% for AGIs $75k-100k, 4.4% for AGIs $100k-200k, 3.6% for AGIs over 200k)
Taxable individual retirement arrangement distribution: $34,823 (reported on 17.1% of returns)
19333:
$34,823
Pennsylvania:
$14,550
(% of AGI for various income ranges: 6.7% for AGIs below $25k, 3.8% for AGIs $25k-50k, 4.8% for AGIs $50k-75k, 5.5% for AGIs $75k-100k, 5.5% for AGIs $100k-200k, 2.7% for AGIs over 200k)
Self-employment retirement plans: $29,714 (reported on 3.9% of returns)
19333:
$29,714
Pennsylvania:
$20,922
(% of AGI for various income ranges: 0.6% for AGIs $100k-200k, 0.8% for AGIs over 200k)
Total itemized deductions: $45,293 (15% of AGI, reported on 52.6% of returns)
Here:
$45,293
State:
$23,538
Here:
15.5% of AGI
State:
18.4% of AGI
(% of AGI for various income ranges: 25.3% for AGIs below $25k, 15.6% for AGIs $25k-50k, 13.0% for AGIs $50k-75k, 16.1% for AGIs $75k-100k, 15.8% for AGIs $100k-200k, 12.8% for AGIs over 200k)
Charity contributions: $10,328 (reported on 47.4% of returns)
Here:
$10,328
State:
$4,025
(% of AGI for various income ranges: 1.6% for AGIs below $25k, 1.2% for AGIs $25k-50k, 1.2% for AGIs $50k-75k, 1.5% for AGIs $75k-100k, 1.9% for AGIs $100k-200k, 3.3% for AGIs over 200k)
Taxes paid: $19,311 (reported on 52.3% of returns)
19333:
$19,311
State:
$9,982
(% of AGI for various income ranges: 7.1% for AGIs below $25k, 5.1% for AGIs $25k-50k, 4.4% for AGIs $50k-75k, 5.3% for AGIs $75k-100k, 6.7% for AGIs $100k-200k, 5.7% for AGIs over 200k)
Earned income credit: $1,469 (reported on 4.4% of returns)
Here:
$1,469
State:
$2,106
(% of AGI for various income ranges: 2.1% for AGIs below $25k, 0.3% for AGIs $25k-50k)
Percentage of individuals using paid preparers for their 2012 taxes: 57.3%
Here:
57%
State:
53%
(% for various income ranges: 51.7% for AGIs below $25k, 50.0% for AGIs $25k-50k, 49.0% for AGIs $50k-75k, 59.4% for AGIs $75k-100k, 60.9% for AGIs $100k-200k, 71.4% for AGIs over 200k)
Averages for the 2004 tax year for zip code 19333, filed in 2005:
Average Adjusted Gross Income (AGI) in 2004: $135,114 (Individual Income Tax Returns)
Here:
$135,114
State:
$48,049
Salary/wage: $109,944 (reported on 76.1% of returns)
Here:
$109,944
State:
$42,646
(% of AGI for various income ranges: 266.8% for AGIs below $10k, 63.4% for AGIs $10k-25k, 73.9% for AGIs $25k-50k, 74.1% for AGIs $50k-75k, 67.7% for AGIs $75k-100k, 59.5% for AGIs over 100k)
Taxable interest for individuals: $3,734 (reported on 65.1% of returns)
This zip code:
$3,734
Pennsylvania:
$1,657
(% of AGI for various income ranges: 31.9% for AGIs below $10k, 3.9% for AGIs $10k-25k, 2.7% for AGIs $25k-50k, 2.5% for AGIs $50k-75k, 2.0% for AGIs $75k-100k, 1.6% for AGIs over 100k)
Taxable dividends: $11,989 (reported on 56.4% of returns)
Here:
$11,989
State:
$3,566
(% of AGI for various income ranges: 61.7% for AGIs below $10k, 8.0% for AGIs $10k-25k, 4.5% for AGIs $25k-50k, 4.3% for AGIs $50k-75k, 5.1% for AGIs $75k-100k, 4.9% for AGIs over 100k)
Net capital gain/loss: +$32,159 (reported on 48.1% of returns)
Here:
+$32,159
State:
+$9,716
(% of AGI for various income ranges: -10.9% for AGIs below $10k, 2.4% for AGIs $10k-25k, 1.6% for AGIs $25k-50k, 1.7% for AGIs $50k-75k, 3.0% for AGIs $75k-100k, 13.6% for AGIs over 100k)
Profit/loss from business: +$34,113 (reported on 17.1% of returns)
Here:
+$34,113
State:
+$14,267
(% of AGI for various income ranges: 8.4% for AGIs below $10k, 5.8% for AGIs $10k-25k, 5.9% for AGIs $25k-50k, 2.9% for AGIs $50k-75k, 6.0% for AGIs $75k-100k, 4.2% for AGIs over 100k)
IRA payment deduction: $3,224 (reported on 3.8% of returns)
19333:
$3,224
Pennsylvania:
$2,903
(% of AGI for various income ranges: 0.7% for AGIs $10k-25k, 0.3% for AGIs $25k-50k, 0.2% for AGIs $50k-75k, 0.2% for AGIs $75k-100k, 0.0% for AGIs over 100k)
Self-employed pension: $22,538 (reported on 4.4% of returns)
Here:
$22,538
Pennsylvania:
$14,674
Total itemized deductions: $33,485 (15% of AGI, reported on 52.6% of returns)
Here:
$33,485
State:
$18,804
Here:
14.8% of AGI
State:
19.5% of AGI
(% of AGI for various income ranges: 82.5% for AGIs below $10k, 24.8% for AGIs $10k-25k, 13.7% for AGIs $25k-50k, 14.1% for AGIs $50k-75k, 17.9% for AGIs $75k-100k, 12.2% for AGIs over 100k)
Charity contributions deductions: $8,797 (4% of AGI, reported on 47.6% of returns)
Here:
$8,797
State:
$3,337
Here:
3.6% of AGI
State:
3.3% of AGI
(% of AGI for various income ranges: 2.6% for AGIs below $10k, 1.9% for AGIs $10k-25k, 1.6% for AGIs $25k-50k, 1.9% for AGIs $50k-75k, 2.4% for AGIs $75k-100k, 3.3% for AGIs over 100k)
Total tax: $34,149 (reported on 82.5% of returns)
19333:
$34,149
State:
$8,008
(% of AGI for various income ranges: 7.7% for AGIs below $10k, 4.7% for AGIs $10k-25k, 9.0% for AGIs $25k-50k, 11.8% for AGIs $50k-75k, 12.4% for AGIs $75k-100k, 23.2% for AGIs over 100k)
Earned income credit: $1,104 (reported on 3.2% of returns)
Here:
$1,104
State:
$1,643
Percentage of individuals using paid preparers for their 2004 taxes: 56.2%
Here:
56%
State:
56%
(% for various income ranges: 51.0% for AGIs below $10k, 46.9% for AGIs $10k-25k, 51.3% for AGIs $25k-50k, 50.7% for AGIs $50k-75k, 55.6% for AGIs $75k-100k, 69.1% for AGIs over 100k)
Likely homosexual households (counted as self-reported same-sex unmarried-partner households)
Lesbian couples: 0.0% of all households
Gay men: 0.3% of all households
Household received Food Stamps/SNAP in the past 12 months: 40 Household did not receive Food Stamps/SNAP in the past 12 months: 3,058
Women who had a birth in the past 12 months: 116 (122 now married, 1 unmarried) Women who did not have a birth in the past 12 months: 1,595 (758 now married, 833 unmarried)
Housing units in zip code 19333 with a mortgage: 1,191 (245 second mortgage, 10 home equity loan, 195 both second mortgage and home equity loan) Median monthly owner costs for units with a mortgage: $3,291 Median monthly owner costs for units without a mortgage: $1,228
Residents with income below the poverty level in 2022:
This zip code:
5.0%
Whole state:
11.8%
Residents with income below 50% of the poverty level in 2022:
This zip code:
0.9%
Whole state:
6.1%
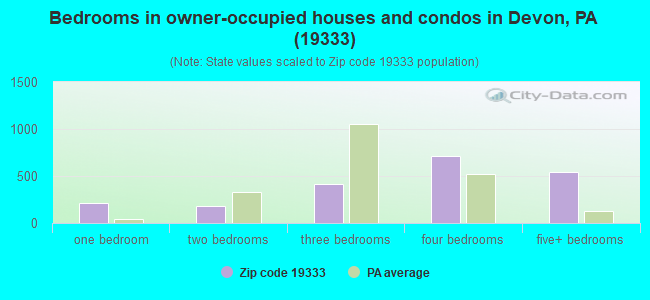
Median number of rooms in houses and condos:
Here:
10.0
State:
6.8
Median number of rooms in apartments:
Here:
3.9
State:
4.3
Notable locations in this zip code not listed on our city pages
Notable locations in zip code 19333: Easttown Township Building (A), Eagle Station (B), Easttown Township Police Department (C), Cathcart Home (D). Display/hide their locations on the map
In group quarters: 110 (-1 institutionalized population)
Size of family households: 741 2-persons, 591 3-persons, 551 4-persons, 139 5-persons, 42 6-persons
Size of nonfamily households: 687 1-person, 363 2-persons
1,730 married couples with children.
134 single-parent households (134 women).
78.1% of residents of 19333 zip code speak English at home.
2.8% of residents speak Spanish at home (90% very well, 8% well, 1% not well, 1% not at all).
6.0% of residents speak other Indo-European language at home (85% very well, 12% well, 3% not well).
13.0% of residents speak Asian or Pacific Island language at home (51% very well, 41% well, 8% not well).
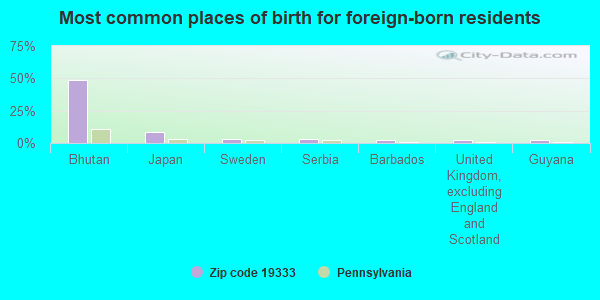
Foreign born population: 1,532 (19.5%) (46.0% of them are naturalized citizens)
This zip code:
19.5%
Whole state:
7.5%
49%Bhutan
8%Japan
3%Sweden
3%Serbia
2%Barbados
2%United Kingdom, excluding England and Scotland
2%Guyana
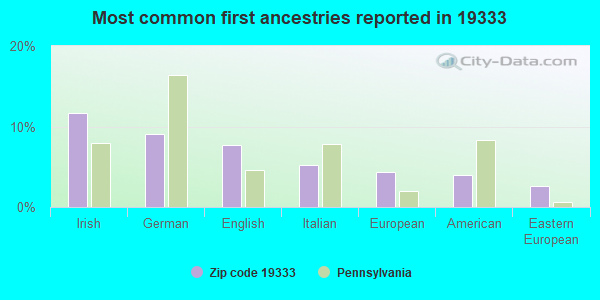
12%Irish
9%German
8%English
5%Italian
4%European
4%American
3%Eastern European
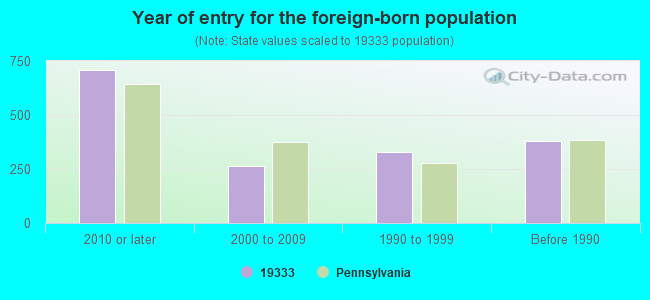
Year of entry for the foreign-born population
7082010 or later
2662000 to 2009
3281990 to 1999
379Before 1990
Facilities with environmental interests located in this zip code:
ANRO (222 LANCASTER AVE in DEVON, PA)
STATE MASTER (Pennsylvania database) - RCRIS-PAD014017537, HAZARDOUS WASTE PROGRAM HAZARDOUS WASTE BIENNIAL REPORTER (Resource Conservation and Recovery Act (tracking hazardous waste)) Large Quantity Generators, more that 1000 kg of hazardous waste/month (Resource Conservation and Recovery Act (tracking hazardous waste)) Business NAICS classification: COMMERCIAL LITHOGRAPHIC PRINTING.; OTHER COMMERCIAL PRINTING. Organizations: ANRO INC (CONTACT/OPERATOR)
, ANGELO AND ROSE ROSSI (CONTACT/OWNER)
BEAUMONT ELEM SCH (575 BEAUMONT ROAD in DEVON, PA)
STATE MASTER (Pennsylvania database) - RCRIS-PAR000029694, HAZARDOUS WASTE PROGRAM Conditionally Exempt Small Quantity Generators, less than 100 kg/month of hazardous waste (Resource Conservation and Recovery Act (tracking hazardous waste)) - notification Organizations: CAPETOLA EMIL (CONTACT/OWNER)
Alternative names: BEAUMONT ELEMENTARY SCH
BEAUMONT EL SCH (575 BEAUMONT RD in DEVON, PA)
(National Center for Education Statistics) - STATE ID-4690 Organizations: TREDYFFRIN-EASTTOWN SD (SCHOOL DISTRICT)
ASTEN-HILL MANUFACTURING CO# (999 W VALLEY RD in DEVON, PA)
Large Quantity Generators, more that 1000 kg of hazardous waste/month (Resource Conservation and Recovery Act (tracking hazardous waste)) - notification Business NAICS classification: ALL OTHER MISCELLANEOUS NONMETALLIC MINERAL PRODUCT MANUFACTURING. Organizations: OPERNAME (CONTACT/OPERATOR)
, ROUSE AND ASSOCIATES (CONTACT/OWNER)
NEWTON, O.A. & SON CO. (P.O. BOX 397 in BRIDGEVILLE, DE)
ENFORCEMENT/COMPLIANCE ACTIVITY (Integrated Compliance Information System) COMPLIANCE ACTIVITY (Tracking inspections of insecticide, fungicide, and rodenticide, and toxic substances) Business SIC classification: SHEET METALWORK
AMOCO NO 12079 TANKS (891 LANCASTER AVE in DEVON, PA)
Small Quantity Generators, between 100 kg and 1000 kg of hazardous waste/month (Resource Conservation and Recovery Act (tracking hazardous waste)) - notification Organizations: AMOCO OIL CO (CONTACT/OWNER)
ACME MARKET (700 LANCASTER AVE in DEVON, PA)
ENFORCEMENT/COMPLIANCE ACTIVITY (Integrated Compliance Information System)
Housing units lacking complete plumbing facilities: 0.5% Housing units lacking complete kitchen facilities: 2.2%
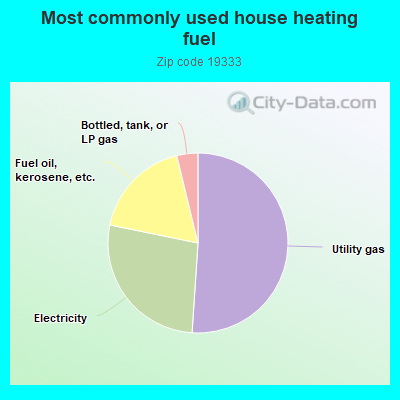
51.1%Utility gas
27.2%Electricity
18.0%Fuel oil, kerosene, etc.
3.8%Bottled, tank, or LP gas
Population in 1990: 6,290. Population change in the 1990s: +1,118 (+17.8%).
Place of birth for U.S.-born residents:
This state: 4,074
Northeast: 1,039
Midwest: 398
South: 584
West: 165
57% of the 19333 zip code residents lived in the same house 5 years ago. Out of people who lived in different houses, 29% lived in this county. Out of people who lived in different counties, 50% lived in Pennsylvania.
86% of the 19333 zip code residents lived in the same house 1 year ago. Out of people who lived in different houses, 38% moved from this county. Out of people who lived in different houses, 26% moved from different county within same state. Out of people who lived in different houses, 24% moved from different state. Out of people who lived in different houses, 11% moved from abroad.
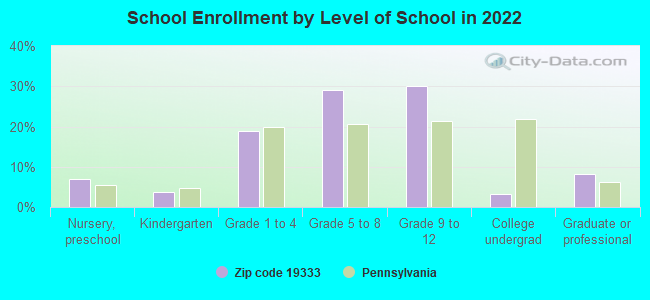
Private vs. public school enrollment:
Students in private schools in grades 1 to 8 (elementary and middle school): 45
Here:
4.8%
Pennsylvania:
15.7%
Students in private schools in grades 9 to 12 (high school): 46
Here:
7.7%
Pennsylvania:
13.4%
Students in private undergraduate colleges: 56
Here:
89.3%
Pennsylvania:
39.8%
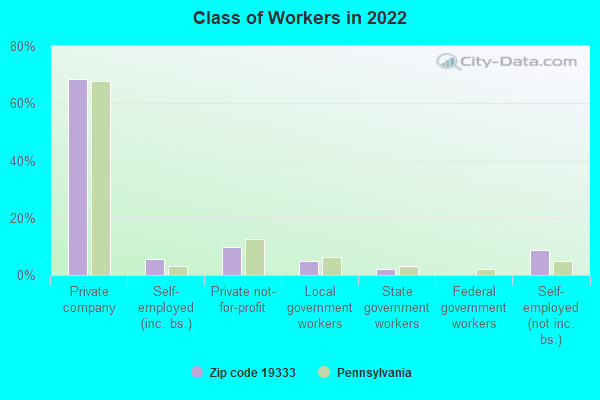
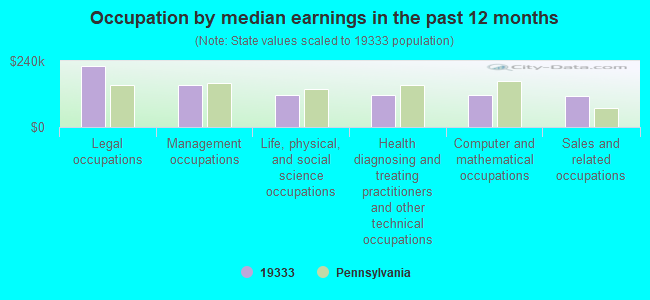
Occupation by median earnings in the past 12 months ($)
222,038Legal occupations
154,095Management occupations
117,075Life, physical, and social science occupations
115,780Health diagnosing and treating practitioners and other technical occupations
115,313Computer and mathematical occupations
112,658Sales and related occupations
Companies with federal contracts located in this zip code:
TRANSPORT INTERNATIONAL POOL I (426 LANCASTER AVE in DEVON, PA) : $1,482,029 in 54 contractsfrom 1999 to 2006
Contracts for Other Housekeeping Services, Construction of Structures and Facilities -- Other Administrative Facilities and Service Buildings, Lease or Rental of Facilities -- Office Buildings, Trailers, and moreby Navy, Army, Air Force, Centers for Disease Control and Prevention, and others Signed by year:2000: $449,940; 2001: $187,917; 2002: $150,949; 2003: $206,971; 2004: $163,276; 2005: $86,996; 2006: $94,685.
Biggest contracts:
$201,648 with Navy for Other Housekeeping Services. Taking place in GA. Signed on 2000-12-20. Completion date: 2001-12-19.
$141,295 with Army for Construction of Structures and Facilities -- Other Administrative Facilities and Service Buildings. Taking place in TX. Signed on 1999-12-30. Completion date: 2000-12-30.
$137,180 with Army for Lease or Rental of Facilities -- Office Buildings. Taking place in MD. Signed on 2000-09-26. Completion date: 2002-09-30.
$117,619 with Navy for Other Housekeeping Services. Taking place in GA. Signed on 2002-12-20. Completion date: 2001-12-19.
Top industries in this zip code by the number of employees in 2005:
Professional, Scientific, and Technical Services: Offices of Certified Public Accountants (250-499 employees: 1 establishment, 20-49 employees: 1 establishment, 10-19 employees: 1 establishment, 1-4 employees: 1 establishment)
Educational Services: Elementary and Secondary Schools (100-249: 1, 50-99: 1)
Real Estate and Rental and Leasing: Truck, Utility Trailer, and RV (Recreational Vehicle) Rental and Leasing (100-249: 1, 5-9: 1)
Health Care and Social Assistance: Nursing Care Facilities (100-249: 1, 1-4: 1)
Management of Companies and Enterprises: Corporate, Subsidiary, and Regional Managing Offices (100-249: 1, 1-4: 1)
Administrative and Support and Waste Management and Remediation Services: All Other Business Support Services (100-249: 1)
Other Services (except Public Administration): Computer and Office Machine Repair and Maintenance (100-249: 1)
People in group quarters in 2010:
27 people in nursing facilities/skilled-nursing facilities
People in group quarters in 2000:
176 people in nursing homes
28 people in mental (psychiatric) hospitals or wards
15 people in religious group quarters
5 people in homes for the mentally retarded
Fatal accident statistics in 2012:
Fatal accident count: 1
Vehicles involved in fatal accidents: 1
Fatal accidents caused by drunken drivers: 0
Fatalities: 1
Persons involved in fatal accidents: 3
Pedestrians involved in fatal accidents: 0
Home Mortgage Disclosure Act Aggregated Statistics For Year 2009 (Based on 10 partial tracts)
A) FHA, FSA/RHS & VA Home Purchase Loans
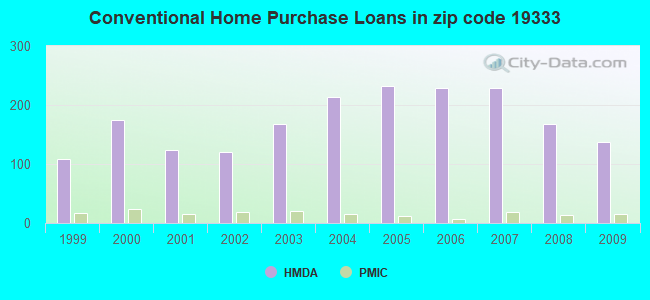
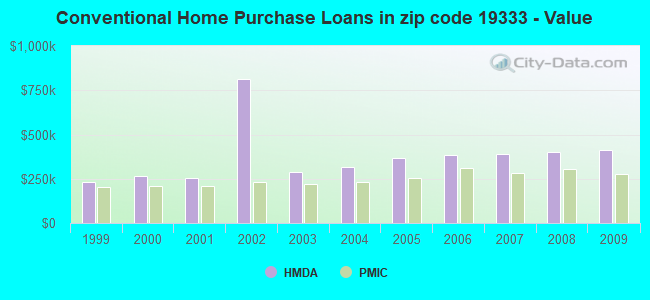
B) Conventional Home Purchase Loans
C) Refinancings
D) Home Improvement Loans
E) Loans on Dwellings For 5+ Families
F) Non-occupant Loans on < 5 Family Dwellings (A B C & D)
Number
Average Value
Number
Average Value
Number
Average Value
Number
Average Value
Number
Average Value
Number
Average Value
LOANS ORIGINATED
15
$276,633
138
$414,588
576
$328,471
23
$187,839
1
$4,350,260
13
$537,929
APPLICATIONS APPROVED, NOT ACCEPTED
0
$0
10
$464,556
44
$320,118
3
$137,593
0
$0
2
$193,635
APPLICATIONS DENIED
1
$269,010
14
$287,291
88
$426,776
8
$66,378
0
$0
4
$368,330
APPLICATIONS WITHDRAWN
0
$0
17
$285,482
86
$384,019
3
$466,970
0
$0
1
$69,240
FILES CLOSED FOR INCOMPLETENESS
0
$0
7
$421,899
26
$463,675
3
$186,673
0
$0
0
$0
Aggregated Statistics For Year 2008 (Based on 10 partial tracts)
A) FHA, FSA/RHS & VA Home Purchase Loans
B) Conventional Home Purchase Loans
C) Refinancings
D) Home Improvement Loans
E) Loans on Dwellings For 5+ Families
F) Non-occupant Loans on < 5 Family Dwellings (A B C & D)
G) Loans On Manufactured Home Dwelling (A B C & D)
Number
Average Value
Number
Average Value
Number
Average Value
Number
Average Value
Number
Average Value
Number
Average Value
Number
Average Value
LOANS ORIGINATED
7
$246,086
167
$401,289
190
$331,395
35
$110,897
1
$219,970
15
$356,194
0
$0
APPLICATIONS APPROVED, NOT ACCEPTED
0
$0
14
$358,266
44
$309,754
6
$90,512
0
$0
2
$552,850
0
$0
APPLICATIONS DENIED
2
$198,175
13
$551,805
60
$389,731
18
$167,882
0
$0
4
$466,660
1
$18,750
APPLICATIONS WITHDRAWN
3
$225,013
15
$439,402
41
$335,480
3
$143,600
0
$0
4
$303,965
0
$0
FILES CLOSED FOR INCOMPLETENESS
1
$211,710
1
$267,560
7
$517,366
3
$88,750
0
$0
0
$0
0
$0
Aggregated Statistics For Year 2007 (Based on 10 partial tracts)
A) FHA, FSA/RHS & VA Home Purchase Loans
B) Conventional Home Purchase Loans
C) Refinancings
D) Home Improvement Loans
F) Non-occupant Loans on < 5 Family Dwellings (A B C & D)
G) Loans On Manufactured Home Dwelling (A B C & D)
Number
Average Value
Number
Average Value
Number
Average Value
Number
Average Value
Number
Average Value
Number
Average Value
LOANS ORIGINATED
0
$0
228
$387,439
182
$300,873
50
$96,590
21
$202,928
1
$129,090
APPLICATIONS APPROVED, NOT ACCEPTED
0
$0
33
$401,514
36
$249,945
12
$116,702
2
$260,525
0
$0
APPLICATIONS DENIED
1
$240,970
19
$403,840
59
$357,538
12
$63,855
5
$235,732
0
$0
APPLICATIONS WITHDRAWN
0
$0
15
$355,070
32
$340,939
5
$206,572
4
$234,060
0
$0
FILES CLOSED FOR INCOMPLETENESS
0
$0
4
$440,155
14
$281,815
0
$0
1
$286,670
0
$0
Aggregated Statistics For Year 2006 (Based on 10 partial tracts)
A) FHA, FSA/RHS & VA Home Purchase Loans
B) Conventional Home Purchase Loans
C) Refinancings
D) Home Improvement Loans
F) Non-occupant Loans on < 5 Family Dwellings (A B C & D)
G) Loans On Manufactured Home Dwelling (A B C & D)
Number
Average Value
Number
Average Value
Number
Average Value
Number
Average Value
Number
Average Value
Number
Average Value
LOANS ORIGINATED
1
$126,210
229
$385,502
214
$297,277
63
$107,112
23
$244,120
0
$0
APPLICATIONS APPROVED, NOT ACCEPTED
0
$0
32
$437,459
43
$253,592
14
$107,875
2
$264,575
0
$0
APPLICATIONS DENIED
0
$0
28
$383,622
77
$335,266
18
$164,076
7
$470,426
1
$35,730
APPLICATIONS WITHDRAWN
0
$0
24
$437,644
52
$279,415
5
$227,386
6
$203,500
0
$0
FILES CLOSED FOR INCOMPLETENESS
0
$0
6
$375,355
14
$381,209
3
$309,617
0
$0
0
$0
Aggregated Statistics For Year 2005 (Based on 10 partial tracts)
B) Conventional Home Purchase Loans
C) Refinancings
D) Home Improvement Loans
F) Non-occupant Loans on < 5 Family Dwellings (A B C & D)
G) Loans On Manufactured Home Dwelling (A B C & D)
Number
Average Value
Number
Average Value
Number
Average Value
Number
Average Value
Number
Average Value
LOANS ORIGINATED
232
$367,454
276
$284,140
51
$88,007
28
$297,174
2
$34,740
APPLICATIONS APPROVED, NOT ACCEPTED
32
$374,825
38
$227,598
15
$109,172
8
$115,000
2
$42,315
APPLICATIONS DENIED
14
$483,060
80
$241,876
16
$88,777
6
$261,832
0
$0
APPLICATIONS WITHDRAWN
12
$381,986
67
$270,961
10
$137,527
1
$134,160
0
$0
FILES CLOSED FOR INCOMPLETENESS
2
$177,810
23
$294,114
4
$94,495
1
$121,630
0
$0
Aggregated Statistics For Year 2004 (Based on 10 partial tracts)
A) FHA, FSA/RHS & VA Home Purchase Loans
B) Conventional Home Purchase Loans
C) Refinancings
D) Home Improvement Loans
E) Loans on Dwellings For 5+ Families
F) Non-occupant Loans on < 5 Family Dwellings (A B C & D)
Number
Average Value
Number
Average Value
Number
Average Value
Number
Average Value
Number
Average Value
Number
Average Value
LOANS ORIGINATED
1
$274,380
214
$313,953
324
$254,782
37
$93,258
1
$471,130
28
$153,634
APPLICATIONS APPROVED, NOT ACCEPTED
0
$0
23
$298,299
56
$252,716
12
$107,773
1
$36,370
5
$185,296
APPLICATIONS DENIED
0
$0
15
$719,367
62
$257,418
18
$63,400
1
$162,270
3
$186,357
APPLICATIONS WITHDRAWN
0
$0
28
$432,494
85
$253,981
5
$79,086
0
$0
2
$357,645
FILES CLOSED FOR INCOMPLETENESS
0
$0
5
$402,902
19
$276,256
3
$82,913
0
$0
1
$88,710
Aggregated Statistics For Year 2003 (Based on 10 partial tracts)
A) FHA, FSA/RHS & VA Home Purchase Loans
B) Conventional Home Purchase Loans
C) Refinancings
D) Home Improvement Loans
E) Loans on Dwellings For 5+ Families
F) Non-occupant Loans on < 5 Family Dwellings (A B C & D)
Number
Average Value
Number
Average Value
Number
Average Value
Number
Average Value
Number
Average Value
Number
Average Value
LOANS ORIGINATED
3
$128,667
168
$286,614
1,149
$241,743
50
$124,680
0
$0
37
$141,897
APPLICATIONS APPROVED, NOT ACCEPTED
0
$0
13
$275,308
151
$236,361
10
$113,153
0
$0
5
$182,478
APPLICATIONS DENIED
0
$0
14
$273,793
116
$245,816
14
$80,769
0
$0
2
$356,235
APPLICATIONS WITHDRAWN
0
$0
20
$350,184
101
$248,771
10
$89,390
1
$18,030
2
$130,455
FILES CLOSED FOR INCOMPLETENESS
0
$0
6
$300,477
35
$262,687
4
$63,768
0
$0
1
$116,180
Aggregated Statistics For Year 2002 (Based on 6 partial tracts)
A) FHA, FSA/RHS & VA Home Purchase Loans
B) Conventional Home Purchase Loans
C) Refinancings
D) Home Improvement Loans
E) Loans on Dwellings For 5+ Families
F) Non-occupant Loans on < 5 Family Dwellings (A B C & D)
Number
Average Value
Number
Average Value
Number
Average Value
Number
Average Value
Number
Average Value
Number
Average Value
LOANS ORIGINATED
3
$70,120
121
$812,632
531
$927,497
29
$94,079
1
$516,360
9
$182,364
APPLICATIONS APPROVED, NOT ACCEPTED
0
$0
8
$331,938
49
$254,109
12
$72,021
0
$0
0
$0
APPLICATIONS DENIED
0
$0
5
$156,748
61
$247,334
6
$83,788
0
$0
1
$97,160
APPLICATIONS WITHDRAWN
0
$0
10
$239,136
48
$1,697,019
2
$59,050
0
$0
0
$0
FILES CLOSED FOR INCOMPLETENESS
0
$0
2
$302,215
21
$226,276
0
$0
0
$0
0
$0
Aggregated Statistics For Year 2001 (Based on 6 partial tracts)
A) FHA, FSA/RHS & VA Home Purchase Loans
B) Conventional Home Purchase Loans
C) Refinancings
D) Home Improvement Loans
E) Loans on Dwellings For 5+ Families
F) Non-occupant Loans on < 5 Family Dwellings (A B C & D)
Number
Average Value
Number
Average Value
Number
Average Value
Number
Average Value
Number
Average Value
Number
Average Value
LOANS ORIGINATED
1
$74,010
123
$256,321
326
$239,465
32
$55,748
1
$430,300
10
$192,610
APPLICATIONS APPROVED, NOT ACCEPTED
0
$0
12
$330,046
44
$253,859
11
$59,492
0
$0
0
$0
APPLICATIONS DENIED
0
$0
6
$240,382
48
$212,719
9
$66,853
0
$0
1
$229,120
APPLICATIONS WITHDRAWN
0
$0
10
$231,282
45
$195,246
4
$26,705
0
$0
1
$69,280
FILES CLOSED FOR INCOMPLETENESS
0
$0
1
$324,990
11
$296,582
1
$67,060
0
$0
0
$0
Aggregated Statistics For Year 2000 (Based on 6 partial tracts)
A) FHA, FSA/RHS & VA Home Purchase Loans
B) Conventional Home Purchase Loans
C) Refinancings
D) Home Improvement Loans
F) Non-occupant Loans on < 5 Family Dwellings (A B C & D)
Number
Average Value
Number
Average Value
Number
Average Value
Number
Average Value
Number
Average Value
LOANS ORIGINATED
1
$215,000
174
$266,454
59
$166,495
42
$38,822
4
$127,255
APPLICATIONS APPROVED, NOT ACCEPTED
0
$0
20
$216,946
17
$101,974
14
$47,299
2
$87,780
APPLICATIONS DENIED
0
$0
14
$207,935
26
$207,440
10
$55,190
0
$0
APPLICATIONS WITHDRAWN
0
$0
12
$228,348
23
$149,593
6
$54,668
1
$142,380
FILES CLOSED FOR INCOMPLETENESS
0
$0
6
$243,708
6
$138,847
1
$53,400
0
$0
Aggregated Statistics For Year 1999 (Based on 5 partial tracts)
A) FHA, FSA/RHS & VA Home Purchase Loans
B) Conventional Home Purchase Loans
C) Refinancings
D) Home Improvement Loans
F) Non-occupant Loans on < 5 Family Dwellings (A B C & D)
2003 - 2018 National Fire Incident Reporting System (NFIRS) incidents
According to the data from the years 2003 - 2018 the average number of fire incidents per year is 17. The highest number of reported fire incidents - 32 took place in 2007, and the least - 1 in 2015. The data has a decreasing trend.
When looking into fire subcategories, the most reports belonged to: Structure Fires (74.6%), and Outside Fires (19.5%).
Fire incident types reported to NFIRS in Zip Code 19333


 Nearest zip codes: 19087, 19312, 19301, 19073, 19406, 19085.


 According to the data from the years 2003 - 2018 the average number of fire incidents per year is 17. The highest number of reported fire incidents - 32 took place in 2007, and the least - 1 in 2015. The data has a decreasing trend.
 When looking into fire subcategories, the most reports belonged to: Structure Fires (74.6%), and Outside Fires (19.5%).