Estimated zip code population in 2022: 2,018 Zip code population in 2010: 1,360 Zip code population in 2000: 1,298
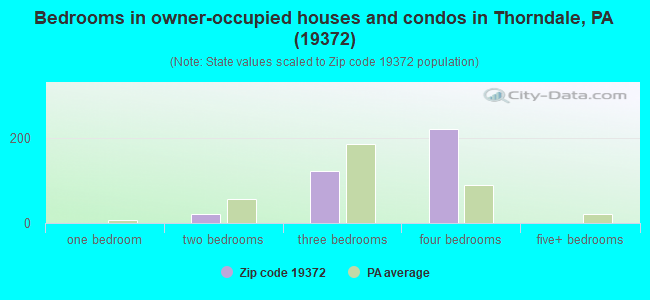
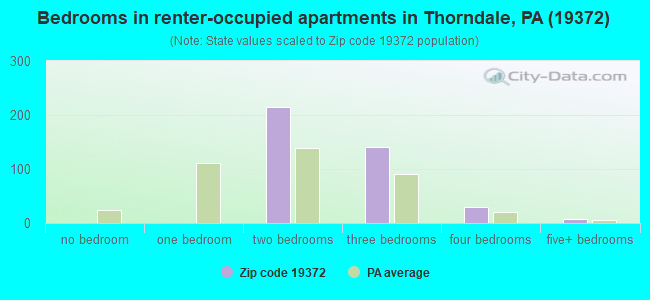
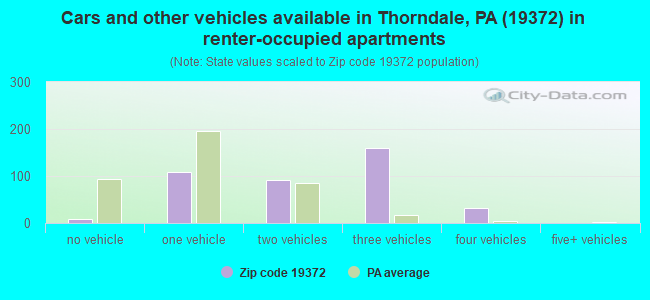
Houses and condos: 773 Renter-occupied apartments: 400
% of renters here:
53%
State:
31%
March 2022 cost of living index in zip code 19372: 106.0 (more than average, U.S. average is 100)
Land area: 0.6 sq. mi. Water area: 0.0 sq. mi.
Population density: 3,454 people per square mile
(average).
OSM Map
General Map
Google Map
MSN Map
OSM Map
General Map
Google Map
MSN Map
OSM Map
General Map
Google Map
MSN Map
OSM Map
General Map
Google Map
MSN Map
Please wait while loading the map...
Real estate property taxes paid for housing units in 2022:
This zip code:
1.6% ($4,588)
Pennsylvania:
1.3% ($3,094)
Median real estate property taxes paid for housing units with mortgages in 2022: $4,461 (1.5%) Median real estate property taxes paid for housing units with no mortgage in 2022: $5,038 (1.7%)
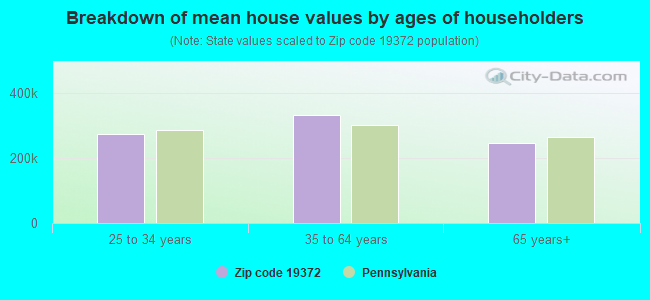
Estimated median house/condo value in 2022: $294,665
19372:
$294,665
Pennsylvania:
$245,500
According to our research of Pennsylvania and other state lists, there were 4 registered sex offenders living in 19372 zip code as of April 28, 2024. The ratio of all residents to sex offenders in zip code 19372 is 433 to 1.
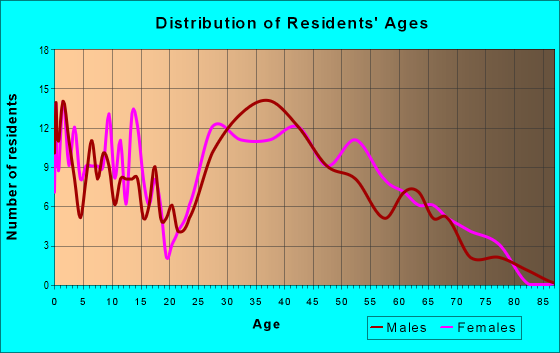
Median resident age:
This zip code:
50.6 years
Pennsylvania median age:
40.9 years
Average household size:
This zip code:
2.7 people
Pennsylvania:
2.4 people
Averages for the 2020 tax year for zip code 19372, filed in 2021:
Average Adjusted Gross Income (AGI) in 2020: $66,847 (Individual Income Tax Returns)
Here:
$66,847
State:
$75,707
Salary/wage: $63,007 (reported on 86.5% of returns)
Here:
$63,007
State:
$62,806
(% of AGI for various income ranges: 1266.4% for AGIs below $25k, 3550.4% for AGIs $25k-50k, 6323.8% for AGIs $50k-75k, 9735.8% for AGIs $75k-100k, 16685.5% for AGIs $100k-200k)
Taxable interest for individuals: $590 (reported on 27.7% of returns)
This zip code:
$590
Pennsylvania:
$1,633
(% of AGI for various income ranges: 18.8% for AGIs below $25k, 18.5% for AGIs $25k-50k, 23.1% for AGIs $50k-75k, 30.8% for AGIs $75k-100k, 19.0% for AGIs $100k-200k)
Ordinary dividends: $2,591 (reported on 16.3% of returns)
Here:
$2,591
State:
$7,382
(% of AGI for various income ranges: 39.2% for AGIs below $25k, 25.8% for AGIs $25k-50k, 24.4% for AGIs $50k-75k, 96.7% for AGIs $75k-100k, 138.0% for AGIs $100k-200k)
Net capital gain/loss in AGI: +$4,926 (reported on 16.3% of returns)
Here:
+$4,926
State:
+$23,522
(% of AGI for various income ranges: 10.4% for AGIs below $25k, 17.3% for AGIs $25k-50k, 41.2% for AGIs $50k-75k, 235.0% for AGIs $75k-100k, 357.0% for AGIs $100k-200k)
Profit/loss from business: +$10,272 (reported on 12.8% of returns)
Here:
+$10,272
State:
+$16,274
(% of AGI for various income ranges: 112.8% for AGIs below $25k, 168.1% for AGIs $25k-50k, 135.0% for AGIs $50k-75k, 288.3% for AGIs $75k-100k, 284.0% for AGIs $100k-200k)
Taxable individual retirement arrangement distribution: $12,350 (reported on 8.5% of returns)
19372:
$12,350
Pennsylvania:
$18,583
(% of AGI for various income ranges: 116.4% for AGIs below $25k, 401.2% for AGIs $50k-75k, 274.5% for AGIs $100k-200k)
Total itemized deductions: $21,167 (reported on 10.6% of returns)
Here:
$21,167
State:
$34,850
(% of AGI for various income ranges: 160.0% for AGIs below $25k, 298.8% for AGIs $50k-75k, 745.8% for AGIs $75k-100k, 701.0% for AGIs $100k-200k)
Charity contributions: $4,333 (reported on 8.5% of returns)
Here:
$4,333
State:
$12,392
(% of AGI for various income ranges: 75.0% for AGIs $50k-75k, 122.5% for AGIs $75k-100k, 126.5% for AGIs $100k-200k)
Taxes paid: $7,667 (reported on 10.6% of returns)
19372:
$7,667
State:
$8,200
(% of AGI for various income ranges: 58.4% for AGIs below $25k, 105.0% for AGIs $50k-75k, 239.2% for AGIs $75k-100k, 274.5% for AGIs $100k-200k)
Earned income credit: $1,693 (reported on 10.6% of returns)
Here:
$1,693
State:
$2,100
(% of AGI for various income ranges: 61.2% for AGIs below $25k, 38.8% for AGIs $25k-50k)
Percentage of individuals using paid preparers for their 2020 taxes: 93.6%
Here:
94%
State:
92%
(% for various income ranges: 92.1% for AGIs below $25k, 93.8% for AGIs $25k-50k, 95.2% for AGIs $50k-75k, 94.1% for AGIs $75k-100k, 93.1% for AGIs $100k-200k, 100.0% for AGIs over 200k)
Averages for the 2012 tax year for zip code 19372, filed in 2013:
Average Adjusted Gross Income (AGI) in 2012: $57,424 (Individual Income Tax Returns)
Here:
$57,424
State:
$61,346
Salary/wage: $56,584 (reported on 86.3% of returns)
Here:
$56,584
State:
$51,902
(% of AGI for various income ranges: 70.4% for AGIs below $25k, 84.2% for AGIs $25k-50k, 83.2% for AGIs $50k-75k, 86.1% for AGIs $75k-100k, 104.4% for AGIs $100k-200k)
Taxable interest for individuals: $349 (reported on 33.8% of returns)
This zip code:
$349
Pennsylvania:
$1,588
(% of AGI for various income ranges: 1.0% for AGIs below $25k, 0.2% for AGIs $25k-50k, 0.3% for AGIs $50k-75k, 0.1% for AGIs $75k-100k, 0.1% for AGIs $100k-200k)
Ordinary dividends: $1,884 (reported on 18.0% of returns)
Here:
$1,884
State:
$5,827
(% of AGI for various income ranges: 1.5% for AGIs below $25k, 0.5% for AGIs $25k-50k, 0.8% for AGIs $50k-75k, 0.3% for AGIs $75k-100k, 0.7% for AGIs $100k-200k)
Net capital gain/loss in AGI: +$328 (reported on 12.9% of returns)
Here:
+$328
State:
+$14,495
(% of AGI for various income ranges: 0.3% for AGIs $100k-200k)
Profit/loss from business: +$9,771 (reported on 12.2% of returns)
Here:
+$9,771
State:
+$16,268
(% of AGI for various income ranges: 7.0% for AGIs below $25k, 4.0% for AGIs $25k-50k, 1.5% for AGIs $50k-75k, 2.6% for AGIs $75k-100k, 0.8% for AGIs $100k-200k)
Taxable individual retirement arrangement distribution: $10,100 (reported on 8.6% of returns)
19372:
$10,100
Pennsylvania:
$14,550
(% of AGI for various income ranges: 2.8% for AGIs below $25k, 1.6% for AGIs $25k-50k, 2.5% for AGIs $50k-75k, 1.9% for AGIs $100k-200k)
Total itemized deductions: $20,976 (22% of AGI, reported on 39.6% of returns)
Here:
$20,976
State:
$23,538
Here:
22.5% of AGI
State:
18.4% of AGI
(% of AGI for various income ranges: 12.3% for AGIs below $25k, 10.6% for AGIs $25k-50k, 13.3% for AGIs $50k-75k, 16.1% for AGIs $75k-100k, 16.3% for AGIs $100k-200k, 13.2% for AGIs over 200k)
Charity contributions: $2,546 (reported on 34.5% of returns)
Here:
$2,546
State:
$4,025
(% of AGI for various income ranges: 0.9% for AGIs below $25k, 1.4% for AGIs $25k-50k, 1.2% for AGIs $50k-75k, 1.6% for AGIs $75k-100k, 1.5% for AGIs $100k-200k, 3.0% for AGIs over 200k)
Taxes paid: $8,384 (reported on 39.6% of returns)
19372:
$8,384
State:
$9,982
(% of AGI for various income ranges: 4.1% for AGIs below $25k, 3.0% for AGIs $25k-50k, 4.9% for AGIs $50k-75k, 6.7% for AGIs $75k-100k, 7.0% for AGIs $100k-200k, 6.7% for AGIs over 200k)
Earned income credit: $1,769 (reported on 11.5% of returns)
Here:
$1,769
State:
$2,106
(% of AGI for various income ranges: 4.3% for AGIs below $25k, 0.7% for AGIs $25k-50k)
Percentage of individuals using paid preparers for their 2012 taxes: 47.5%
Here:
47%
State:
53%
(% for various income ranges: 40.5% for AGIs below $25k, 45.5% for AGIs $25k-50k, 59.1% for AGIs $50k-75k, 55.6% for AGIs $75k-100k, 50.0% for AGIs $100k-200k)
Averages for the 2004 tax year for zip code 19372, filed in 2005:
Average Adjusted Gross Income (AGI) in 2004: $54,279 (Individual Income Tax Returns)
Here:
$54,279
State:
$48,049
Salary/wage: $52,677 (reported on 90.5% of returns)
Here:
$52,677
State:
$42,646
(% of AGI for various income ranges: 99.9% for AGIs below $10k, 78.5% for AGIs $10k-25k, 88.2% for AGIs $25k-50k, 87.4% for AGIs $50k-75k, 89.1% for AGIs $75k-100k, 88.1% for AGIs over 100k)
Taxable interest for individuals: $781 (reported on 52.9% of returns)
This zip code:
$781
Pennsylvania:
$1,657
(% of AGI for various income ranges: 5.7% for AGIs below $10k, 2.0% for AGIs $10k-25k, 0.8% for AGIs $25k-50k, 0.9% for AGIs $50k-75k, 0.4% for AGIs $75k-100k, 0.5% for AGIs over 100k)
Taxable dividends: $1,577 (reported on 26.1% of returns)
Here:
$1,577
State:
$3,566
(% of AGI for various income ranges: 1.9% for AGIs below $10k, 1.0% for AGIs $10k-25k, 0.7% for AGIs $25k-50k, 0.6% for AGIs $50k-75k, 0.6% for AGIs $75k-100k, 0.9% for AGIs over 100k)
Net capital gain/loss: +$3,395 (reported on 16.6% of returns)
Here:
+$3,395
State:
+$9,716
(% of AGI for various income ranges: -0.2% for AGIs $10k-25k, -0.3% for AGIs $25k-50k, 0.0% for AGIs $50k-75k, 1.1% for AGIs $75k-100k, 2.5% for AGIs over 100k)
Profit/loss from business: +$10,793 (reported on 12.8% of returns)
Here:
+$10,793
State:
+$14,267
(% of AGI for various income ranges: 7.1% for AGIs below $10k, 3.8% for AGIs $10k-25k, 1.4% for AGIs $25k-50k, 3.4% for AGIs $50k-75k, 0.9% for AGIs $75k-100k, 3.2% for AGIs over 100k)
IRA payment deduction: $2,762 (reported on 3.2% of returns)
19372:
$2,762
Pennsylvania:
$2,903
Total itemized deductions: $19,234 (24% of AGI, reported on 44.9% of returns)
Here:
$19,234
State:
$18,804
Here:
23.5% of AGI
State:
19.5% of AGI
(% of AGI for various income ranges: 11.2% for AGIs $10k-25k, 17.7% for AGIs $25k-50k, 17.6% for AGIs $50k-75k, 16.5% for AGIs $75k-100k, 15.0% for AGIs over 100k)
Charity contributions deductions: $2,559 (3% of AGI, reported on 40.2% of returns)
Here:
$2,559
State:
$3,337
Here:
3.1% of AGI
State:
3.3% of AGI
(% of AGI for various income ranges: 1.3% for AGIs $10k-25k, 1.9% for AGIs $25k-50k, 1.9% for AGIs $50k-75k, 2.1% for AGIs $75k-100k, 1.9% for AGIs over 100k)
Total tax: $7,465 (reported on 82.4% of returns)
19372:
$7,465
State:
$8,008
(% of AGI for various income ranges: 2.1% for AGIs below $10k, 4.6% for AGIs $10k-25k, 7.3% for AGIs $25k-50k, 9.4% for AGIs $50k-75k, 11.0% for AGIs $75k-100k, 15.8% for AGIs over 100k)
Earned income credit: $1,630 (reported on 7.6% of returns)
Here:
$1,630
State:
$1,643
Percentage of individuals using paid preparers for their 2004 taxes: 50.7%
Here:
51%
State:
56%
(% for various income ranges: 36.9% for AGIs below $10k, 51.1% for AGIs $10k-25k, 53.1% for AGIs $25k-50k, 53.3% for AGIs $50k-75k, 55.4% for AGIs $75k-100k, 53.1% for AGIs over 100k)
Household received Food Stamps/SNAP in the past 12 months: 16 Household did not receive Food Stamps/SNAP in the past 12 months: 737
Women who did not have a birth in the past 12 months: 351 (199 now married, 149 unmarried)
Housing units in zip code 19372 with a mortgage: 261 (16 second mortgage, 16 both second mortgage and home equity loan) Median monthly owner costs for units with a mortgage: $1,804 Median monthly owner costs for units without a mortgage: $674
Residents with income below the poverty level in 2022:
This zip code:
0.4%
Whole state:
11.8%
Median number of rooms in houses and condos:
Here:
7.9
State:
6.8
Median number of rooms in apartments:
Here:
4.1
State:
4.3
Notable locations in this zip code not listed on our city pages
Size of family households: 365 2-persons, 67 3-persons, 101 4-persons, 64 5-persons, 7 6-persons, 7 7-or-more-persons
Size of nonfamily households: 100 1-person, 45 2-persons
296 married couples with children.
17 single-parent households (17 women).
89.3% of residents of 19372 zip code speak English at home.
5.5% of residents speak Spanish at home (19% very well, 81% well).
3.2% of residents speak other Indo-European language at home (90% very well, 10% not well).
2.1% of residents speak Asian or Pacific Island language at home (42% well, 57% not well).
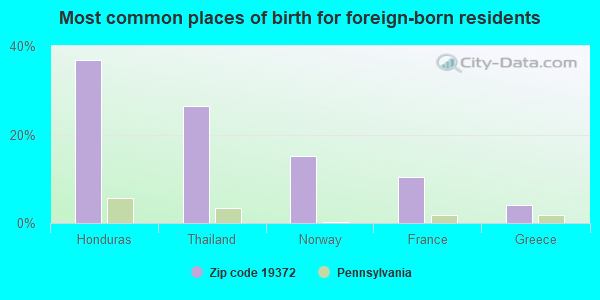
Foreign born population: 127 (6.3%) (84.0% of them are naturalized citizens)
This zip code:
6.3%
Whole state:
7.5%
37%Honduras
26%Thailand
15%Norway
10%France
4%Greece
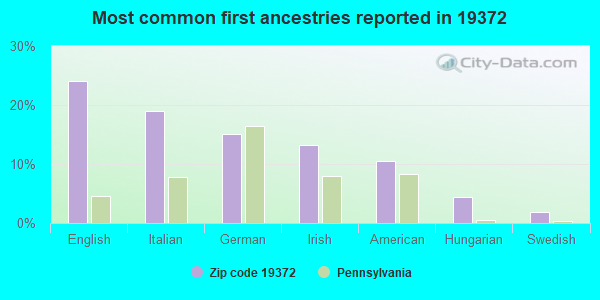
24%English
19%Italian
15%German
13%Irish
11%American
4%Hungarian
2%Swedish
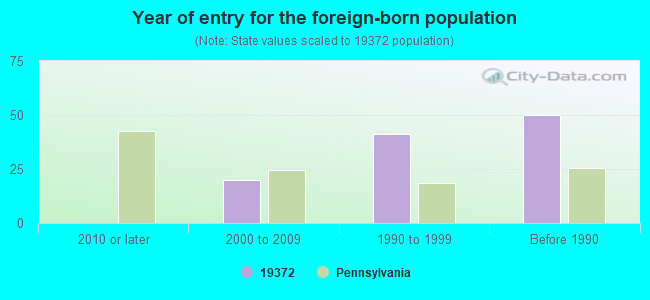
Year of entry for the foreign-born population
02010 or later
202000 to 2009
411990 to 1999
50Before 1990
Facilities with environmental interests located in this zip code:
AMOCO TANKS NO 60934 (3982 E LINCOLN HWY in THORNDALE HEIGHTS, PA)
Small Quantity Generators, between 100 kg and 1000 kg of hazardous waste/month (Resource Conservation and Recovery Act (tracking hazardous waste)) - notification Organizations: AMOCO OIL COMPANY (CONTACT/OWNER)
Housing units lacking complete plumbing facilities: 0.9% Housing units lacking complete kitchen facilities: 0.9%
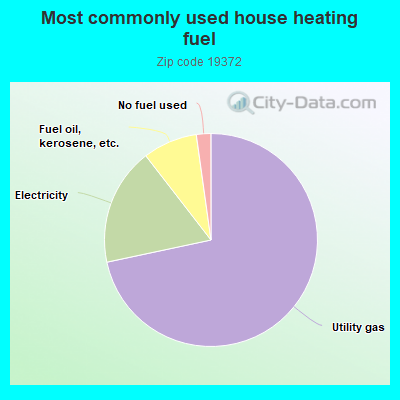
71.8%Utility gas
17.9%Electricity
8.3%Fuel oil, kerosene, etc.
2.2%No fuel used
Population in 1990: 1,712.
Place of birth for U.S.-born residents:
This state: 1,510
Northeast: 185
Midwest: 57
South: 126
West: 9
59% of the 19372 zip code residents lived in the same house 5 years ago. Out of people who lived in different houses, 63% lived in this county. Out of people who lived in different counties, 50% lived in Pennsylvania.
78% of the 19372 zip code residents lived in the same house 1 year ago. Out of people who lived in different houses, 47% moved from this county. Out of people who lived in different houses, 48% moved from different county within same state.
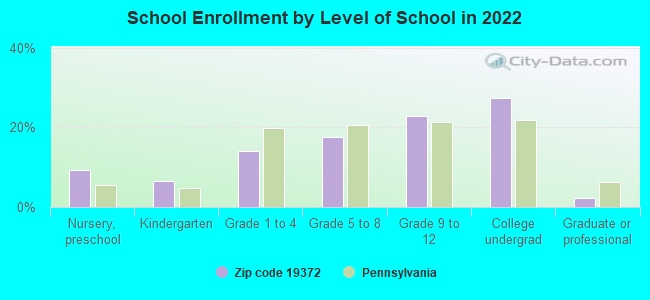
Private vs. public school enrollment:
Students in private schools in grades 1 to 8 (elementary and middle school): 25
Here:
19.6%
Pennsylvania:
15.7%
Students in private schools in grades 9 to 12 (high school):
Here:
0.0%
Pennsylvania:
13.4%
Students in private undergraduate colleges:
Here:
0.0%
Pennsylvania:
39.8%
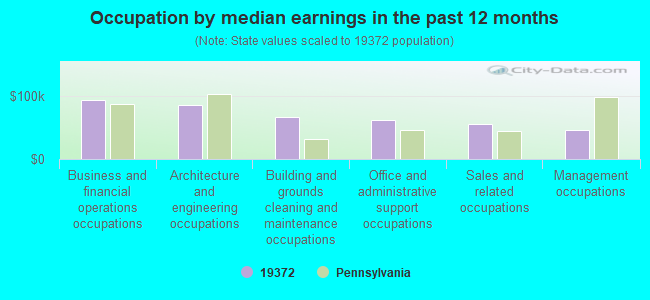
Occupation by median earnings in the past 12 months ($)
94,093Business and financial operations occupations
87,041Architecture and engineering occupations
67,756Building and grounds cleaning and maintenance occupations
62,444Office and administrative support occupations
55,792Sales and related occupations
46,472Management occupations
Companies with federal contracts located in this zip code:
GARRETT MOLHOLT (4 COURTNEY LANE in THORNDALE, PA; small business)
$20,002 with Army for Other Special Studies and Analyses. Signed on 2003-09-24. Completion date: 2003-12-31.
WEST INDUSTRIES (3535 E LINCOLN HYW in THORNDALE, PA; small business)
$2,520 with Army for Gardening Implements and Tools. Taking place in CA. Signed on 2004-06-03. Completion date: 2004-06-17.
Top industries in this zip code by the number of employees in 2005:
Health Care and Social Assistance: Vocational Rehabilitation Services (50-99: 1)
Other Services (except Public Administration): Beauty Salons (20-49: 1, 5-9: 1, 1-4: 1)
Fatal accident statistics in 2014:
Fatal accident count: 1
Vehicles involved in fatal accidents: 1
Fatal accidents caused by drunken drivers: 1
Fatalities: 1
Persons involved in fatal accidents: 1
Pedestrians involved in fatal accidents: 1
2003 - 2018 National Fire Incident Reporting System (NFIRS) incidents
Based on the data from the years 2003 - 2018 the average number of fires per year is 19. The highest number of fire incidents - 46 took place in 2007, and the least - 1 in 2006. The data has a declining trend.
When looking into fire subcategories, the most incidents belonged to: Structure Fires (44.2%), and Outside Fires (33.6%).
Fire incident types reported to NFIRS in Zip Code 19372


 Nearest zip codes: 19335, 19358, 19320, 19316, 19375, 19343.


 Based on the data from the years 2003 - 2018 the average number of fires per year is 19. The highest number of fire incidents - 46 took place in 2007, and the least - 1 in 2006. The data has a declining trend.
 When looking into fire subcategories, the most incidents belonged to: Structure Fires (44.2%), and Outside Fires (33.6%).