Estimated zip code population in 2022: 16,248 Zip code population in 2010: 16,954 Zip code population in 2000: 17,396
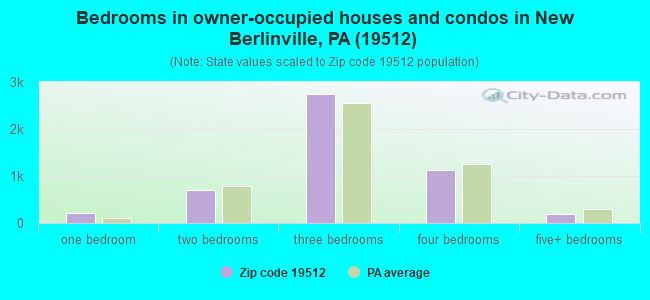
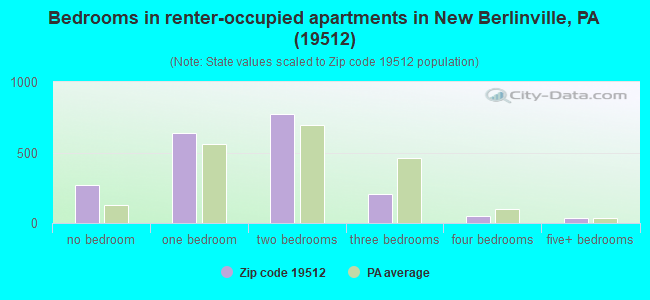
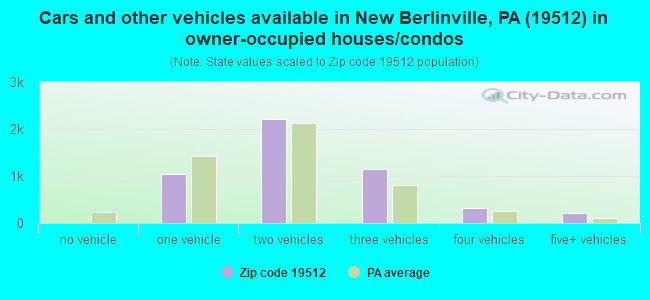
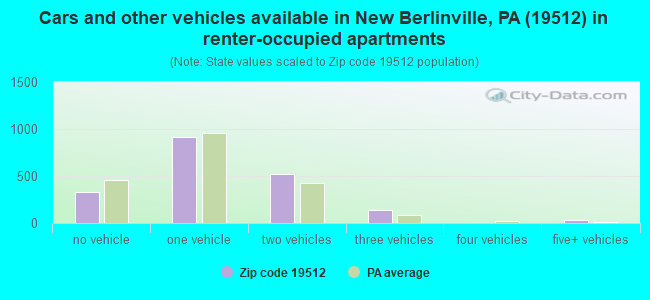
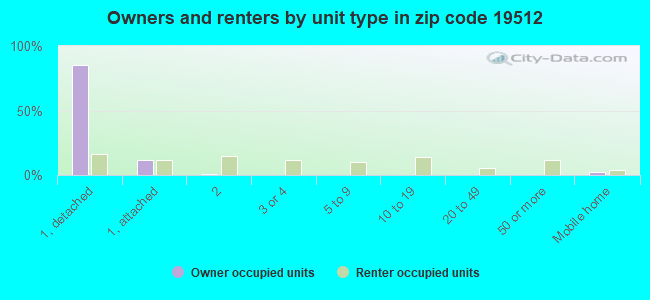
Houses and condos: 7,189 Renter-occupied apartments: 1,941
% of renters here:
28%
State:
31%
March 2022 cost of living index in zip code 19512: 95.9 (near average, U.S. average is 100)
Land area: 43.3 sq. mi. Water area: 0.2 sq. mi.
Population density: 375 people per square mile
(very low).
OSM Map
General Map
Google Map
MSN Map
OSM Map
General Map
Google Map
MSN Map
OSM Map
General Map
Google Map
MSN Map
OSM Map
General Map
Google Map
MSN Map
Please wait while loading the map...
Real estate property taxes paid for housing units in 2022:
This zip code:
1.5% ($3,747)
Pennsylvania:
1.3% ($3,094)
Median real estate property taxes paid for housing units with mortgages in 2022: $3,823 (1.5%) Median real estate property taxes paid for housing units with no mortgage in 2022: $3,593 (1.5%)
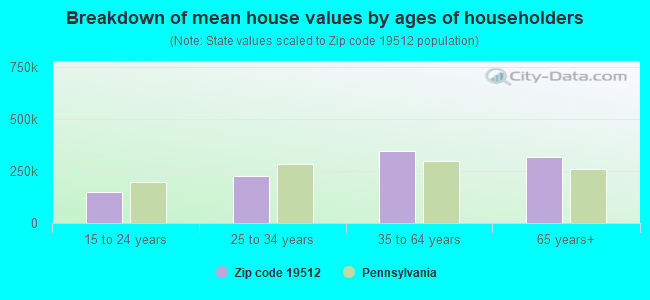
Estimated median house/condo value in 2022: $256,570
19512:
$256,570
Pennsylvania:
$245,500
According to our research of Pennsylvania and other state lists, there were 19 registered sex offenders living in 19512 zip code as of April 27, 2024. The ratio of all residents to sex offenders in zip code 19512 is 911 to 1. The ratio of registered sex offenders to all residents in this zip code is lower than the state average.
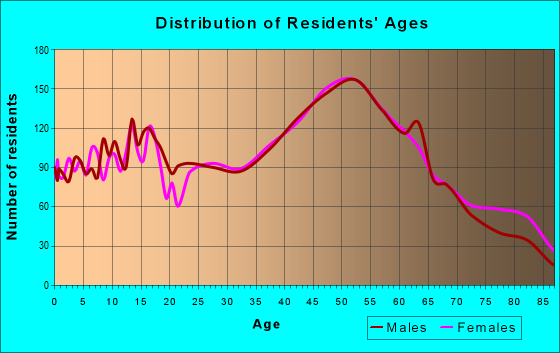
Median resident age:
This zip code:
46.9 years
Pennsylvania median age:
40.9 years
Average household size:
This zip code:
2.3 people
Pennsylvania:
2.4 people
Averages for the 2020 tax year for zip code 19512, filed in 2021:
Average Adjusted Gross Income (AGI) in 2020: $71,071 (Individual Income Tax Returns)
Here:
$71,071
State:
$75,707
Salary/wage: $59,586 (reported on 81.5% of returns)
Here:
$59,586
State:
$62,806
(% of AGI for various income ranges: 1025.6% for AGIs below $25k, 3505.4% for AGIs $25k-50k, 6229.7% for AGIs $50k-75k, 9488.4% for AGIs $75k-100k, 17080.1% for AGIs $100k-200k, 64743.6% for AGIs over 200k)
Taxable interest for individuals: $1,257 (reported on 31.9% of returns)
This zip code:
$1,257
Pennsylvania:
$1,633
(% of AGI for various income ranges: 28.4% for AGIs below $25k, 22.0% for AGIs $25k-50k, 36.8% for AGIs $50k-75k, 48.0% for AGIs $75k-100k, 93.9% for AGIs $100k-200k, 1060.9% for AGIs over 200k)
Ordinary dividends: $4,922 (reported on 22.6% of returns)
Here:
$4,922
State:
$7,382
(% of AGI for various income ranges: 45.6% for AGIs below $25k, 51.4% for AGIs $25k-50k, 103.1% for AGIs $50k-75k, 123.6% for AGIs $75k-100k, 239.8% for AGIs $100k-200k, 3792.7% for AGIs over 200k)
Net capital gain/loss in AGI: +$14,006 (reported on 18.0% of returns)
Here:
+$14,006
State:
+$23,522
(% of AGI for various income ranges: 11.6% for AGIs below $25k, 22.3% for AGIs $25k-50k, 72.8% for AGIs $50k-75k, 107.0% for AGIs $75k-100k, 408.1% for AGIs $100k-200k, 15140.0% for AGIs over 200k)
Profit/loss from business: +$14,323 (reported on 12.0% of returns)
Here:
+$14,323
State:
+$16,274
(% of AGI for various income ranges: 116.1% for AGIs below $25k, 151.4% for AGIs $25k-50k, 210.1% for AGIs $50k-75k, 272.9% for AGIs $75k-100k, 463.0% for AGIs $100k-200k, 2363.6% for AGIs over 200k)
Taxable individual retirement arrangement distribution: $16,544 (reported on 13.0% of returns)
19512:
$16,544
Pennsylvania:
$18,583
(% of AGI for various income ranges: 122.8% for AGIs below $25k, 132.0% for AGIs $25k-50k, 213.4% for AGIs $50k-75k, 365.7% for AGIs $75k-100k, 684.2% for AGIs $100k-200k, 3646.4% for AGIs over 200k)
Self-employed (Keogh) retirement plans: $10,400 (reported on 0.3% of returns)
19512:
$10,400
Pennsylvania:
$25,407
(% of AGI for various income ranges: 34.7% for AGIs $100k-200k)
Total itemized deductions: $26,797 (reported on 7.3% of returns)
Here:
$26,797
State:
$34,850
(% of AGI for various income ranges: 67.0% for AGIs below $25k, 100.4% for AGIs $25k-50k, 252.7% for AGIs $50k-75k, 355.8% for AGIs $75k-100k, 567.4% for AGIs $100k-200k, 3971.8% for AGIs over 200k)
Charity contributions: $7,229 (reported on 5.1% of returns)
Here:
$7,229
State:
$12,392
(% of AGI for various income ranges: 4.2% for AGIs below $25k, 11.3% for AGIs $25k-50k, 40.6% for AGIs $50k-75k, 32.6% for AGIs $75k-100k, 139.0% for AGIs $100k-200k, 983.6% for AGIs over 200k)
Taxes paid: $7,751 (reported on 7.3% of returns)
19512:
$7,751
State:
$8,200
(% of AGI for various income ranges: 12.9% for AGIs below $25k, 28.3% for AGIs $25k-50k, 85.6% for AGIs $50k-75k, 127.2% for AGIs $75k-100k, 185.1% for AGIs $100k-200k, 809.1% for AGIs over 200k)
Earned income credit: $1,867 (reported on 9.2% of returns)
Here:
$1,867
State:
$2,100
(% of AGI for various income ranges: 50.2% for AGIs below $25k, 43.0% for AGIs $25k-50k)
Percentage of individuals using paid preparers for their 2020 taxes: 92.1%
Here:
92%
State:
92%
(% for various income ranges: 90.6% for AGIs below $25k, 93.0% for AGIs $25k-50k, 93.0% for AGIs $50k-75k, 92.0% for AGIs $75k-100k, 92.5% for AGIs $100k-200k, 94.1% for AGIs over 200k)
Averages for the 2012 tax year for zip code 19512, filed in 2013:
Average Adjusted Gross Income (AGI) in 2012: $53,226 (Individual Income Tax Returns)
Here:
$53,226
State:
$61,346
Salary/wage: $48,907 (reported on 83.9% of returns)
Here:
$48,907
State:
$51,902
(% of AGI for various income ranges: 67.9% for AGIs below $25k, 79.2% for AGIs $25k-50k, 79.1% for AGIs $50k-75k, 81.2% for AGIs $75k-100k, 80.0% for AGIs $100k-200k, 62.1% for AGIs over 200k)
Taxable interest for individuals: $1,342 (reported on 38.0% of returns)
This zip code:
$1,342
Pennsylvania:
$1,588
(% of AGI for various income ranges: 1.8% for AGIs below $25k, 0.7% for AGIs $25k-50k, 0.7% for AGIs $50k-75k, 0.4% for AGIs $75k-100k, 0.6% for AGIs $100k-200k, 3.1% for AGIs over 200k)
Ordinary dividends: $3,483 (reported on 24.6% of returns)
Here:
$3,483
State:
$5,827
(% of AGI for various income ranges: 2.4% for AGIs below $25k, 1.1% for AGIs $25k-50k, 1.2% for AGIs $50k-75k, 0.8% for AGIs $75k-100k, 1.2% for AGIs $100k-200k, 4.9% for AGIs over 200k)
Net capital gain/loss in AGI: +$4,386 (reported on 15.5% of returns)
Here:
+$4,386
State:
+$14,495
(% of AGI for various income ranges: 0.2% for AGIs $25k-50k, 0.4% for AGIs $50k-75k, 0.4% for AGIs $75k-100k, 1.4% for AGIs $100k-200k, 6.5% for AGIs over 200k)
Profit/loss from business: +$13,151 (reported on 12.4% of returns)
Here:
+$13,151
State:
+$16,268
(% of AGI for various income ranges: 5.8% for AGIs below $25k, 3.6% for AGIs $25k-50k, 2.8% for AGIs $50k-75k, 2.5% for AGIs $75k-100k, 2.6% for AGIs $100k-200k, 3.1% for AGIs over 200k)
Taxable individual retirement arrangement distribution: $11,808 (reported on 13.2% of returns)
19512:
$11,808
Pennsylvania:
$14,550
(% of AGI for various income ranges: 5.5% for AGIs below $25k, 3.1% for AGIs $25k-50k, 2.4% for AGIs $50k-75k, 2.7% for AGIs $75k-100k, 2.5% for AGIs $100k-200k, 3.1% for AGIs over 200k)
Self-employment retirement plans: $10,767 (reported on 0.4% of returns)
19512:
$10,767
Pennsylvania:
$20,922
Total itemized deductions: $20,212 (22% of AGI, reported on 35.4% of returns)
Here:
$20,212
State:
$23,538
Here:
22.2% of AGI
State:
18.4% of AGI
(% of AGI for various income ranges: 9.5% for AGIs below $25k, 10.0% for AGIs $25k-50k, 12.7% for AGIs $50k-75k, 14.1% for AGIs $75k-100k, 14.3% for AGIs $100k-200k, 19.4% for AGIs over 200k)
Charity contributions: $2,796 (reported on 26.2% of returns)
Here:
$2,796
State:
$4,025
(% of AGI for various income ranges: 0.5% for AGIs below $25k, 0.7% for AGIs $25k-50k, 1.1% for AGIs $50k-75k, 1.4% for AGIs $75k-100k, 1.6% for AGIs $100k-200k, 2.8% for AGIs over 200k)
Taxes paid: $7,927 (reported on 35.2% of returns)
19512:
$7,927
State:
$9,982
(% of AGI for various income ranges: 2.5% for AGIs below $25k, 3.4% for AGIs $25k-50k, 4.7% for AGIs $50k-75k, 5.6% for AGIs $75k-100k, 6.6% for AGIs $100k-200k, 6.6% for AGIs over 200k)
Earned income credit: $1,865 (reported on 11.1% of returns)
Here:
$1,865
State:
$2,106
(% of AGI for various income ranges: 3.6% for AGIs below $25k, 0.7% for AGIs $25k-50k)
Percentage of individuals using paid preparers for their 2012 taxes: 54.3%
Here:
54%
State:
53%
(% for various income ranges: 49.4% for AGIs below $25k, 52.5% for AGIs $25k-50k, 57.9% for AGIs $50k-75k, 59.1% for AGIs $75k-100k, 61.4% for AGIs $100k-200k, 71.4% for AGIs over 200k)
Averages for the 2004 tax year for zip code 19512, filed in 2005:
Average Adjusted Gross Income (AGI) in 2004: $51,895 (Individual Income Tax Returns)
Here:
$51,895
State:
$48,049
Salary/wage: $43,463 (reported on 86.1% of returns)
Here:
$43,463
State:
$42,646
(% of AGI for various income ranges: 113.9% for AGIs below $10k, 68.9% for AGIs $10k-25k, 85.7% for AGIs $25k-50k, 86.1% for AGIs $50k-75k, 87.2% for AGIs $75k-100k, 49.7% for AGIs over 100k)
Taxable interest for individuals: $1,552 (reported on 52.3% of returns)
This zip code:
$1,552
Pennsylvania:
$1,657
(% of AGI for various income ranges: 10.2% for AGIs below $10k, 3.5% for AGIs $10k-25k, 1.7% for AGIs $25k-50k, 0.9% for AGIs $50k-75k, 1.1% for AGIs $75k-100k, 1.5% for AGIs over 100k)
Taxable dividends: $2,857 (reported on 30.4% of returns)
Here:
$2,857
State:
$3,566
(% of AGI for various income ranges: 6.9% for AGIs below $10k, 2.9% for AGIs $10k-25k, 1.0% for AGIs $25k-50k, 1.1% for AGIs $50k-75k, 1.0% for AGIs $75k-100k, 2.3% for AGIs over 100k)
Net capital gain/loss: +$11,929 (reported on 20.2% of returns)
Here:
+$11,929
State:
+$9,716
(% of AGI for various income ranges: -1.9% for AGIs below $10k, 0.3% for AGIs $10k-25k, 0.3% for AGIs $25k-50k, 0.7% for AGIs $50k-75k, 1.0% for AGIs $75k-100k, 11.7% for AGIs over 100k)
Profit/loss from business: +$10,464 (reported on 12.7% of returns)
Here:
+$10,464
State:
+$14,267
(% of AGI for various income ranges: -24.6% for AGIs below $10k, 5.8% for AGIs $10k-25k, 2.8% for AGIs $25k-50k, 3.4% for AGIs $50k-75k, 2.4% for AGIs $75k-100k, 2.3% for AGIs over 100k)
IRA payment deduction: $2,941 (reported on 3.4% of returns)
19512:
$2,941
Pennsylvania:
$2,903
(% of AGI for various income ranges: 0.3% for AGIs $10k-25k, 0.4% for AGIs $25k-50k, 0.2% for AGIs $50k-75k, 0.1% for AGIs $75k-100k, 0.1% for AGIs over 100k)
Self-employed pension: $8,436 (reported on 0.7% of returns)
Here:
$8,436
Pennsylvania:
$14,674
(% of AGI for various income ranges: 0.2% for AGIs $10k-25k, 0.1% for AGIs $50k-75k, 0.1% for AGIs $75k-100k, 0.2% for AGIs over 100k)
Total itemized deductions: $17,223 (18% of AGI, reported on 37.2% of returns)
Here:
$17,223
State:
$18,804
Here:
18.4% of AGI
State:
19.5% of AGI
(% of AGI for various income ranges: 13.4% for AGIs below $10k, 10.4% for AGIs $10k-25k, 12.2% for AGIs $25k-50k, 14.2% for AGIs $50k-75k, 14.9% for AGIs $75k-100k, 10.5% for AGIs over 100k)
Charity contributions deductions: $2,712 (3% of AGI, reported on 31.9% of returns)
Here:
$2,712
State:
$3,337
Here:
2.7% of AGI
State:
3.3% of AGI
(% of AGI for various income ranges: 0.9% for AGIs below $10k, 0.9% for AGIs $10k-25k, 1.0% for AGIs $25k-50k, 1.4% for AGIs $50k-75k, 1.8% for AGIs $75k-100k, 2.3% for AGIs over 100k)
Total tax: $8,083 (reported on 79.7% of returns)
19512:
$8,083
State:
$8,008
(% of AGI for various income ranges: 3.1% for AGIs below $10k, 4.8% for AGIs $10k-25k, 7.7% for AGIs $25k-50k, 8.8% for AGIs $50k-75k, 10.4% for AGIs $75k-100k, 19.4% for AGIs over 100k)
Earned income credit: $1,412 (reported on 7.8% of returns)
Here:
$1,412
State:
$1,643
Percentage of individuals using paid preparers for their 2004 taxes: 56.6%
Here:
57%
State:
56%
(% for various income ranges: 47.2% for AGIs below $10k, 58.3% for AGIs $10k-25k, 54.9% for AGIs $25k-50k, 61.2% for AGIs $50k-75k, 61.1% for AGIs $75k-100k, 64.7% for AGIs over 100k)
Likely homosexual households (counted as self-reported same-sex unmarried-partner households)
Lesbian couples: 0.0% of all households
Gay men: 0.2% of all households
Household received Food Stamps/SNAP in the past 12 months: 459 Household did not receive Food Stamps/SNAP in the past 12 months: 6,441
Women who had a birth in the past 12 months: 233 (187 now married, 49 unmarried) Women who did not have a birth in the past 12 months: 2,939 (1,299 now married, 1,635 unmarried)
Housing units in zip code 19512 with a mortgage: 2,944 (625 second mortgage, 8 home equity loan, 576 both second mortgage and home equity loan) Houses without a mortgage: 120
Median monthly owner costs for units with a mortgage: $1,764 Median monthly owner costs for units without a mortgage: $640
Residents with income below the poverty level in 2022:
This zip code:
7.7%
Whole state:
11.8%
Residents with income below 50% of the poverty level in 2022:
This zip code:
5.4%
Whole state:
6.1%
Median number of rooms in houses and condos:
Here:
6.5
State:
6.8
Median number of rooms in apartments:
Here:
3.9
State:
4.3
Notable locations in this zip code not listed on our city pages
Notable locations in zip code 19512: Camp Grove (A), Hill Church (B), Boyertown Industrial Park (C), Boyertown Rod and Gun Club (D), Boyertown Water Treatment Plant (E), Pine Forge Sportsmen's Club (F), Rolling Hills Landfill (G), Glen Dale Swimming Association (H), Union Mission Camp (I), Friendship Hook and Ladder Company (J), Gabelsville Athletic Association Headquarters (K), Bahr's Mill (L), Boyertown Area Multi-Service Office (M), Boyertown Borough Hall (N), Boyertown Community Center (O), Boyertown Lions Community Ambulance (P), Boyertown Museum of Historic Vehicles (Q), Boyertown Museum of Historic Vehicles Office (R), Boyertown Area Historical Society (S), Charles B. Yerger American Legion Post 471 (T). Display/hide their locations on the map
Churches in zip code 19512 include: Trinity Evangelical Christian Church (A), Jehovah's Witnesses Kingdom Hall (B), Good Shepherd United Church of Christ (C), Saint Johns Evangelical Lutheran Church (D), Saint John-Hill United Church of Christ (E), Saint Columbkill's Roman Catholic Church (F), Shanesville Chapel (G), Laurel Mountain Ministries Chapel (H), Colebrookdale Chapel (I). Display/hide their locations on the map
Cemeteries: Weller Cemetery (1), Fairview Cemetery (2), Hill Church Union Cemetery (3), Fritz Cemetery (4), Union Cemetery (5), Mountain Marys Grave (6). Display/hide their locations on the map
Reservoirs: Glen Dale Swimming Association Pool (A), Boyertown Reservoir (B), Pine Forge Academy Pool (C), Boyertown Pool (D), Trout Run Reservoir (E). Display/hide their locations on the map
Streams, rivers, and creeks: Stone Roll Creek (A), Ironstone Creek (B), Trout Run (C), Corn Church Creek (D), Dieners Daal Creek (E), Drumheller School Creek (F), Moser Run (G), Mountain Mary Creek (H). Display/hide their locations on the map
Parks in zip code 19512 include: Earl Municipal Park (1), Boyertown Community Park (2), Bear Stadium (3), Gabelsville Athletic Association Field (4), Franklin Mini-park (5), Ironstone Park (6), Haas Field (7), Gordon Park (8), Goose Run Park (9). Display/hide their locations on the map
1,944 married couples with children.
691 single-parent households (158 men, 533 women).
96.0% of residents of 19512 zip code speak English at home.
2.2% of residents speak Spanish at home (64% very well, 28% well, 5% not well, 3% not at all).
1.1% of residents speak other Indo-European language at home (95% very well, 5% well).
0.5% of residents speak Asian or Pacific Island language at home (11% very well, 12% well, 76% not well).
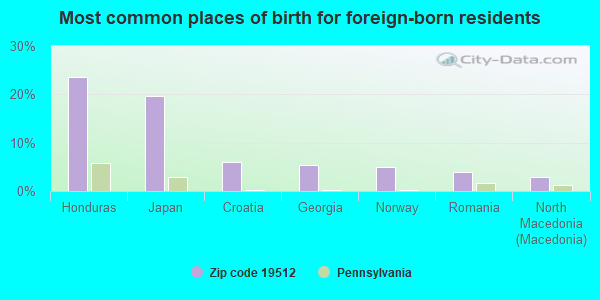
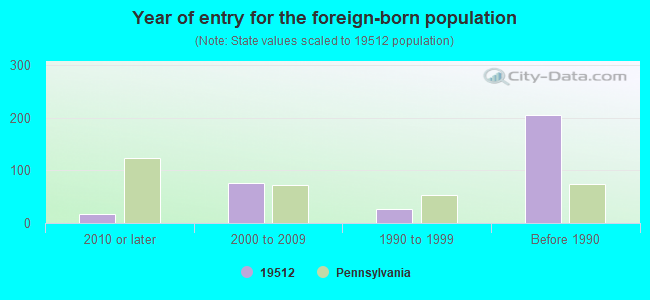
Foreign born population: 279 (1.7%) (60.5% of them are naturalized citizens)
This zip code:
1.7%
Whole state:
7.5%
24%Honduras
20%Japan
6%Croatia
5%Georgia
5%Norway
4%Romania
3%North Macedonia (Macedonia)
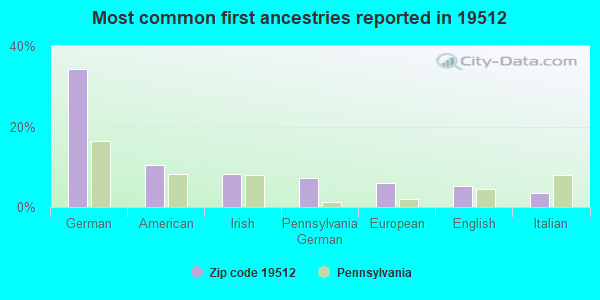
34%German
10%American
8%Irish
7%Pennsylvania German
6%European
5%English
3%Italian
Year of entry for the foreign-born population
182010 or later
752000 to 2009
261990 to 1999
205Before 1990
Facilities with environmental interests located in this zip code:
ALLENTOWN REFRIGERATED TERM (125 SENECA TRAIL in BOYERTOWN, PA)
STATE MASTER (Pennsylvania database) - PCS-PA0084522, National Pollutant Discharge Elimination System Permit National Pollutant Discharge Elimination System NON-MAJOR (Tracking pollutant discharge elimination systems) - permit Business SIC classification: REFRIGERATED WAREHOUSING AND STORAGE Alternative names: ALLENTOWN REFRIGERATED TERMINA, ALLENTOWN REFRIGERATED TERMNAL INC
B TOWN AUTO (470 MILL ST in BOYERTOWN, PA)
STATE MASTER (Pennsylvania database) - RCRIS-PAR000506048, HAZARDOUS WASTE PROGRAM Small Quantity Generators, between 100 kg and 1000 kg of hazardous waste/month (Resource Conservation and Recovery Act (tracking hazardous waste)) - notification Organizations: GLUMSTEAD JIM (CONTACT/OWNER)
AJAX PRODUCTS INC (15 S MADISON in BOYERTOWN, PA)
Small Quantity Generators, between 100 kg and 1000 kg of hazardous waste/month (Resource Conservation and Recovery Act (tracking hazardous waste)) - notification Business NAICS classification: METAL WINDOW AND DOOR MANUFACTURING. Organizations: OPERNAME (CONTACT/OPERATOR)
, BERGENSTOCK, ROBERT (CONTACT/OWNER)
Alternative names: AJAX PRODUCTS INCORPORATED MANUFACTURING
BEAN FRED FORD (RT 100 N in BOYERTOWN, PA)
Small Quantity Generators, between 100 kg and 1000 kg of hazardous waste/month (Resource Conservation and Recovery Act (tracking hazardous waste)) - notification Business NAICS classification: PASSENGER CAR RENTAL.; PASSENGER CAR LEASING.; AUTOMOTIVE BODY, PAINT, AND INTERIOR REPAIR AND MAINTENANCE. Organizations: OPERNAME (CONTACT/OPERATOR)
Housing units lacking complete plumbing facilities: 0.0% Housing units lacking complete kitchen facilities: 3.6%
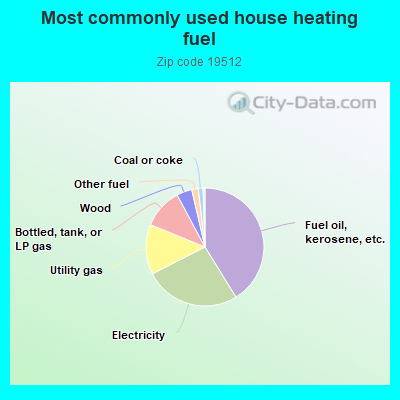
41.2%Fuel oil, kerosene, etc.
26.3%Electricity
13.7%Utility gas
11.0%Bottled, tank, or LP gas
4.2%Wood
1.8%Other fuel
1.3%Coal or coke
0.5%No fuel used
Population in 1990: 17,139. Population change in the 1990s: +257 (+1.5%).
Place of birth for U.S.-born residents:
This state: 13,277
Northeast: 956
Midwest: 625
South: 668
West: 296
69% of the 19512 zip code residents lived in the same house 5 years ago. Out of people who lived in different houses, 55% lived in this county. Out of people who lived in different counties, 50% lived in Pennsylvania.
96% of the 19512 zip code residents lived in the same house 1 year ago. Out of people who lived in different houses, 64% moved from this county. Out of people who lived in different houses, 24% moved from different county within same state. Out of people who lived in different houses, 17% moved from different state.
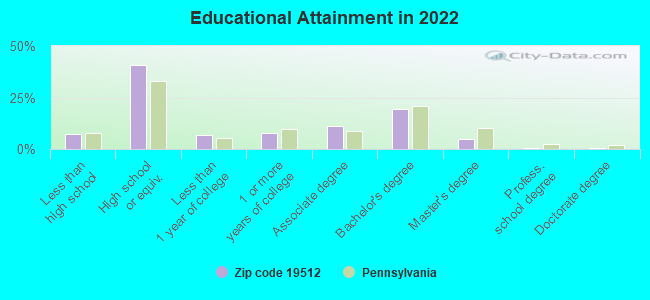
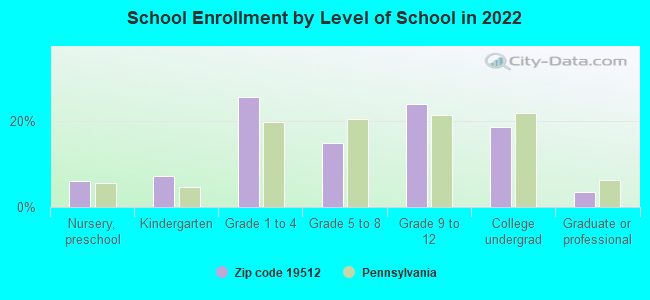
Private vs. public school enrollment:
Students in private schools in grades 1 to 8 (elementary and middle school): 272
Here:
21.3%
Pennsylvania:
15.7%
Students in private schools in grades 9 to 12 (high school): 129
Here:
17.3%
Pennsylvania:
13.4%
Students in private undergraduate colleges: 145
Here:
24.6%
Pennsylvania:
39.8%
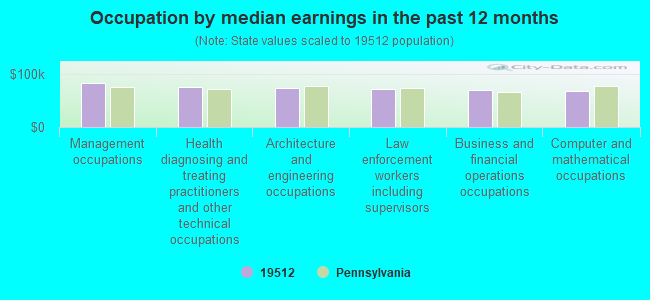
Occupation by median earnings in the past 12 months ($)
83,383Management occupations
76,295Health diagnosing and treating practitioners and other technical occupations
73,001Architecture and engineering occupations
72,220Law enforcement workers including supervisors
70,158Business and financial operations occupations
68,769Computer and mathematical occupations
Companies with federal contracts located in this zip code (BOYERTOWN, PA):
FRACCARO INDUSTRIES, INC (1032 N READING AVE; small business) : $3,494,604 in 45 contractsfrom 1999 to 2006
Contracts for Helicopter Rotor Blades, Drive Mechanisms and Components, Hardware, Commercial, Airframe Structural Components, Bolts, and moreby U.S. Coast Guard, United States Coast Guard (disused code: now 7008), Defense Logistics Agency, Navy, and others Signed by year:2000: $573,525; 2001: $356,000; 2002: $1,110,812; 2003: $597,689; 2004: $621,092; 2005: $167,336; 2006: $10,150.
Biggest contracts:
$326,000 with U.S. Coast Guard for Helicopter Rotor Blades, Drive Mechanisms and Components. Signed on 2004-02-03. Completion date: 2004-09-30.
$202,800, same as above.Signed on 2002-04-01. Effective on 2002-11-06. Completion date: 2005-11-05.
$189,000, same as above.Signed on 2003-05-15. Completion date: 2003-09-15.
$189,000 with United States Coast Guard (disused code: now 7008) for Helicopter Rotor Blades, Drive Mechanisms and Components. Signed on 2002-12-15. Completion date: 2003-04-15.
COLEBROOKE ENTERPRISES LTD (320 SOUTH WASHINGTON STREE; small business) : $70,723 in 3 contractsfrom 2000 to 2005
$33,154 with Defense Logistics Agency for Outerwear, Men's. Signed on 2001-11-08. Completion date: 2002-03-30.
$32,769 with Defense Logistics Agency for Outerwear, Women's. Signed on 2000-09-12. Completion date: 2000-11-30.
$4,800, same as above.Signed on 2005-03-25. Completion date: 2005-03-25.
RESCUE SOLUTIONS INC (601 HIGHLAND AVE)
$44,186 with Navy for Miscellaneous Fire Control Equipment. Signed on 2002-07-26. Completion date: 2002-10-29.
BOB HILBERT SPORTSWEAR (695 ENGLESVILLE RD; small business)
$8,625 with Army for Clothing, Special Purpose. Signed on 2004-07-25. Completion date: 2004-08-31.
FRAIN, GRETA D (1037 READING AVE; small business) : $6,240 in 5 contractsfrom 2004 to 2006
Contracts for Other Professional Services by Army Signed by year:2000: $0; 2001: $0; 2002: $0; 2003: $0; 2004: $7,410; 2005: $0; 2006: -$1,170.
Biggest contracts:
$3,250 with Army for Other Professional Services. Signed on 2004-04-23. Completion date: 2005-04-21.
$2,860, same as above.Signed on 2004-07-16. Completion date: 2005-04-21.
$1,300, same as above.Signed on 2004-09-20. Completion date: 2005-04-21.
$0, same as above.Signed on 2006-02-27. Completion date: 2005-04-21.
Top industries in this zip code by the number of employees in 2005:
2003 - 2018 National Fire Incident Reporting System (NFIRS) incidents
Based on the data from the years 2003 - 2018 the average number of fires per year is 75. The highest number of reported fire incidents - 170 took place in 2008, and the least - 15 in 2014. The data has a decreasing trend.
When looking into fire subcategories, the most incidents belonged to: Structure Fires (55.8%), and Outside Fires (31.6%).
Fire incident types reported to NFIRS in Zip Code 19512
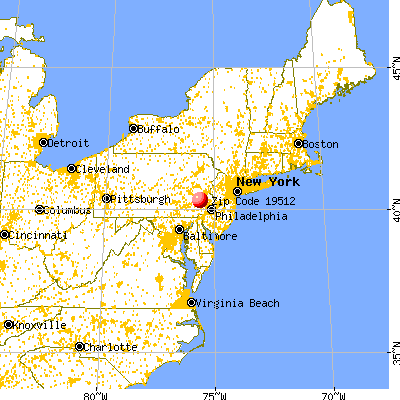


 Nearest zip codes: 19545, 19519, 19505, 19547, 19525, 19518.
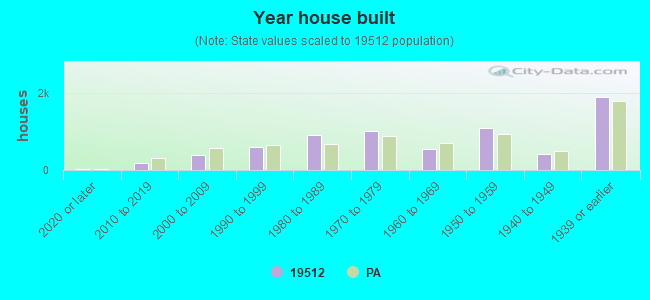


 Based on the data from the years 2003 - 2018 the average number of fires per year is 75. The highest number of reported fire incidents - 170 took place in 2008, and the least - 15 in 2014. The data has a decreasing trend.
 When looking into fire subcategories, the most incidents belonged to: Structure Fires (55.8%), and Outside Fires (31.6%).