Estimated zip code population in 2022: 21,971 Zip code population in 2010: 21,364 Zip code population in 2000: 21,055
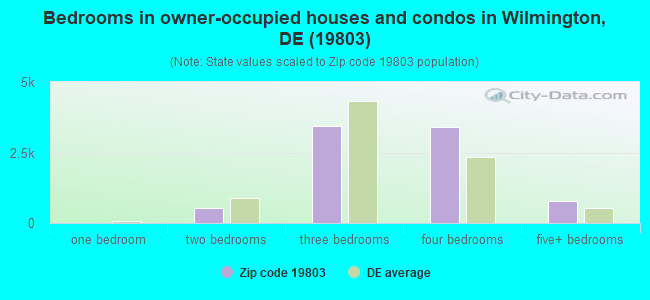
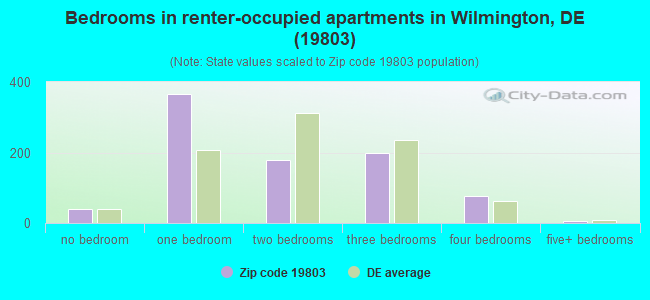
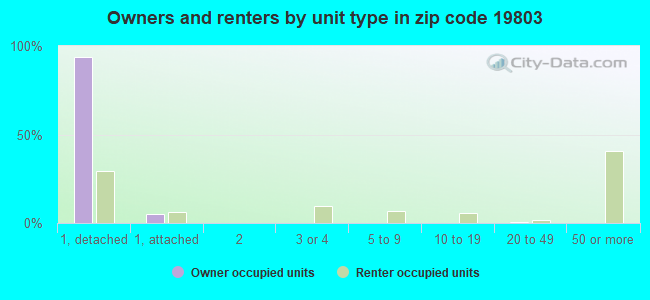
Houses and condos: 9,000 Renter-occupied apartments: 844
% of renters here:
9%
State:
26%
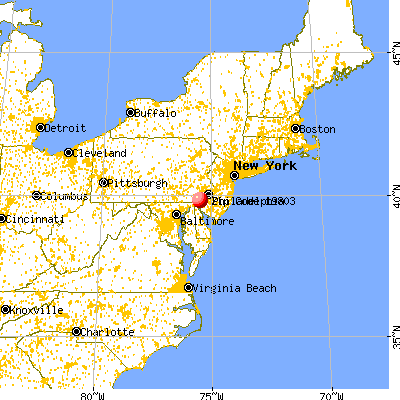
March 2022 cost of living index in zip code 19803: 102.4 (near average, U.S. average is 100)
Land area: 12.6 sq. mi. Water area: 0.0 sq. mi.
Population density: 1,744 people per square mile
(low).
OSM Map
General Map
Google Map
MSN Map
OSM Map
General Map
Google Map
MSN Map
OSM Map
General Map
Google Map
MSN Map
OSM Map
General Map
Google Map
MSN Map
Please wait while loading the map...
Real estate property taxes paid for housing units in 2022:
This zip code:
0.6% ($2,867)
Delaware:
0.5% ($1,635)
Median real estate property taxes paid for housing units with mortgages in 2022: $2,798 (0.6%) Median real estate property taxes paid for housing units with no mortgage in 2022: $3,135 (0.7%)
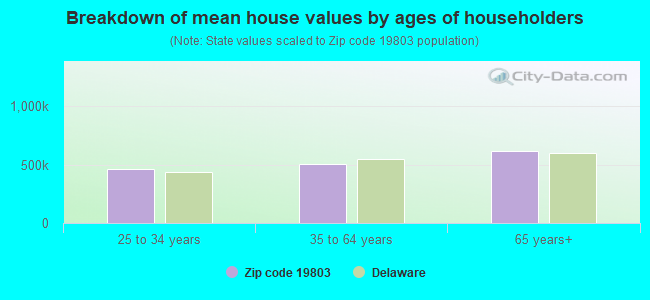
Estimated median house/condo value in 2022: $442,161
19803:
$442,161
Delaware:
$337,200
According to our research of Delaware and other state lists, there were 11 registered sex offenders living in 19803 zip code as of April 26, 2024. The ratio of all residents to sex offenders in zip code 19803 is 2,008 to 1. The ratio of registered sex offenders to all residents in this zip code is much lower than the state average.
Median resident age:
This zip code:
47.4 years
Delaware median age:
41.5 years
Average household size:
This zip code:
2.4 people
Delaware:
2.5 people
Averages for the 2020 tax year for zip code 19803, filed in 2021:
Average Adjusted Gross Income (AGI) in 2020: $124,580 (Individual Income Tax Returns)
Here:
$124,580
State:
$74,239
Salary/wage: $102,426 (reported on 75.9% of returns)
Here:
$102,426
State:
$59,982
(% of AGI for various income ranges: 1145.0% for AGIs below $25k, 3274.4% for AGIs $25k-50k, 6263.3% for AGIs $50k-75k, 8918.9% for AGIs $75k-100k, 18247.6% for AGIs $100k-200k, 76794.6% for AGIs over 200k)
Taxable interest for individuals: $2,187 (reported on 51.7% of returns)
This zip code:
$2,187
Delaware:
$1,604
(% of AGI for various income ranges: 34.4% for AGIs below $25k, 77.0% for AGIs $25k-50k, 93.5% for AGIs $50k-75k, 133.1% for AGIs $75k-100k, 238.2% for AGIs $100k-200k, 1083.7% for AGIs over 200k)
Ordinary dividends: $9,718 (reported on 45.4% of returns)
Here:
$9,718
State:
$8,303
(% of AGI for various income ranges: 91.7% for AGIs below $25k, 213.0% for AGIs $25k-50k, 340.9% for AGIs $50k-75k, 491.1% for AGIs $75k-100k, 889.0% for AGIs $100k-200k, 4695.0% for AGIs over 200k)
Net capital gain/loss in AGI: +$17,640 (reported on 39.2% of returns)
Here:
+$17,640
State:
+$19,461
(% of AGI for various income ranges: 68.7% for AGIs below $25k, 171.5% for AGIs $25k-50k, 209.4% for AGIs $50k-75k, 310.0% for AGIs $75k-100k, 847.6% for AGIs $100k-200k, 10547.0% for AGIs over 200k)
Profit/loss from business: +$25,982 (reported on 15.1% of returns)
Here:
+$25,982
State:
+$13,079
(% of AGI for various income ranges: 108.8% for AGIs below $25k, 236.4% for AGIs $25k-50k, 298.3% for AGIs $50k-75k, 308.1% for AGIs $75k-100k, 701.3% for AGIs $100k-200k, 4466.3% for AGIs over 200k)
Taxable individual retirement arrangement distribution: $27,819 (reported on 17.6% of returns)
19803:
$27,819
Delaware:
$22,095
(% of AGI for various income ranges: 106.6% for AGIs below $25k, 256.9% for AGIs $25k-50k, 473.4% for AGIs $50k-75k, 624.4% for AGIs $75k-100k, 1394.2% for AGIs $100k-200k, 3772.2% for AGIs over 200k)
Self-employed (Keogh) retirement plans: $29,857 (reported on 1.9% of returns)
19803:
$29,857
Delaware:
$28,197
(% of AGI for various income ranges: 46.4% for AGIs $100k-200k, 1029.6% for AGIs over 200k)
Total itemized deductions: $31,962 (reported on 19.3% of returns)
Here:
$31,962
State:
$30,452
(% of AGI for various income ranges: 155.5% for AGIs below $25k, 306.2% for AGIs $25k-50k, 578.7% for AGIs $50k-75k, 953.6% for AGIs $75k-100k, 1313.2% for AGIs $100k-200k, 5742.2% for AGIs over 200k)
Charity contributions: $9,226 (reported on 16.4% of returns)
Here:
$9,226
State:
$8,999
(% of AGI for various income ranges: 7.9% for AGIs below $25k, 25.7% for AGIs $25k-50k, 69.9% for AGIs $50k-75k, 129.7% for AGIs $75k-100k, 272.0% for AGIs $100k-200k, 1981.1% for AGIs over 200k)
Taxes paid: $8,475 (reported on 18.8% of returns)
19803:
$8,475
State:
$7,483
(% of AGI for various income ranges: 17.4% for AGIs below $25k, 41.8% for AGIs $25k-50k, 125.6% for AGIs $50k-75k, 261.4% for AGIs $75k-100k, 428.0% for AGIs $100k-200k, 1388.0% for AGIs over 200k)
Earned income credit: $1,718 (reported on 4.5% of returns)
Here:
$1,718
State:
$2,247
(% of AGI for various income ranges: 41.5% for AGIs below $25k, 29.2% for AGIs $25k-50k)
Percentage of individuals using paid preparers for their 2020 taxes: 90.3%
Here:
90%
State:
92%
(% for various income ranges: 88.1% for AGIs below $25k, 89.8% for AGIs $25k-50k, 90.1% for AGIs $50k-75k, 89.9% for AGIs $75k-100k, 91.4% for AGIs $100k-200k, 92.0% for AGIs over 200k)
Averages for the 2012 tax year for zip code 19803, filed in 2013:
Average Adjusted Gross Income (AGI) in 2012: $107,307 (Individual Income Tax Returns)
Here:
$107,307
State:
$61,157
Salary/wage: $88,968 (reported on 78.5% of returns)
Here:
$88,968
State:
$50,642
(% of AGI for various income ranges: 62.1% for AGIs below $25k, 64.5% for AGIs $25k-50k, 63.3% for AGIs $50k-75k, 66.0% for AGIs $75k-100k, 70.2% for AGIs $100k-200k, 62.1% for AGIs over 200k)
Taxable interest for individuals: $2,153 (reported on 57.4% of returns)
This zip code:
$2,153
Delaware:
$1,571
(% of AGI for various income ranges: 2.8% for AGIs below $25k, 1.5% for AGIs $25k-50k, 1.6% for AGIs $50k-75k, 1.1% for AGIs $75k-100k, 0.9% for AGIs $100k-200k, 1.1% for AGIs over 200k)
Ordinary dividends: $8,551 (reported on 47.0% of returns)
Here:
$8,551
State:
$6,610
(% of AGI for various income ranges: 5.9% for AGIs below $25k, 3.5% for AGIs $25k-50k, 4.0% for AGIs $50k-75k, 3.4% for AGIs $75k-100k, 3.1% for AGIs $100k-200k, 4.1% for AGIs over 200k)
Net capital gain/loss in AGI: +$8,026 (reported on 37.1% of returns)
Here:
+$8,026
State:
+$11,439
(% of AGI for various income ranges: 0.5% for AGIs $25k-50k, 0.6% for AGIs $50k-75k, 0.8% for AGIs $75k-100k, 1.5% for AGIs $100k-200k, 4.9% for AGIs over 200k)
Profit/loss from business: +$23,674 (reported on 14.8% of returns)
Here:
+$23,674
State:
+$12,773
(% of AGI for various income ranges: 6.5% for AGIs below $25k, 4.3% for AGIs $25k-50k, 3.1% for AGIs $50k-75k, 2.5% for AGIs $75k-100k, 3.0% for AGIs $100k-200k, 3.3% for AGIs over 200k)
Taxable individual retirement arrangement distribution: $23,467 (reported on 20.6% of returns)
19803:
$23,467
Delaware:
$16,790
(% of AGI for various income ranges: 6.1% for AGIs below $25k, 5.2% for AGIs $25k-50k, 5.3% for AGIs $50k-75k, 5.3% for AGIs $75k-100k, 5.4% for AGIs $100k-200k, 3.4% for AGIs over 200k)
Self-employment retirement plans: $26,268 (reported on 2.0% of returns)
19803:
$26,268
Delaware:
$22,611
(% of AGI for various income ranges: 0.5% for AGIs $25k-50k, 0.2% for AGIs $100k-200k, 0.9% for AGIs over 200k)
Total itemized deductions: $28,636 (17% of AGI, reported on 54.2% of returns)
Here:
$28,636
State:
$23,216
Here:
17.3% of AGI
State:
19.8% of AGI
(% of AGI for various income ranges: 18.7% for AGIs below $25k, 13.8% for AGIs $25k-50k, 15.5% for AGIs $50k-75k, 16.4% for AGIs $75k-100k, 15.3% for AGIs $100k-200k, 13.2% for AGIs over 200k)
Charity contributions: $4,605 (reported on 47.8% of returns)
Here:
$4,605
State:
$3,791
(% of AGI for various income ranges: 1.2% for AGIs below $25k, 1.5% for AGIs $25k-50k, 1.9% for AGIs $50k-75k, 2.0% for AGIs $75k-100k, 2.0% for AGIs $100k-200k, 2.2% for AGIs over 200k)
Taxes paid: $12,756 (reported on 53.4% of returns)
19803:
$12,756
State:
$8,129
(% of AGI for various income ranges: 2.6% for AGIs below $25k, 3.2% for AGIs $25k-50k, 4.3% for AGIs $50k-75k, 5.3% for AGIs $75k-100k, 6.5% for AGIs $100k-200k, 7.5% for AGIs over 200k)
Earned income credit: $1,711 (reported on 5.2% of returns)
Here:
$1,711
State:
$2,231
(% of AGI for various income ranges: 2.6% for AGIs below $25k, 0.4% for AGIs $25k-50k)
Percentage of individuals using paid preparers for their 2012 taxes: 51.3%
Here:
51%
State:
47%
(% for various income ranges: 44.8% for AGIs below $25k, 46.2% for AGIs $25k-50k, 51.3% for AGIs $50k-75k, 52.8% for AGIs $75k-100k, 53.3% for AGIs $100k-200k, 66.1% for AGIs over 200k)
Averages for the 2004 tax year for zip code 19803, filed in 2005:
Average Adjusted Gross Income (AGI) in 2004: $89,579 (Individual Income Tax Returns)
Here:
$89,579
State:
$54,038
Salary/wage: $71,679 (reported on 77.2% of returns)
Here:
$71,679
State:
$44,625
(% of AGI for various income ranges: 125.3% for AGIs below $10k, 55.4% for AGIs $10k-25k, 64.2% for AGIs $25k-50k, 63.7% for AGIs $50k-75k, 69.0% for AGIs $75k-100k, 59.8% for AGIs over 100k)
Taxable interest for individuals: $2,867 (reported on 69.1% of returns)
This zip code:
$2,867
Delaware:
$1,734
(% of AGI for various income ranges: 11.4% for AGIs below $10k, 6.0% for AGIs $10k-25k, 3.5% for AGIs $25k-50k, 3.1% for AGIs $50k-75k, 2.1% for AGIs $75k-100k, 1.8% for AGIs over 100k)
Taxable dividends: $6,140 (reported on 55.8% of returns)
Here:
$6,140
State:
$5,362
(% of AGI for various income ranges: 13.7% for AGIs below $10k, 6.8% for AGIs $10k-25k, 4.2% for AGIs $25k-50k, 3.9% for AGIs $50k-75k, 3.6% for AGIs $75k-100k, 3.6% for AGIs over 100k)
Net capital gain/loss: +$11,620 (reported on 44.3% of returns)
Here:
+$11,620
State:
+$17,328
(% of AGI for various income ranges: -5.4% for AGIs below $10k, 0.7% for AGIs $10k-25k, 0.5% for AGIs $25k-50k, 1.3% for AGIs $50k-75k, 1.0% for AGIs $75k-100k, 8.0% for AGIs over 100k)
Profit/loss from business: +$20,809 (reported on 13.9% of returns)
Here:
+$20,809
State:
+$12,191
(% of AGI for various income ranges: 1.6% for AGIs below $10k, 5.1% for AGIs $10k-25k, 2.9% for AGIs $25k-50k, 3.3% for AGIs $50k-75k, 3.5% for AGIs $75k-100k, 3.1% for AGIs over 100k)
IRA payment deduction: $3,514 (reported on 3.2% of returns)
19803:
$3,514
Delaware:
$3,027
(% of AGI for various income ranges: 0.5% for AGIs below $10k, 0.3% for AGIs $10k-25k, 0.3% for AGIs $25k-50k, 0.2% for AGIs $50k-75k, 0.2% for AGIs $75k-100k, 0.1% for AGIs over 100k)
Self-employed pension: $18,127 (reported on 2.6% of returns)
Here:
$18,127
Delaware:
$15,466
(% of AGI for various income ranges: 0.1% for AGIs $25k-50k, 0.2% for AGIs $50k-75k, 0.2% for AGIs $75k-100k, 0.7% for AGIs over 100k)
Total itemized deductions: $23,595 (17% of AGI, reported on 53.1% of returns)
Here:
$23,595
State:
$19,441
Here:
16.7% of AGI
State:
19.3% of AGI
(% of AGI for various income ranges: 23.2% for AGIs below $10k, 17.8% for AGIs $10k-25k, 14.6% for AGIs $25k-50k, 17.5% for AGIs $50k-75k, 16.7% for AGIs $75k-100k, 12.7% for AGIs over 100k)
Charity contributions deductions: $4,381 (3% of AGI, reported on 49.9% of returns)
Here:
$4,381
State:
$3,727
Here:
3.0% of AGI
State:
3.5% of AGI
(% of AGI for various income ranges: 1.0% for AGIs below $10k, 1.3% for AGIs $10k-25k, 2.1% for AGIs $25k-50k, 2.6% for AGIs $50k-75k, 2.7% for AGIs $75k-100k, 2.5% for AGIs over 100k)
Total tax: $17,823 (reported on 84.7% of returns)
19803:
$17,823
State:
$8,958
(% of AGI for various income ranges: 4.0% for AGIs below $10k, 4.7% for AGIs $10k-25k, 7.8% for AGIs $25k-50k, 9.8% for AGIs $50k-75k, 10.9% for AGIs $75k-100k, 20.4% for AGIs over 100k)
Earned income credit: $1,327 (reported on 3.5% of returns)
Here:
$1,327
State:
$1,733
Percentage of individuals using paid preparers for their 2004 taxes: 52.2%
Here:
52%
State:
55%
(% for various income ranges: 41.5% for AGIs below $10k, 52.2% for AGIs $10k-25k, 50.0% for AGIs $25k-50k, 54.8% for AGIs $50k-75k, 53.4% for AGIs $75k-100k, 57.9% for AGIs over 100k)
Likely homosexual households (counted as self-reported same-sex unmarried-partner households)
Lesbian couples: 0.0% of all households
Gay men: 0.2% of all households
Household received Food Stamps/SNAP in the past 12 months: 225 Household did not receive Food Stamps/SNAP in the past 12 months: 8,573
Women who had a birth in the past 12 months: 167 (177 now married, 2 unmarried) Women who did not have a birth in the past 12 months: 3,926 (1,942 now married, 2,014 unmarried)
Housing units in zip code 19803 with a mortgage: 5,314 (791 second mortgage, 7 home equity loan, 747 both second mortgage and home equity loan) Houses without a mortgage: 326
Median monthly owner costs for units with a mortgage: $2,059 Median monthly owner costs for units without a mortgage: $653
Residents with income below the poverty level in 2022:
This zip code:
3.0%
Whole state:
9.4%
Residents with income below 50% of the poverty level in 2022:
This zip code:
1.3%
Whole state:
4.6%
Median number of rooms in houses and condos:
Here:
7.8
State:
6.9
Median number of rooms in apartments:
Here:
3.8
State:
4.4
Notable locations in this zip code not listed on our city pages
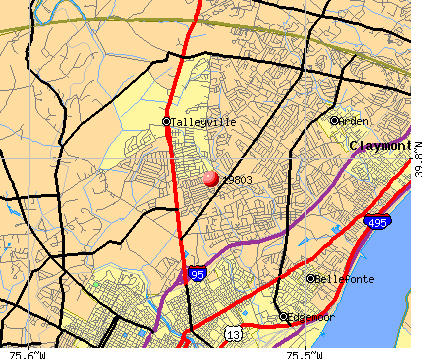
Notable locations in zip code 19803: Rock Manor Golf Course (A), Brandywine Town Center (B), DuPont Country Club (C), Delaware Corporate Center (D), Talleyville Fire Company (E), New Castle Public Library Brandywine Hundred Branch (F), Lombardy Hall (G). Display/hide their locations on the map
Shopping Centers: Marsh Road Shopping Center (1), Fairfax Shopping Center (2), Independence Mall (3), Brandywine Commons Shopping Center (4), Concord Pike Village Shopping Center (5). Display/hide their locations on the map
Churches in zip code 19803 include: Beverly Church (A), Saint Pauls Church (B), Bethel Baptist Church (C), Lower Brandywine Church (D), Saint Albans Episcopal Church (E), Good Shepherd Lutheran Church (F), Concord Presbyterian Church (G), Emmanuel Presbyterian Church (H), Shellburne Bible Church (I). Display/hide their locations on the map
Cemeteries: Jewish Community Cemetery (1), Newark Union Cemetery (2), Lombardy Cemetery (3), Mount Lebanon Cemetery (4). Display/hide their locations on the map
3,511 married couples with children.
632 single-parent households (171 men, 461 women).
91.9% of residents of 19803 zip code speak English at home.
3.4% of residents speak Spanish at home (81% very well, 14% well, 4% not well, 1% not at all).
2.5% of residents speak other Indo-European language at home (84% very well, 11% well, 5% not well).
2.3% of residents speak Asian or Pacific Island language at home (55% very well, 22% well, 22% not well).
0.3% of residents speak other language at home (84% very well, 16% not well).
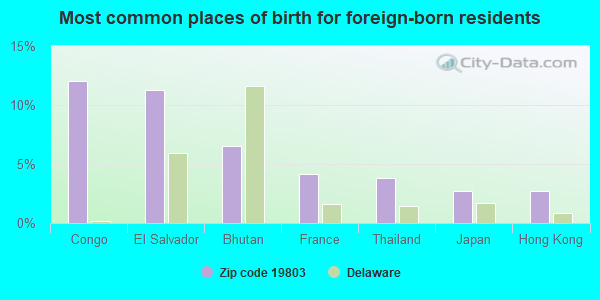
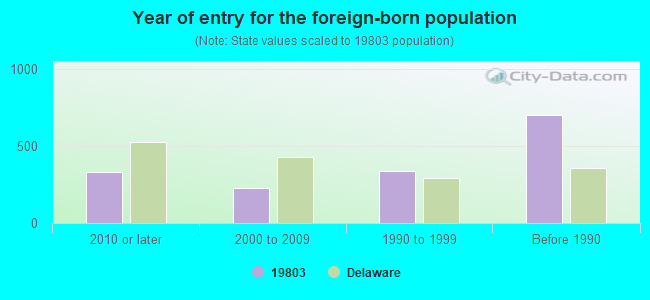
Foreign born population: 1,532 (7.0%) (70.5% of them are naturalized citizens)
Major facilities with environmental interests located in this zip code:
LOMBARDY ELEMENTARY SCHOOL (412 FOULK ROAD in WILMINGTON, DE)
AIR MONITORING SITE (Airborne pollution emission tracking) (Geographic Names Information System) COMPLIANCE ACTIVITY (Tracking inspections of insecticide, fungicide, and rodenticide, and toxic substances) (National Center for Education Statistics) - STATE ID-130 Organizations: BRANDYWINE SCHOOL DISTRICT (SCHOOL DISTRICT)
Alternative names: LOMBARDY SCHOOL
ALBERT EINSTEIN ACADEMY (101 GARDEN OF EDEN RD. in WILMINGTON, DE)
(Geographic Names Information System) (Integrated Compliance Information System) - ICIS-03-1989-0518, FORMAL ENFORCEMENT ACTION, ICIS-03-1986-0244, ICIS-03-2000-0042, COMPLIANCE ACTIVITY (Tracking inspections of insecticide, fungicide, and rodenticide, and toxic substances) Business SIC classification: CIVIC, SOCIAL, AND FRATERNAL ASSOCIATIONS Alternative names: ALBERT EINSTEIN SCHOOL
BRANDYWINE HIGH SCHOOL (1400 FOULK RD in WILMINGTON, DE)
(Geographic Names Information System) COMPLIANCE ACTIVITY (Tracking inspections of insecticide, fungicide, and rodenticide, and toxic substances) (National Center for Education Statistics) - STATE ID-190 Organizations: BRANDYWINE SCHOOL DISTRICT (SCHOOL DISTRICT)
CARRCROFT ELEMENTARY SCHOOL (503 CREST ROAD in WILMINGTON, DE)
(Geographic Names Information System) COMPLIANCE ACTIVITY (Tracking inspections of insecticide, fungicide, and rodenticide, and toxic substances) (National Center for Education Statistics) - STATE ID-112 Organizations: BRANDYWINE SCHOOL DISTRICT (SCHOOL DISTRICT)
CHARLES W BUSH SCHOOL (101 WHITBY DRIVE in WILMINGTON, DE)
(Geographic Names Information System) COMPLIANCE ACTIVITY (Tracking inspections of insecticide, fungicide, and rodenticide, and toxic substances) (National Center for Education Statistics) - STATE ID-510 Organizations: BRANDYWINE SCHOOL DISTRICT (SCHOOL DISTRICT)
SPRINGER JUNIOR HIGH SCHOOL (2220 SHIPLEY ROAD in WILMINGTON, DE)
(Geographic Names Information System) (National Center for Education Statistics) - STATE ID-178 Organizations: BRANDYWINE SCHOOL DISTRICT (SCHOOL DISTRICT)
Alternative names: SPRINGER MIDDLE SCHOOL
FAITH PRE SCHOOL & DAYCARE (720 MARSH ROAD in WILMINGTON, DE)
(Integrated Compliance Information System) - ICIS-03-1989-0530, FORMAL ENFORCEMENT ACTION COMPLIANCE ACTIVITY (Tracking inspections of insecticide, fungicide, and rodenticide, and toxic substances) Business SIC classification: CHILD DAY CARE SERVICES Alternative names: HOLLY OAK DAY SCH INC
BRANDYWINE SCH DIST (93 COLORADO AVE in WILMINGTON, DE)
(Integrated Compliance Information System) - ICIS-03-1986-0086, FORMAL ENFORCEMENT ACTION
KARUN, LLC (3401 MILLER ROAD in WILMINGTON, DE)
HAZARDOUS WASTE BIENNIAL REPORTER (Resource Conservation and Recovery Act (tracking hazardous waste)) Large Quantity Generators, more that 1000 kg of hazardous waste/month (Resource Conservation and Recovery Act (tracking hazardous waste)) - notification TSD (Resource Conservation and Recovery Act (tracking hazardous waste)) - notification
TOWNE & COUNTRY CLEANERS, INC. (3301 CONCORD PIKE in WILMINGTON, DE)
AIR MINOR (AIRS/AFS) Small Quantity Generators, between 100 kg and 1000 kg of hazardous waste/month (Resource Conservation and Recovery Act (tracking hazardous waste)) - notification Business SIC classification: DRYCLEANING PLANTS, EXCEPT RUG CLEANING Organizations: OPERNAME (CONTACT/OPERATOR)
, GRENNBURG, MARTIN (CONTACT/OWNER)
FAIRFAX VALET CLEANERS (3 FAIRFAX BOULEVARD in WILMINGTON, DE)
AIR MINOR (AIRS/AFS) Conditionally Exempt Small Quantity Generators, less than 100 kg/month of hazardous waste (Resource Conservation and Recovery Act (tracking hazardous waste)) - notification Business SIC classification: DRYCLEANING PLANTS, EXCEPT RUG CLEANING Organizations: OPERNAME (CONTACT/OPERATOR)
, SANG UK PARK (CONTACT/OWNER)
ROYAL CLEANERS (3914 CONCORD PIKE in WILMINGTON, DE)
AIR MINOR (AIRS/AFS) Small Quantity Generators, between 100 kg and 1000 kg of hazardous waste/month (Resource Conservation and Recovery Act (tracking hazardous waste)) - notification Business SIC classification: DRYCLEANING PLANTS, EXCEPT RUG CLEANING Organizations: OPERNAME (CONTACT/OPERATOR)
, FRANK GEORGE (CONTACT/OWNER)
SUNOCO SERVICE STATION (TALLEYVILLE in WILMINGTON, DE)
(Resource Conservation and Recovery Act (tracking hazardous waste)) Organizations: OPERNAME (CONTACT/OPERATOR)
, SUN OIL COMPANY OF PA (CONTACT/OWNER)
Housing units lacking complete plumbing facilities: 0.4% Housing units lacking complete kitchen facilities: 2.1%
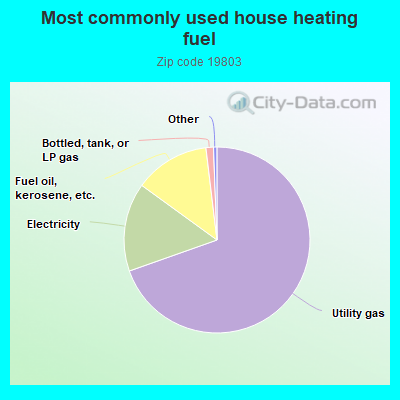
69.6%Utility gas
15.4%Electricity
13.1%Fuel oil, kerosene, etc.
1.3%Bottled, tank, or LP gas
Population in 1990: 20,901. Population change in the 1990s: +154 (+0.7%).
Place of birth for U.S.-born residents:
This state: 8,977
Northeast: 8,320
Midwest: 936
South: 1,762
West: 387
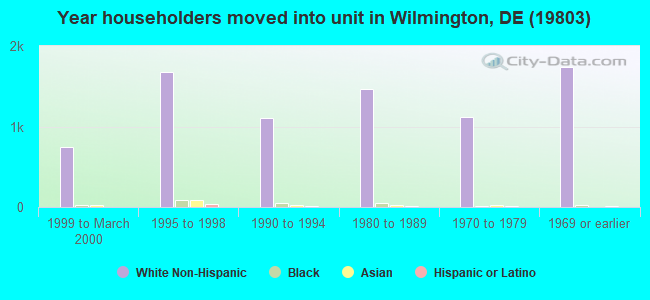
67% of the 19803 zip code residents lived in the same house 5 years ago. Out of people who lived in different houses, 67% lived in this county. Out of people who lived in different counties, 50% lived in Delaware.
93% of the 19803 zip code residents lived in the same house 1 year ago. Out of people who lived in different houses, 33% moved from this county. Out of people who lived in different houses, 2% moved from different county within same state. Out of people who lived in different houses, 70% moved from different state. Out of people who lived in different houses, 1% moved from abroad.
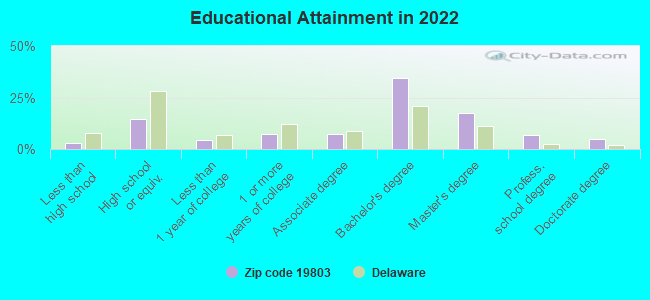
Private vs. public school enrollment:
Students in private schools in grades 1 to 8 (elementary and middle school): 551
Here:
30.1%
Delaware:
11.5%
Students in private schools in grades 9 to 12 (high school): 384
Here:
32.5%
Delaware:
12.1%
Students in private undergraduate colleges: 232
Here:
33.1%
Delaware:
19.2%
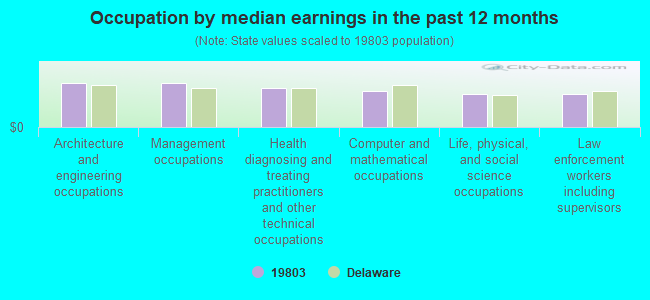
Occupation by median earnings in the past 12 months ($)
120,121Architecture and engineering occupations
119,734Management occupations
107,633Health diagnosing and treating practitioners and other technical occupations
97,528Computer and mathematical occupations
91,455Life, physical, and social science occupations
89,956Law enforcement workers including supervisors
Companies with biggest federal contracts located in this zip code (WILMINGTON, DE):
MASLEY ENTERPRISES INC (2207 CONCORD PIKE PMB 190; small business) : $246,199 in 8 contractsfrom 2002 to 2005
Contracts for Outerwear, Men's, Clothing, Special Purpose, R&D-TEXTILES,CLOTHING,ETC-COMERCLIZ by Army Signed by year:2000: $0; 2001: $0; 2002: $65,510; 2003: $121,399; 2004: $27,800; 2005: $31,490; 2006: $0.
Biggest contracts:
$121,399 with Army for Outerwear, Men's. Signed on 2003-07-14. Completion date: 2003-11-05.
$59,950, same as above.Signed on 2002-12-19. Completion date: 2003-02-10.
$21,500 with Army for Clothing, Special Purpose. Signed on 2004-09-17. Completion date: 2004-11-17.
$16,920 with Army for R&D-TEXTILES,CLOTHING,ETC-COMERCLIZ. Signed on 2005-01-04. Completion date: 2004-10-25.
ROLLINS LEASING CORP (ONE ROLLINS PLAZA) : $149,694 in 3 contractsfrom 1999 to 2002
$61,378 with Air Force for Trucks and Truck Tractors, Wheeled. Taking place in TX. Signed on 2002-02-28. Completion date: 2002-03-01.
$44,158 with Air Force for Lease or Rental of Equipment -- Woodworking Machinery and Equipment. Taking place in TX. Signed on 2000-10-10. Completion date: 2001-09-30.
$44,158 with Air Force for Lease or Rental of Equipment -- Ground Effect Vehicles, Motor Vehicles, Trailers, and Cycles. Taking place in TX. Signed on 1999-10-05. Completion date: 2000-09-30.
PIONEER SCIENTIFIC, INC (208 OAKWOOD ROAD; small business) : $141,450 in 8 contractsfrom 2000 to 2005
Contracts for Chemical Analysis Instruments, Compressors and Vacuum Pumps, Lease or Rental of Equipment -- Instruments and Laboratory Equipment by Army, Air Force Signed by year:2000: $28,250; 2001: $0; 2002: $28,800; 2003: $20,800; 2004: $55,500; 2005: $8,100; 2006: $0.
Biggest contracts:
$28,800 with Army for Chemical Analysis Instruments. Signed on 2002-06-25. Completion date: 2002-08-16.
$28,250 with Army for Compressors and Vacuum Pumps. Signed on 2000-08-09. Completion date: 2000-09-30.
$20,800 with Army for Chemical Analysis Instruments. Signed on 2004-03-23. Completion date: 2004-05-10.
$20,800, same as above.Signed on 2003-02-11. Completion date: 2003-04-15.
ROLLINS TRUCK LEASING CORP (2200 CONCORD PIKE) : $111,256 in 7 contractsfrom 2000 to 2006
Contracts for Motor Charter for Things, Lease or Rental of Equipment -- Ground Effect Vehicles, Motor Vehicles, Trailers, and Cycles by Army, Department of Veterans Affairs, Air Force Signed by year:2000: $40,230; 2001: $0; 2002: $0; 2003: $57,924; 2004: $0; 2005: $18,849; 2006: -$5,747.
Biggest contracts:
$40,230 with Army for Motor Charter for Things. Taking place in TX. Signed on 2000-01-06. Completion date: 2000-09-30.
$39,720 with Department of Veterans Affairs for Lease or Rental of Equipment -- Ground Effect Vehicles, Motor Vehicles, Trailers, and Cycles. Taking place in TX. Signed on 2003-10-01. Completion date: 2004-06-30.
$18,204 with Army for Lease or Rental of Equipment -- Ground Effect Vehicles, Motor Vehicles, Trailers, and Cycles. Taking place in TX. Signed on 2003-09-17. Completion date: 2004-09-30.
$12,849, same as above.Signed on 2005-02-18. Completion date: 2005-02-18.
SCHLEGEL ASSOCIATES INC (6 PALOMINO CT; small business) : $110,860 in 4 contractsfrom 2002 to 2004
$42,000 with Navy for Chemical Analysis Instruments. Signed on 2002-06-28. Completion date: 2002-07-30.
$30,190 with Army for Liquid and Gas Flow, Liquid Level, and Mechanical Motion Measuring Instruments. Signed on 2004-09-19. Completion date: 2004-10-21.
$25,390, same as above.Signed on 2004-09-17. Completion date: 2004-10-22.
$13,280 with Army for Combination and Miscellaneous Instruments. Signed on 2004-09-27. Completion date: 2004-10-25.
JONAS INC (1113 FAUN RD; small business)
$100,000 with Army for Water Pollution -- Applied Research and Exploratory Development (R&D). Signed on 2005-02-15. Completion date: 2005-08-15.
PIONEER EDC, INC (2115A CONCORD PIKE, SUITE; small business) : $87,110 in 2 contractsfrom 1999 to 2002
$65,360 with Navy for Maintenance, Repair and Rebuilding of Equipment -- Medical, Dental, and Veterinary Equipment and Supplies. Signed on 1999-12-30. Completion date: 2000-12-15.
$21,750 with Army for Laboratory Equipment and Supplies. Signed on 2002-02-21. Completion date: 2002-03-30.
STATE LINE MACHINE INC (200 OWENSBY DR; small business) : $86,077 in 8 contractsfrom 2004 to 2006
Contracts for Services -- Operational Systems Development (R&D), Maintenance, Repair and Rebuilding of Equipment -- Engines, Turbines, and Components, Maintenance, Repair or Alteration of Real Property -- Dredging, Ground Effect Vehicles, and moreby Army, U.S. Army Corps of Engineers - civil program financing only Signed by year:2000: $0; 2001: $0; 2002: $0; 2003: $0; 2004: $11,157; 2005: $30,603; 2006: $44,317.
Biggest contracts:
$24,999 with Army for Services -- Operational Systems Development (R&D). Signed on 2006-03-24. Completion date: 2006-02-28.
$14,912 with Army for Maintenance, Repair and Rebuilding of Equipment -- Engines, Turbines, and Components. Signed on 2006-02-06. Completion date: 2006-02-01.
$13,530 with Army for Maintenance, Repair or Alteration of Real Property -- Dredging. Taking place in PA. Signed on 2005-09-28. Completion date: 2005-09-26.
$13,530 with U.S. Army Corps of Engineers - civil program financing only for Maintenance, Repair or Alteration of Real Property -- Dredging. Taking place in PA. Signed on 2005-09-28. Completion date: 2005-09-26.
NEMOURS FOUNDATION (1600 ROCKLAND)
$4,500 with Army for Evaluation and Screening. Taking place in MD. Signed on 2005-12-02. Completion date: 2006-03-06.
R M I S S INC (4425 SIMON RD; small business)
$3,898 with Army for Other Professional Services. Taking place in MD. Signed on 2005-09-28. Completion date: 2004-11-30.
Top industries in this zip code by the number of employees in 2005:
Health Care and Social Assistance: General Medical and Surgical Hospitals (over 1000: 1)
Health Care and Social Assistance: Offices of Physicians (except Mental Health Specialists) (500-999: 1, 50-99: 2, 20-49: 1, 10-19: 4, 5-9: 8, 1-4: 14)
Management of Companies and Enterprises: Offices of Other Holding Companies (20-49: 1, 5-9: 3, 1-4: 293)
Professional, Scientific, and Technical Services: Administrative Management and General Management Consulting Services (250-499: 1, 100-249: 1, 10-19: 1, 5-9: 2, 1-4: 8)
2002 - 2018 National Fire Incident Reporting System (NFIRS) incidents
Based on the data from the years 2002 - 2018 the average number of fires per year is 142. The highest number of reported fires - 194 took place in 2010, and the least - 16 in 2002. The data has an increasing trend.
When looking into fire subcategories, the most incidents belonged to: Structure Fires (57.1%), and Outside Fires (22.8%).
Fire incident types reported to NFIRS in Zip Code 19803


 Nearest zip codes: 19732, 19810, 19806, 19710, 19802, 19735.


 Based on the data from the years 2002 - 2018 the average number of fires per year is 142. The highest number of reported fires - 194 took place in 2010, and the least - 16 in 2002. The data has an increasing trend.
 When looking into fire subcategories, the most incidents belonged to: Structure Fires (57.1%), and Outside Fires (22.8%).