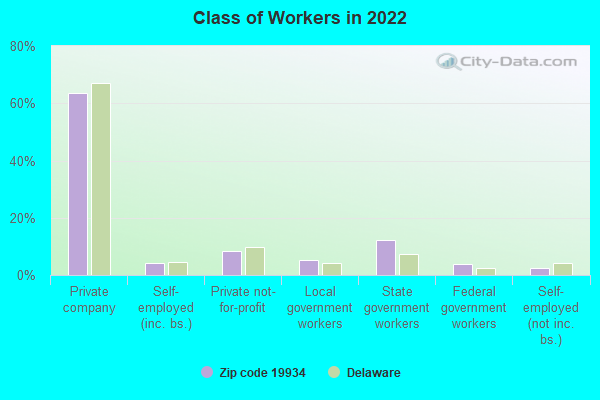
Estimated zip code population in 2022: 14,928 Zip code population in 2010: 12,805 Zip code population in 2000: 9,573
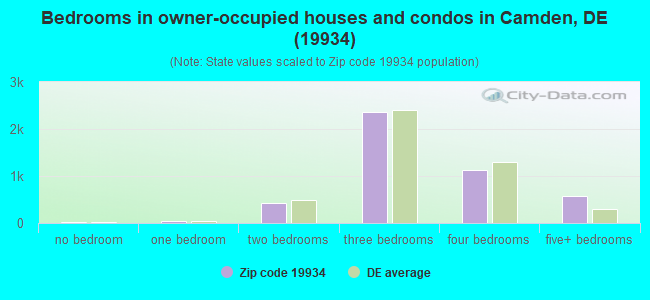
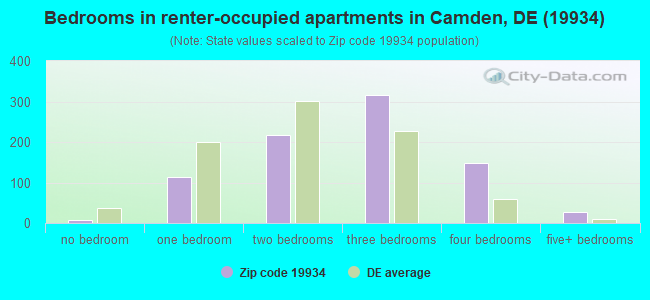
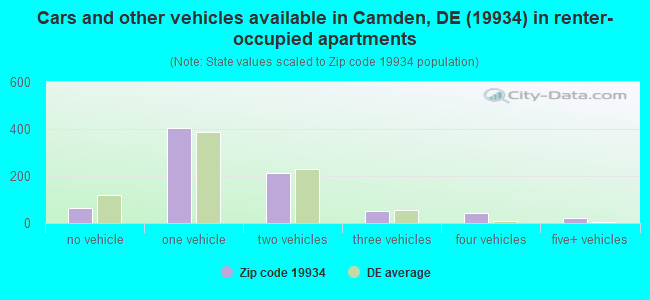
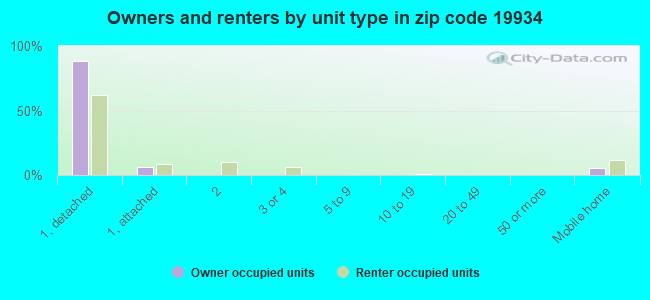
Houses and condos: 5,620 Renter-occupied apartments: 830
% of renters here:
16%
State:
26%
March 2022 cost of living index in zip code 19934: 91.4 (less than average, U.S. average is 100)
Land area: 43.8 sq. mi. Water area: 0.0 sq. mi.
Population density: 341 people per square mile
(very low).
OSM Map
General Map
Google Map
MSN Map
OSM Map
General Map
Google Map
MSN Map
OSM Map
General Map
Google Map
MSN Map
OSM Map
General Map
Google Map
MSN Map
Please wait while loading the map...
Real estate property taxes paid for housing units in 2022:
This zip code:
0.4% ($1,361)
Delaware:
0.5% ($1,635)
Median real estate property taxes paid for housing units with mortgages in 2022: $1,542 (0.5%) Median real estate property taxes paid for housing units with no mortgage in 2022: $1,164 (0.4%)
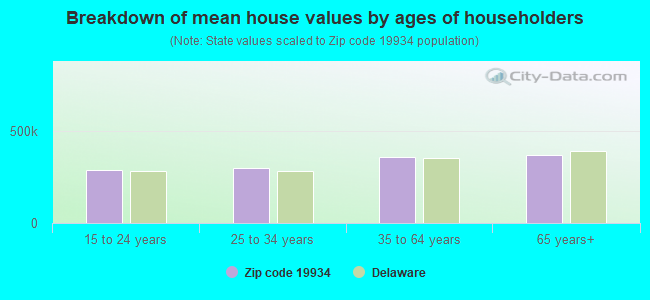
Estimated median house/condo value in 2022: $320,296
19934:
$320,296
Delaware:
$337,200
According to our research of Delaware and other state lists, there were 41 registered sex offenders living in 19934 zip code as of April 27, 2024. The ratio of all residents to sex offenders in zip code 19934 is 336 to 1. The ratio of registered sex offenders to all residents in this zip code is near the state average.
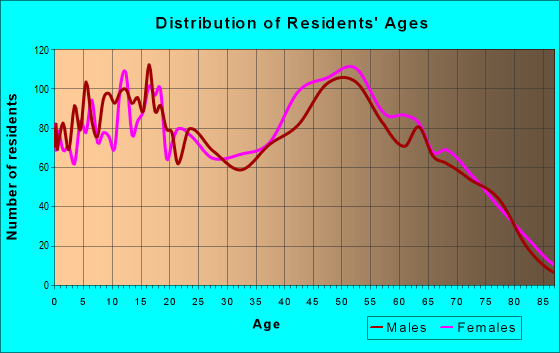
Median resident age:
This zip code:
39.0 years
Delaware median age:
41.5 years
Average household size:
This zip code:
2.8 people
Delaware:
2.5 people
Averages for the 2020 tax year for zip code 19934, filed in 2021:
Average Adjusted Gross Income (AGI) in 2020: $71,931 (Individual Income Tax Returns)
Here:
$71,931
State:
$74,239
Salary/wage: $59,980 (reported on 79.3% of returns)
Here:
$59,980
State:
$59,982
(% of AGI for various income ranges: 1109.9% for AGIs below $25k, 3366.6% for AGIs $25k-50k, 6028.3% for AGIs $50k-75k, 9071.6% for AGIs $75k-100k, 16953.2% for AGIs $100k-200k, 80621.0% for AGIs over 200k)
Taxable interest for individuals: $1,535 (reported on 29.3% of returns)
This zip code:
$1,535
Delaware:
$1,604
(% of AGI for various income ranges: 14.0% for AGIs below $25k, 21.8% for AGIs $25k-50k, 58.3% for AGIs $50k-75k, 98.9% for AGIs $75k-100k, 135.2% for AGIs $100k-200k, 938.0% for AGIs over 200k)
Ordinary dividends: $4,205 (reported on 18.6% of returns)
Here:
$4,205
State:
$8,303
(% of AGI for various income ranges: 20.7% for AGIs below $25k, 28.6% for AGIs $25k-50k, 66.3% for AGIs $50k-75k, 165.1% for AGIs $75k-100k, 225.2% for AGIs $100k-200k, 2177.0% for AGIs over 200k)
Net capital gain/loss in AGI: +$11,754 (reported on 15.9% of returns)
Here:
+$11,754
State:
+$19,461
(% of AGI for various income ranges: 8.5% for AGIs below $25k, 26.7% for AGIs $25k-50k, 71.3% for AGIs $50k-75k, 107.1% for AGIs $75k-100k, 423.7% for AGIs $100k-200k, 9090.0% for AGIs over 200k)
Profit/loss from business: +$14,553 (reported on 13.8% of returns)
Here:
+$14,553
State:
+$13,079
(% of AGI for various income ranges: 87.0% for AGIs below $25k, 103.4% for AGIs $25k-50k, 196.9% for AGIs $50k-75k, 386.9% for AGIs $75k-100k, 788.1% for AGIs $100k-200k, 3308.0% for AGIs over 200k)
Taxable individual retirement arrangement distribution: $18,620 (reported on 9.9% of returns)
19934:
$18,620
Delaware:
$22,095
(% of AGI for various income ranges: 52.3% for AGIs below $25k, 87.7% for AGIs $25k-50k, 213.5% for AGIs $50k-75k, 377.8% for AGIs $75k-100k, 675.2% for AGIs $100k-200k, 3453.0% for AGIs over 200k)
Self-employed (Keogh) retirement plans: $25,700 (reported on 0.3% of returns)
19934:
$25,700
Delaware:
$28,197
(% of AGI for various income ranges: 81.6% for AGIs $100k-200k)
Total itemized deductions: $30,000 (reported on 9.0% of returns)
Here:
$30,000
State:
$30,452
(% of AGI for various income ranges: 38.9% for AGIs below $25k, 89.0% for AGIs $25k-50k, 311.2% for AGIs $50k-75k, 486.9% for AGIs $75k-100k, 1012.1% for AGIs $100k-200k, 6457.0% for AGIs over 200k)
Charity contributions: $10,200 (reported on 7.0% of returns)
Here:
$10,200
State:
$8,999
(% of AGI for various income ranges: 15.6% for AGIs $25k-50k, 51.7% for AGIs $50k-75k, 98.7% for AGIs $75k-100k, 256.7% for AGIs $100k-200k, 2431.0% for AGIs over 200k)
Taxes paid: $7,161 (reported on 8.7% of returns)
19934:
$7,161
State:
$7,483
(% of AGI for various income ranges: 4.0% for AGIs below $25k, 13.3% for AGIs $25k-50k, 60.7% for AGIs $50k-75k, 124.7% for AGIs $75k-100k, 273.0% for AGIs $100k-200k, 1457.0% for AGIs over 200k)
Earned income credit: $2,189 (reported on 13.9% of returns)
Here:
$2,189
State:
$2,247
(% of AGI for various income ranges: 80.1% for AGIs below $25k, 67.9% for AGIs $25k-50k)
Percentage of individuals using paid preparers for their 2020 taxes: 91.8%
Here:
92%
State:
92%
(% for various income ranges: 90.6% for AGIs below $25k, 93.7% for AGIs $25k-50k, 91.8% for AGIs $50k-75k, 90.5% for AGIs $75k-100k, 90.5% for AGIs $100k-200k, 96.9% for AGIs over 200k)
Averages for the 2012 tax year for zip code 19934, filed in 2013:
Average Adjusted Gross Income (AGI) in 2012: $60,500 (Individual Income Tax Returns)
Here:
$60,500
State:
$61,157
Salary/wage: $52,052 (reported on 80.9% of returns)
Here:
$52,052
State:
$50,642
(% of AGI for various income ranges: 71.3% for AGIs below $25k, 70.0% for AGIs $25k-50k, 66.3% for AGIs $50k-75k, 70.3% for AGIs $75k-100k, 73.9% for AGIs $100k-200k, 64.8% for AGIs over 200k)
Taxable interest for individuals: $1,179 (reported on 38.3% of returns)
This zip code:
$1,179
Delaware:
$1,571
(% of AGI for various income ranges: 1.0% for AGIs below $25k, 0.9% for AGIs $25k-50k, 0.8% for AGIs $50k-75k, 0.6% for AGIs $75k-100k, 0.5% for AGIs $100k-200k, 0.9% for AGIs over 200k)
Ordinary dividends: $2,893 (reported on 21.7% of returns)
Here:
$2,893
State:
$6,610
(% of AGI for various income ranges: 1.0% for AGIs below $25k, 0.9% for AGIs $25k-50k, 1.0% for AGIs $50k-75k, 0.9% for AGIs $75k-100k, 0.7% for AGIs $100k-200k, 1.8% for AGIs over 200k)
Net capital gain/loss in AGI: +$4,995 (reported on 14.2% of returns)
Here:
+$4,995
State:
+$11,439
(% of AGI for various income ranges: 0.3% for AGIs $25k-50k, 0.2% for AGIs $50k-75k, 0.4% for AGIs $75k-100k, 1.0% for AGIs $100k-200k, 3.9% for AGIs over 200k)
Profit/loss from business: +$12,880 (reported on 13.4% of returns)
Here:
+$12,880
State:
+$12,773
(% of AGI for various income ranges: 5.9% for AGIs below $25k, 4.0% for AGIs $25k-50k, 2.1% for AGIs $50k-75k, 1.7% for AGIs $75k-100k, 1.9% for AGIs $100k-200k, 3.5% for AGIs over 200k)
Taxable individual retirement arrangement distribution: $12,513 (reported on 11.1% of returns)
19934:
$12,513
Delaware:
$16,790
(% of AGI for various income ranges: 2.9% for AGIs below $25k, 2.6% for AGIs $25k-50k, 2.4% for AGIs $50k-75k, 2.6% for AGIs $75k-100k, 2.1% for AGIs $100k-200k, 1.9% for AGIs over 200k)
Self-employment retirement plans: $23,633 (reported on 0.5% of returns)
19934:
$23,633
Delaware:
$22,611
Total itemized deductions: $22,035 (20% of AGI, reported on 35.3% of returns)
Here:
$22,035
State:
$23,216
Here:
20.1% of AGI
State:
19.8% of AGI
(% of AGI for various income ranges: 7.1% for AGIs below $25k, 10.2% for AGIs $25k-50k, 13.3% for AGIs $50k-75k, 13.6% for AGIs $75k-100k, 15.0% for AGIs $100k-200k, 13.0% for AGIs over 200k)
Charity contributions: $4,007 (reported on 28.0% of returns)
Here:
$4,007
State:
$3,791
(% of AGI for various income ranges: 0.6% for AGIs below $25k, 1.2% for AGIs $25k-50k, 1.8% for AGIs $50k-75k, 1.7% for AGIs $75k-100k, 2.4% for AGIs $100k-200k, 2.2% for AGIs over 200k)
Taxes paid: $6,769 (reported on 35.0% of returns)
19934:
$6,769
State:
$8,129
(% of AGI for various income ranges: 0.8% for AGIs below $25k, 1.7% for AGIs $25k-50k, 2.7% for AGIs $50k-75k, 3.6% for AGIs $75k-100k, 4.7% for AGIs $100k-200k, 6.7% for AGIs over 200k)
Earned income credit: $2,093 (reported on 14.7% of returns)
Here:
$2,093
State:
$2,231
(% of AGI for various income ranges: 5.2% for AGIs below $25k, 0.9% for AGIs $25k-50k)
Percentage of individuals using paid preparers for their 2012 taxes: 47.9%
Here:
48%
State:
47%
(% for various income ranges: 40.7% for AGIs below $25k, 45.8% for AGIs $25k-50k, 51.1% for AGIs $50k-75k, 52.5% for AGIs $75k-100k, 55.6% for AGIs $100k-200k, 80.0% for AGIs over 200k)
Averages for the 2004 tax year for zip code 19934, filed in 2005:
Average Adjusted Gross Income (AGI) in 2004: $53,129 (Individual Income Tax Returns)
Here:
$53,129
State:
$54,038
Salary/wage: $44,350 (reported on 85.2% of returns)
Here:
$44,350
State:
$44,625
(% of AGI for various income ranges: 134.5% for AGIs below $10k, 73.9% for AGIs $10k-25k, 75.5% for AGIs $25k-50k, 74.7% for AGIs $50k-75k, 80.8% for AGIs $75k-100k, 62.1% for AGIs over 100k)
Taxable interest for individuals: $1,190 (reported on 48.6% of returns)
This zip code:
$1,190
Delaware:
$1,734
(% of AGI for various income ranges: 8.5% for AGIs below $10k, 1.8% for AGIs $10k-25k, 1.4% for AGIs $25k-50k, 1.2% for AGIs $50k-75k, 0.8% for AGIs $75k-100k, 0.8% for AGIs over 100k)
Taxable dividends: $1,812 (reported on 26.3% of returns)
Here:
$1,812
State:
$5,362
(% of AGI for various income ranges: 2.5% for AGIs below $10k, 1.2% for AGIs $10k-25k, 0.8% for AGIs $25k-50k, 0.8% for AGIs $50k-75k, 0.7% for AGIs $75k-100k, 1.0% for AGIs over 100k)
Net capital gain/loss: +$12,186 (reported on 18.1% of returns)
Here:
+$12,186
State:
+$17,328
(% of AGI for various income ranges: -2.9% for AGIs below $10k, 0.5% for AGIs $10k-25k, 0.4% for AGIs $25k-50k, 1.1% for AGIs $50k-75k, 1.2% for AGIs $75k-100k, 9.0% for AGIs over 100k)
Profit/loss from business: +$16,579 (reported on 13.8% of returns)
Here:
+$16,579
State:
+$12,191
(% of AGI for various income ranges: -2.0% for AGIs below $10k, 3.3% for AGIs $10k-25k, 3.7% for AGIs $25k-50k, 3.6% for AGIs $50k-75k, 2.3% for AGIs $75k-100k, 6.0% for AGIs over 100k)
IRA payment deduction: $3,096 (reported on 2.6% of returns)
19934:
$3,096
Delaware:
$3,027
(% of AGI for various income ranges: 0.1% for AGIs $10k-25k, 0.3% for AGIs $25k-50k, 0.2% for AGIs $50k-75k, 0.2% for AGIs $75k-100k, 0.1% for AGIs over 100k)
Self-employed pension: $10,378 (reported on 0.9% of returns)
Here:
$10,378
Delaware:
$15,466
Total itemized deductions: $18,697 (19% of AGI, reported on 35.5% of returns)
Here:
$18,697
State:
$19,441
Here:
18.8% of AGI
State:
19.3% of AGI
(% of AGI for various income ranges: 7.3% for AGIs below $10k, 6.4% for AGIs $10k-25k, 11.2% for AGIs $25k-50k, 12.7% for AGIs $50k-75k, 14.9% for AGIs $75k-100k, 13.2% for AGIs over 100k)
Charity contributions deductions: $3,795 (4% of AGI, reported on 31.1% of returns)
Here:
$3,795
State:
$3,727
Here:
3.6% of AGI
State:
3.5% of AGI
(% of AGI for various income ranges: 0.7% for AGIs $10k-25k, 1.5% for AGIs $25k-50k, 1.8% for AGIs $50k-75k, 2.2% for AGIs $75k-100k, 3.0% for AGIs over 100k)
Total tax: $8,521 (reported on 78.1% of returns)
19934:
$8,521
State:
$8,958
(% of AGI for various income ranges: 3.2% for AGIs below $10k, 4.0% for AGIs $10k-25k, 6.7% for AGIs $25k-50k, 8.6% for AGIs $50k-75k, 10.3% for AGIs $75k-100k, 19.2% for AGIs over 100k)
Earned income credit: $1,574 (reported on 11.4% of returns)
Here:
$1,574
State:
$1,733
Percentage of individuals using paid preparers for their 2004 taxes: 56.5%
Here:
56%
State:
55%
(% for various income ranges: 41.8% for AGIs below $10k, 56.0% for AGIs $10k-25k, 57.4% for AGIs $25k-50k, 62.0% for AGIs $50k-75k, 58.5% for AGIs $75k-100k, 68.9% for AGIs over 100k)
Household received Food Stamps/SNAP in the past 12 months: 627 Household did not receive Food Stamps/SNAP in the past 12 months: 4,644
Women who had a birth in the past 12 months: 133 (102 now married, 33 unmarried) Women who did not have a birth in the past 12 months: 2,837 (1,353 now married, 1,502 unmarried)
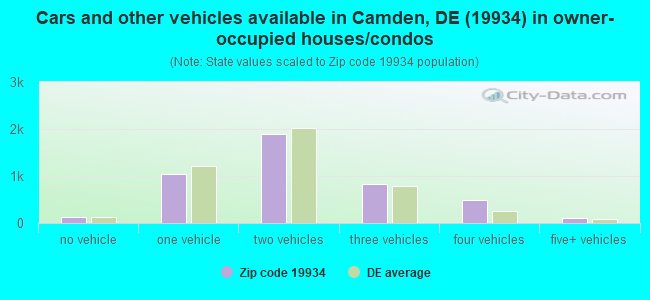
Housing units in zip code 19934 with a mortgage: 2,757 (133 second mortgage, 127 both second mortgage and home equity loan) Houses without a mortgage: 105
Median monthly owner costs for units with a mortgage: $1,590 Median monthly owner costs for units without a mortgage: $437
Residents with income below the poverty level in 2022:
This zip code:
6.7%
Whole state:
9.4%
Residents with income below 50% of the poverty level in 2022:
This zip code:
4.9%
Whole state:
4.6%
Median number of rooms in houses and condos:
Here:
7.3
State:
6.9
Median number of rooms in apartments:
Here:
5.5
State:
4.4
Notable locations in this zip code not listed on our city pages
Notable locations in zip code 19934: Alms House (A), Wild Quail Golf and Country Club (B), Camden - Wyoming Volunteer Fire Company Incorporated (C), Camden Police Department (D), Wyoming Police Department (E), Wyoming Town Hall (F), Harvest Years Senior Center (G), Camden Town Hall (H). Display/hide their locations on the map
Churches in zip code 19934 include: Kingdom Worship Center (A), Bible Fellowship Church (B), Emmanuel Pentecostal Church of God (C), Union Church (D), Willow Grove Church of God (E), Cow Marsh Church (F), Wyoming United Methodist Church (G), Saint Pauls Church (H), Whatcoat United Methodist Church (I). Display/hide their locations on the map
In group quarters: 20 (-1 institutionalized population)
Size of family households: 1,994 2-persons, 675 3-persons, 707 4-persons, 346 5-persons, 238 6-persons, 179 7-or-more-persons
Size of nonfamily households: 1,039 1-person, 123 2-persons
2,218 married couples with children.
584 single-parent households (165 men, 419 women).
86.3% of residents of 19934 zip code speak English at home.
2.8% of residents speak Spanish at home (78% very well, 14% well, 8% not at all).
5.1% of residents speak other Indo-European language at home (54% very well, 46% well).
1.5% of residents speak Asian or Pacific Island language at home (63% very well, 11% well, 27% not well).
4.0% of residents speak other language at home (23% very well, 77% well).
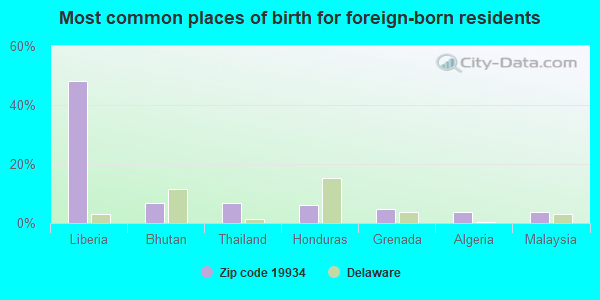
Foreign born population: 1,455 (9.7%) (72.8% of them are naturalized citizens)
This zip code:
9.7%
Whole state:
9.9%
48%Liberia
7%Bhutan
7%Thailand
6%Honduras
5%Grenada
4%Algeria
4%Malaysia
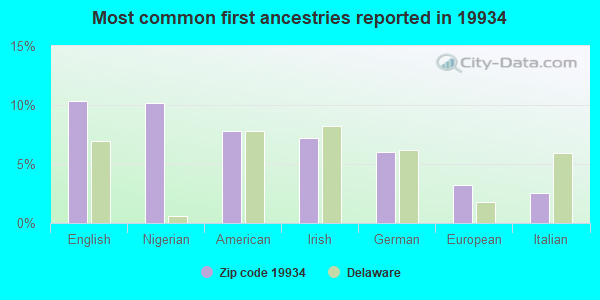
10%English
10%Nigerian
8%American
7%Irish
6%German
3%European
3%Italian
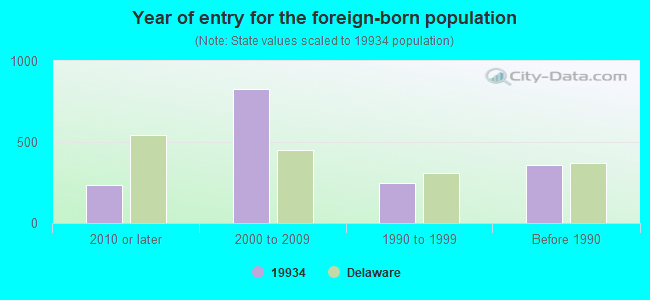
Year of entry for the foreign-born population
2372010 or later
8252000 to 2009
2481990 to 1999
361Before 1990
Major facilities with environmental interests located in this zip code:
CAMDEL METALS CORPORATION (12244 WILLOW GROVE ROAD in CAMDEN, DE)
AIR MAJOR (AIRS/AFS) COMPLIANCE ACTIVITY (Tracking inspections of insecticide, fungicide, and rodenticide, and toxic substances) CRITERIA AND HAZARDOUS AIR POLLUTANT INVENTORY (Inventory of air pollution sources) HAZARDOUS WASTE BIENNIAL REPORTER (Resource Conservation and Recovery Act (tracking hazardous waste)) - ICIS-, ENFORCEMENT/COMPLIANCE ACTIVITY Large Quantity Generators, more that 1000 kg of hazardous waste/month (Resource Conservation and Recovery Act (tracking hazardous waste)) - notification - ICIS-, ENFORCEMENT/COMPLIANCE ACTIVITY TRI REPORTER (Tracking of toxic chemicals releasing facilities) Business SIC classification: STEEL PIPE AND TUBES Business NAICS classification: NONFERROUS METAL (EXCEPT COPPER AND ALUMINUM) ROLLING, DRAWING, AND EXTRUDING. Organizations: CAMDEL METAL CORPORATION (CONTACT/OPERATOR)
, HANDY & HARMAN CORP (CONTACT/OWNER)
Alternative names: CAMDEL METALS (HANDY & HARMAN TUBE CO.)
CAESAR RODNEY HIGH SCHOOL (239 OLD NORTH ROAD in CAMDEN, DE)
(Geographic Names Information System) COMPLIANCE ACTIVITY (Tracking inspections of insecticide, fungicide, and rodenticide, and toxic substances) (National Center for Education Statistics) - STATE ID-626 Conditionally Exempt Small Quantity Generators, less than 100 kg/month of hazardous waste (Resource Conservation and Recovery Act (tracking hazardous waste)) - notification Organizations: CAESAR RODNEY SCHOOL DISTRICT (CONTACT/OWNER)
Alternative names: CAESAR RODNEY S.D, CAESER RODNEY S.D.
ALLEN FREAR ELEMENTARY SCHOOL (238 SORGHUM MILL ROAD in CAMDEN-WYOMING, DE)
(National Center for Education Statistics) - STATE ID-610 Organizations: CAESAR RODNEY SCHOOL DISTRICT (SCHOOL DISTRICT)
COOPERS CORNER SCHOOL (2183 HONEYSUCKLE ROAD in WYOMING, DE)
(Integrated Compliance Information System) - ICIS-03-1989-0523, FORMAL ENFORCEMENT ACTION COMPLIANCE ACTIVITY (Tracking inspections of insecticide, fungicide, and rodenticide, and toxic substances)
F. NIEL POSTLETHWAIT MIDDLE SCHOOL (2841 SOUTH STATE STREET in CAMDEN, DE)
(National Center for Education Statistics) - STATE ID-621 Organizations: CAESAR RODNEY SCHOOL DISTRICT (SCHOOL DISTRICT)
FRED FIFER MIDDLE SCHOOL (109 EAST CAMDEN-WYOMING AVENUE in CAMDEN, DE)
(National Center for Education Statistics) - STATE ID-625 Organizations: CAESAR RODNEY SCHOOL DISTRICT (SCHOOL DISTRICT)
JOHN S. CHARLTON SCHOOL (278 SORGHUM MILL ROAD in CAMDEN-WYOMING, DE)
(National Center for Education Statistics) - STATE ID-630 Organizations: CAESAR RODNEY SCHOOL DISTRICT (SCHOOL DISTRICT)
KENT ELEMENTARY INTENSIVE LEARNING CENTER (5 OLD NORTH ROAD in CAMDEN-WYOMING, DE)
(National Center for Education Statistics) - STATE ID-615 Organizations: CAESAR RODNEY SCHOOL DISTRICT (SCHOOL DISTRICT)
KENT MIDDLE SCHOOL INTENSIVE LEARNING CENTER (278 SORGHUM MILL ROAD in CAMDEN, DE)
(National Center for Education Statistics) - STATE ID-617 Organizations: CAESAR RODNEY SCHOOL DISTRICT (SCHOOL DISTRICT)
OAK POINT SCHOOL (RD#1 BOX 355-B in WYOMING, DE)
(Integrated Compliance Information System) - ICIS-03-1989-0541, FORMAL ENFORCEMENT ACTION COMPLIANCE ACTIVITY (Tracking inspections of insecticide, fungicide, and rodenticide, and toxic substances)
POSITIVE OUTCOME CHARTER SCHOOL (193 S DUPONT HIGHWAY in CAMDEN, DE)
(Integrated Compliance Information System) - ICIS-03-2002-0292, FORMAL ENFORCEMENT ACTION COMPLIANCE ACTIVITY (Tracking inspections of insecticide, fungicide, and rodenticide, and toxic substances) Business SIC classification: ELEMENTARY AND SECONDARY SCHOOLS Alternative names: POSITIVE OUTCOMES CHARTER SCHOOL
POSITIVE OUTCOMES CHARTER SCHOOL (193 SOUTH DUPONT HIGHWAY in CAMDEN, DE)
(National Center for Education Statistics) - STATE ID-570
SOUTHERN MEADOW SCHOOL (RT #1 in WYOMING, DE)
(Integrated Compliance Information System) - ICIS-03-1989-0547, FORMAL ENFORCEMENT ACTION COMPLIANCE ACTIVITY (Tracking inspections of insecticide, fungicide, and rodenticide, and toxic substances)
Housing units lacking complete plumbing facilities: 0.9% Housing units lacking complete kitchen facilities: 0.6%
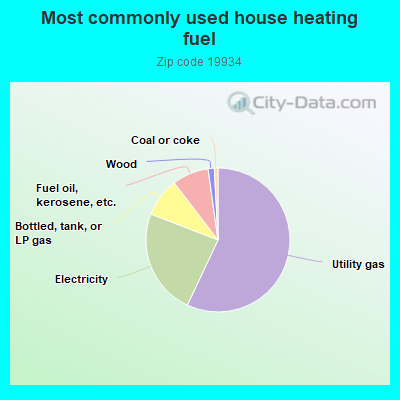
57.0%Utility gas
23.9%Electricity
8.7%Bottled, tank, or LP gas
8.2%Fuel oil, kerosene, etc.
1.4%Wood
0.8%Coal or coke
Population in 1990: 8,877. Population change in the 1990s: +696 (+7.8%).
Place of birth for U.S.-born residents:
This state: 6,143
Northeast: 3,214
Midwest: 689
South: 2,609
West: 464
63% of the 19934 zip code residents lived in the same house 5 years ago. Out of people who lived in different houses, 70% lived in this county. Out of people who lived in different counties, 50% lived in Delaware.
91% of the 19934 zip code residents lived in the same house 1 year ago. Out of people who lived in different houses, 54% moved from this county. Out of people who lived in different houses, 8% moved from different county within same state. Out of people who lived in different houses, 28% moved from different state. Out of people who lived in different houses, 7% moved from abroad.
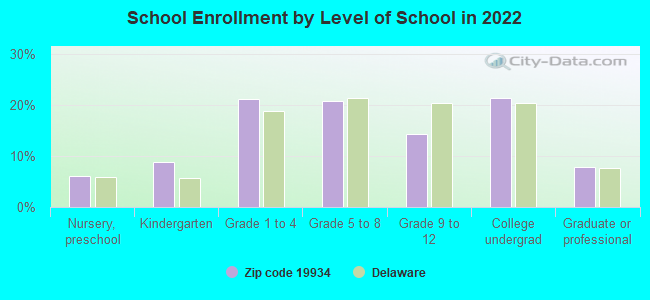
Private vs. public school enrollment:
Students in private schools in grades 1 to 8 (elementary and middle school): 265
Here:
17.6%
Delaware:
11.5%
Students in private schools in grades 9 to 12 (high school): 27
Here:
5.1%
Delaware:
12.1%
Students in private undergraduate colleges: 273
Here:
35.0%
Delaware:
19.2%
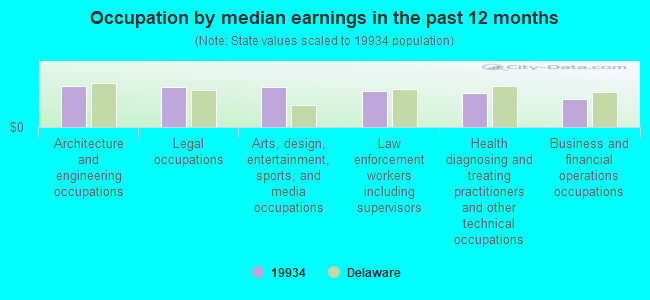
Occupation by median earnings in the past 12 months ($)
96,773Architecture and engineering occupations
95,826Legal occupations
94,219Arts, design, entertainment, sports, and media occupations
84,918Law enforcement workers including supervisors
79,967Health diagnosing and treating practitioners and other technical occupations
66,460Business and financial operations occupations
Companies with biggest federal contracts located in this zip code:
H CONSTRUCTION COMPANY OF DELA (207 S DUPONT HWY in CAMDEN WYOMING, DE; small business) : $804,100 in 17 contractsfrom 2000 to 2006
Contracts for Maintenance, Repair or Alteration of Real Property -- Other Non-Building Facilities, Maintenance, Repair or Alteration of Real Property -- Office Buildings, Maintenance, Repair or Alteration of Real Property -- Hospitals and Infirmaries, Prefabricated and Portable Buildings, and moreby Army, Air Force, Department of Veterans Affairs, U.S. Fish and Wildlife Service, and others Signed by year:2000: $57,734; 2001: $0; 2002: $94,753; 2003: $178,124; 2004: $55,165; 2005: $45,481; 2006: $372,843.
Biggest contracts:
$369,880 with Army for Maintenance, Repair or Alteration of Real Property -- Other Non-Building Facilities. Signed on 2006-04-04. Completion date: 2006-04-10.
$93,124 with Air Force for Maintenance, Repair or Alteration of Real Property -- Office Buildings. Signed on 2003-02-28. Completion date: 2003-04-25.
$85,000 with Department of Veterans Affairs for Maintenance, Repair or Alteration of Real Property -- Hospitals and Infirmaries. Signed on 2003-09-15. Completion date: 2003-11-15.
$53,753 with Air Force for Prefabricated and Portable Buildings. Signed on 2002-09-30. Completion date: 2002-12-12.
BURKE EQUIPMENT COMPANY (125 N MAIN ST in CAMDEN WYOMING, DE; small business) : $98,866 in 2 contractsfrom 2002 to 2005
$85,992 with Air Force for Passenger Motor Vehicles. Signed on 2005-09-07. Completion date: 2005-09-29.
$12,874 with Army for Warehouse Trucks and Tractors, Self-Propelled. Signed on 2002-09-26. Completion date: 2002-10-31.
PIPPIN FUNERAL HOME (119 W CAMDEN WYOMING AVE in CAMDEN WYOMING, DE; small business) : $97,688 in 3 contractsfrom 2004 to 2005
$75,001 with Air Force for Care of Remains and/or Funeral Services. Signed on 2004-11-23. Completion date: 2008-04-01.
$14,356, same as above.Signed on 2005-09-30. Completion date: 2005-09-30.
$8,331, same as above.Signed on 2005-09-30. Completion date: 2005-09-30.
VINCENT D ABBRESCIA (1019 QUAIL RUN in WYOMING, TX; small business) : $71,315 in 2 contractsfrom 2002 to 2004
$89,930 with Army for Other Medical Services. Taking place in TX. Signed on 2002-08-23. Completion date: 2003-02-19.
-$18,615, same as above.Signed on 2004-02-05. Completion date: 2003-02-19.
WOOTERS, JAMES EXCAVATION CO L (8215 WILLOW GROVE RD in CAMDEN WYOMING, DE; small business)
$42,459 with Air Force for Snow Removal/Salt Service (also spreading aggregate or other snow melting material). Signed on 2003-03-03. Completion date: 2003-03-11.
SINCORP INC (75 FOX HOLE ROAD in CAMDEN WYOMING, DE; small business) : $32,200 in 2 contractsfrom 2000 to 2001
$26,500 with Air Force for Maintenance, Repair or Alteration of Real Property -- Other Administrative Facilities and Service Buildings. Signed on 2000-05-26. Completion date: 2000-09-13.
$5,700 with Air Force for Maintenance, Repair or Alteration of Real Property -- Air Traffic Control Towers. Signed on 2001-02-08. Completion date: 2001-02-19.
WYOMING CONCRETE INDUSTRIES IN (SOUTHERN BLVD RILROAD AVE in CAMDEN WYOMING, DE; small business)
$29,455 with Army for Miscellaneous Construction Materials. Signed on 2001-10-12. Completion date: 2001-10-15.
CURRENT SOLUTIONS, INC (1100 APPLE GROVE SCHOOL RD in WYOMING, DE; small business)
$23,870 with Air Force for Maintenance, Repair or Alteration of Real Property -- Recreational Buildings. Signed on 2002-09-28. Completion date: 2003-01-06.
INTEGRITY SALES AND SERVICE IN (23 COCHRAN RD BLD 3 UT5 in CAMDEN WYOMING, DE; small business)
$15,670 with Air Force for Miscellaneous Service and Trade Equipment. Signed on 2005-09-21. Completion date: 2005-10-21.
DAN WATSON WELDING (1804 MORGANS CHOICE RD in WYOMING, DE; small business)
$8,500 with Air Force for Maintenance, Repair or Alteration of Real Property -- Other Industrial Buildings. Signed on 2001-06-28. Completion date: 2001-06-26.
Top industries in this zip code by the number of employees in 2005:
Health Care and Social Assistance: Home Health Care Services (100-249 employees: 1 establishment)
2002 - 2018 National Fire Incident Reporting System (NFIRS) incidents
According to the data from the years 2002 - 2018 the average number of fires per year is 31. The highest number of fire incidents - 66 took place in 2002, and the least - 14 in 2013. The data has a decreasing trend.
When looking into fire subcategories, the most incidents belonged to: Structure Fires (48.4%), and Outside Fires (29.9%).
Fire incident types reported to NFIRS in Zip Code 19934
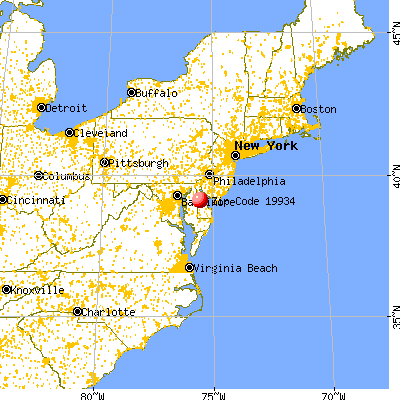


 Nearest zip codes: 19979, 19943, 19964, 19953, 19904, 19962.


 According to the data from the years 2002 - 2018 the average number of fires per year is 31. The highest number of fire incidents - 66 took place in 2002, and the least - 14 in 2013. The data has a decreasing trend.
 When looking into fire subcategories, the most incidents belonged to: Structure Fires (48.4%), and Outside Fires (29.9%).