Estimated zip code population in 2022: 3,186 Zip code population in 2010: 2,522 Zip code population in 2000: 2,137
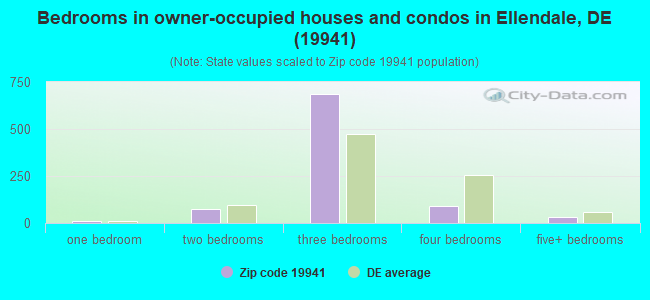
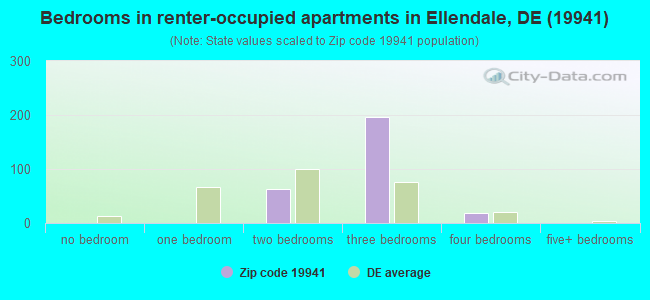
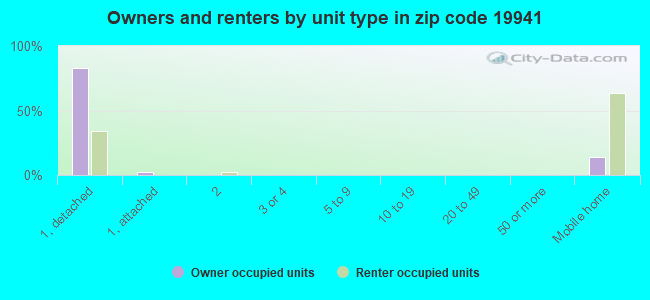
Houses and condos: 1,286 Renter-occupied apartments: 282
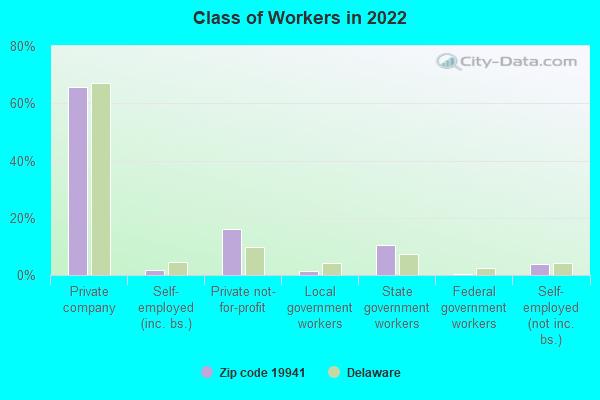
% of renters here:
24%
State:
26%
March 2022 cost of living index in zip code 19941: 83.9 (less than average, U.S. average is 100)
Land area: 33.6 sq. mi. Water area: 0.1 sq. mi.
Population density: 95 people per square mile
(very low).
OSM Map
General Map
Google Map
MSN Map
OSM Map
General Map
Google Map
MSN Map
OSM Map
General Map
Google Map
MSN Map
OSM Map
General Map
Google Map
MSN Map
Please wait while loading the map...
Real estate property taxes paid for housing units in 2022:
This zip code:
0.4% ($890)
Delaware:
0.5% ($1,635)
Median real estate property taxes paid for housing units with mortgages in 2022: $884 (0.4%) Median real estate property taxes paid for housing units with no mortgage in 2022: $912 (0.4%)
Business Search- 14 Million verified businesses
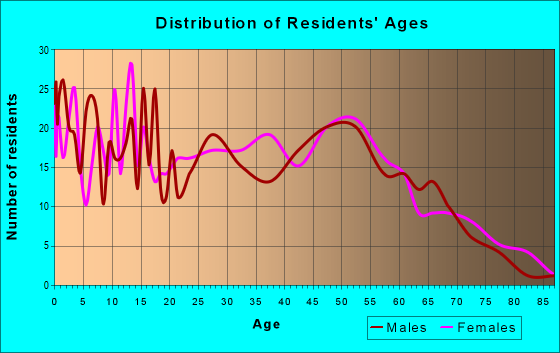
Males: 1,570
(49.3%)
Females: 1,616
(50.7%)
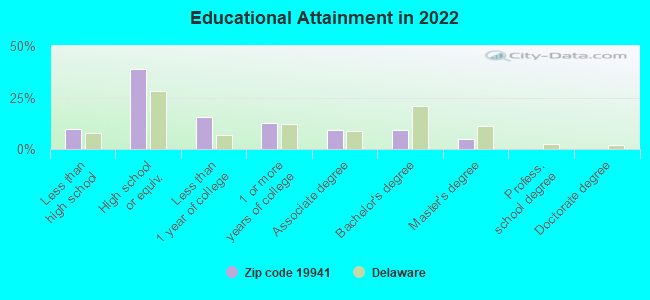
For population 25 years and over in 19941:
High school or higher: 89.2%
Bachelor's degree or higher: 13.8%
Graduate or professional degree: 4.6%
Unemployed: 3.6%
Mean travel time to work (commute): 28.4 minutes
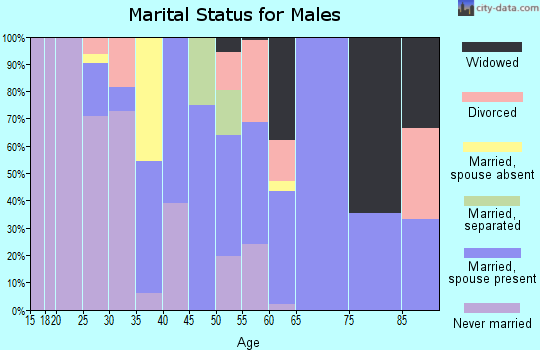
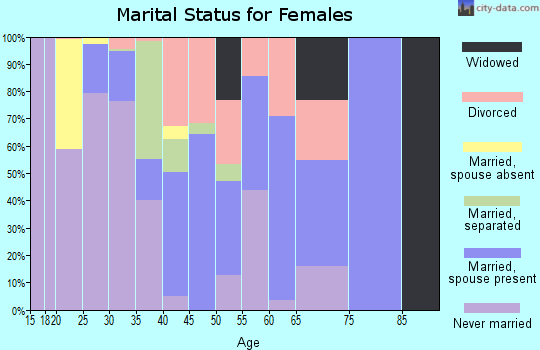
For population 15 years and over in 19941:
Never married: 31.0%
Now married: 47.5%
Separated: 2.5%
Widowed: 5.6%
Divorced: 13.4%
Zip code 19941 compared to state average:
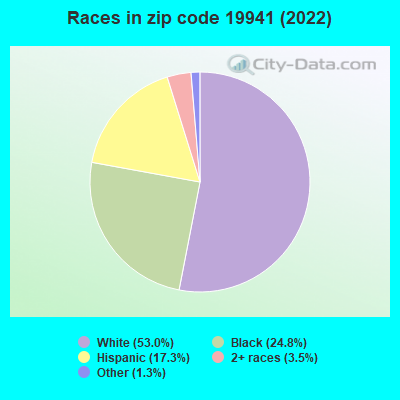
Hispanic race population percentage above state average.
Median age below state average.
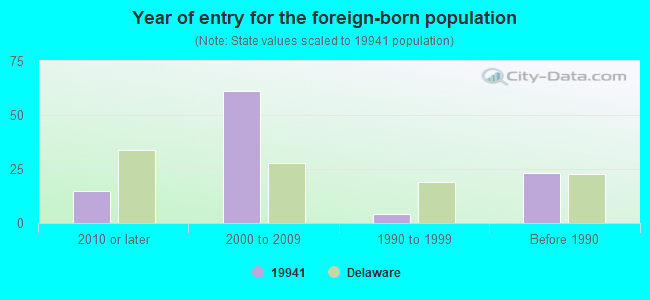
Foreign-born population percentage significantly below state average.
Length of stay since moving in above state average.
House age below state average.
Number of college students below state average.
Percentage of population with a bachelor's degree or higher significantly below state average.
Averages for the 2020 tax year for zip code 19941, filed in 2021:
Average Adjusted Gross Income (AGI) in 2020: $44,584 (Individual Income Tax Returns)
Here:
$44,584
State:
$74,239
Salary/wage: $39,955 (reported on 84.4% of returns)
Here:
$39,955
State:
$59,982
(% of AGI for various income ranges: 1231.4% for AGIs below $25k, 3558.3% for AGIs $25k-50k, 6713.1% for AGIs $50k-75k, 8861.2% for AGIs $75k-100k, 19375.0% for AGIs $100k-200k)
Taxable interest for individuals: $654 (reported on 16.3% of returns)
This zip code:
$654
Delaware:
$1,604
(% of AGI for various income ranges: 9.5% for AGIs below $25k, 4.7% for AGIs $25k-50k, 26.9% for AGIs $50k-75k, 3.8% for AGIs $75k-100k, 75.0% for AGIs $100k-200k)
Ordinary dividends: $2,450 (reported on 8.2% of returns)
Here:
$2,450
State:
$8,303
(% of AGI for various income ranges: 19.8% for AGIs below $25k, 23.9% for AGIs $25k-50k, 76.2% for AGIs $75k-100k, 75.0% for AGIs $100k-200k)
Net capital gain/loss in AGI: +$2,831 (reported on 8.8% of returns)
Here:
+$2,831
State:
+$19,461
(% of AGI for various income ranges: 9.3% for AGIs below $25k, 26.4% for AGIs $25k-50k, 42.3% for AGIs $50k-75k, 221.2% for AGIs $100k-200k)
Profit/loss from business: +$8,528 (reported on 12.2% of returns)
Here:
+$8,528
State:
+$13,079
(% of AGI for various income ranges: 142.7% for AGIs below $25k, 116.1% for AGIs $25k-50k, 266.9% for AGIs $50k-75k, 177.5% for AGIs $75k-100k)
Taxable individual retirement arrangement distribution: $16,370 (reported on 6.8% of returns)
19941:
$16,370
Delaware:
$22,095
(% of AGI for various income ranges: 63.0% for AGIs below $25k, 402.3% for AGIs $50k-75k, 1046.2% for AGIs $100k-200k)
Total itemized deductions: $21,380 (reported on 3.4% of returns)
Here:
$21,380
State:
$30,452
(% of AGI for various income ranges: 106.9% for AGIs $25k-50k, 855.0% for AGIs $75k-100k)
Charity contributions: $6,133 (reported on 2.0% of returns)
Here:
$6,133
State:
$8,999
(% of AGI for various income ranges: 230.0% for AGIs $75k-100k)
Taxes paid: $5,320 (reported on 3.4% of returns)
19941:
$5,320
State:
$7,483
(% of AGI for various income ranges: 18.3% for AGIs $25k-50k, 250.0% for AGIs $75k-100k)
Earned income credit: $2,457 (reported on 23.8% of returns)
Here:
$2,457
State:
$2,247
(% of AGI for various income ranges: 113.6% for AGIs below $25k, 100.0% for AGIs $25k-50k)
Percentage of individuals using paid preparers for their 2020 taxes: 93.2%
Here:
93%
State:
92%
(% for various income ranges: 91.5% for AGIs below $25k, 95.5% for AGIs $25k-50k, 94.4% for AGIs $50k-75k, 90.9% for AGIs $75k-100k, 93.3% for AGIs $100k-200k)
Averages for the 2012 tax year for zip code 19941, filed in 2013:
Average Adjusted Gross Income (AGI) in 2012: $36,459 (Individual Income Tax Returns)
Here:
$36,459
State:
$61,157
Salary/wage: $31,321 (reported on 87.4% of returns)
Here:
$31,321
State:
$50,642
(% of AGI for various income ranges: 79.1% for AGIs below $25k, 81.7% for AGIs $25k-50k, 80.2% for AGIs $50k-75k, 77.1% for AGIs $75k-100k, 58.7% for AGIs $100k-200k)
Taxable interest for individuals: $616 (reported on 17.1% of returns)
This zip code:
$616
Delaware:
$1,571
(% of AGI for various income ranges: 0.5% for AGIs below $25k, 0.3% for AGIs $25k-50k, 0.2% for AGIs $50k-75k, 0.3% for AGIs $100k-200k)
Ordinary dividends: $2,444 (reported on 8.1% of returns)
Here:
$2,444
State:
$6,610
Profit/loss from business: +$8,727 (reported on 13.5% of returns)
Here:
+$8,727
State:
+$12,773
(% of AGI for various income ranges: 5.8% for AGIs below $25k, 6.4% for AGIs $25k-50k, 4.1% for AGIs $75k-100k)
Taxable individual retirement arrangement distribution: $9,214 (reported on 6.3% of returns)
19941:
$9,214
Delaware:
$16,790
Total itemized deductions: $16,061 (23% of AGI, reported on 20.7% of returns)
Here:
$16,061
State:
$23,216
Here:
22.6% of AGI
State:
19.8% of AGI
(% of AGI for various income ranges: 4.5% for AGIs below $25k, 6.9% for AGIs $25k-50k, 13.2% for AGIs $50k-75k, 11.8% for AGIs $75k-100k, 10.3% for AGIs $100k-200k)
Charity contributions: $3,440 (reported on 13.5% of returns)
Here:
$3,440
State:
$3,791
(% of AGI for various income ranges: 1.2% for AGIs $25k-50k, 1.7% for AGIs $50k-75k, 1.5% for AGIs $75k-100k, 1.8% for AGIs $100k-200k)
Taxes paid: $3,961 (reported on 20.7% of returns)
19941:
$3,961
State:
$8,129
(% of AGI for various income ranges: 0.3% for AGIs below $25k, 1.5% for AGIs $25k-50k, 2.7% for AGIs $50k-75k, 2.7% for AGIs $75k-100k, 4.1% for AGIs $100k-200k)
Earned income credit: $2,483 (reported on 31.5% of returns)
Here:
$2,483
State:
$2,231
(% of AGI for various income ranges: 10.0% for AGIs below $25k, 1.5% for AGIs $25k-50k)
Percentage of individuals using paid preparers for their 2012 taxes: 44.1%
Here:
44%
State:
47%
(% for various income ranges: 38.9% for AGIs below $25k, 41.9% for AGIs $25k-50k, 50.0% for AGIs $50k-75k, 50.0% for AGIs $75k-100k, 83.3% for AGIs $100k-200k)
Averages for the 2004 tax year for zip code 19941, filed in 2005:
Average Adjusted Gross Income (AGI) in 2004: $29,662 (Individual Income Tax Returns)
Here:
$29,662
State:
$54,038
Salary/wage: $26,922 (reported on 89.3% of returns)
Here:
$26,922
State:
$44,625
(% of AGI for various income ranges: 86.2% for AGIs below $10k, 84.2% for AGIs $10k-25k, 84.4% for AGIs $25k-50k, 82.0% for AGIs $50k-75k, 78.3% for AGIs $75k-100k, 63.3% for AGIs over 100k)
Taxable interest for individuals: $962 (reported on 22.9% of returns)
This zip code:
$962
Delaware:
$1,734
(% of AGI for various income ranges: 0.7% for AGIs below $10k, 1.4% for AGIs $10k-25k, 0.7% for AGIs $25k-50k, 0.5% for AGIs $50k-75k, 0.2% for AGIs $75k-100k, 0.7% for AGIs over 100k)
Taxable dividends: $1,687 (reported on 9.5% of returns)
Here:
$1,687
State:
$5,362
(% of AGI for various income ranges: 0.3% for AGIs $10k-25k, 0.5% for AGIs $25k-50k, 0.3% for AGIs $50k-75k, 2.2% for AGIs $75k-100k)
Net capital gain/loss: +$7,697 (reported on 6.4% of returns)
Here:
+$7,697
State:
+$17,328
(% of AGI for various income ranges: -0.3% for AGIs $10k-25k, 0.4% for AGIs $25k-50k, 2.4% for AGIs $50k-75k, 10.6% for AGIs over 100k)
Profit/loss from business: +$7,669 (reported on 12.2% of returns)
Here:
+$7,669
State:
+$12,191
(% of AGI for various income ranges: 6.2% for AGIs below $10k, 5.8% for AGIs $10k-25k, 3.9% for AGIs $25k-50k, 2.2% for AGIs $50k-75k, 0.4% for AGIs $75k-100k)
Total itemized deductions: $15,034 (25% of AGI, reported on 16.8% of returns)
Here:
$15,034
State:
$19,441
Here:
25.4% of AGI
State:
19.3% of AGI
(% of AGI for various income ranges: 2.8% for AGIs $10k-25k, 8.5% for AGIs $25k-50k, 11.7% for AGIs $50k-75k, 8.4% for AGIs $75k-100k, 16.0% for AGIs over 100k)
Charity contributions deductions: $2,726 (4% of AGI, reported on 13.0% of returns)
Here:
$2,726
State:
$3,727
Here:
4.4% of AGI
State:
3.5% of AGI
(% of AGI for various income ranges: 0.5% for AGIs below $10k, 1.1% for AGIs $25k-50k, 2.3% for AGIs $50k-75k, 1.1% for AGIs $75k-100k, 1.8% for AGIs over 100k)
Total tax: $3,498 (reported on 63.2% of returns)
19941:
$3,498
State:
$8,958
(% of AGI for various income ranges: 1.8% for AGIs below $10k, 3.8% for AGIs $10k-25k, 5.8% for AGIs $25k-50k, 8.9% for AGIs $50k-75k, 11.4% for AGIs $75k-100k, 14.0% for AGIs over 100k)
Earned income credit: $1,858 (reported on 29.1% of returns)
Here:
$1,858
State:
$1,733
Percentage of individuals using paid preparers for their 2004 taxes: 57.2%
Here:
57%
State:
55%
(% for various income ranges: 44.7% for AGIs below $10k, 61.3% for AGIs $10k-25k, 61.2% for AGIs $25k-50k, 60.4% for AGIs $50k-75k, 60.9% for AGIs $75k-100k, 60.9% for AGIs over 100k)
Household received Food Stamps/SNAP in the past 12 months: 307 Household did not receive Food Stamps/SNAP in the past 12 months: 863
Women who had a birth in the past 12 months: 122 (62 now married, 56 unmarried) Women who did not have a birth in the past 12 months: 498 (146 now married, 348 unmarried)
Housing units in zip code 19941 with a mortgage: 635 (64 second mortgage, 14 home equity loan, 51 both second mortgage and home equity loan) Houses without a mortgage: 13
Median monthly owner costs for units with a mortgage: $1,100 Median monthly owner costs for units without a mortgage: $348
Residents with income below the poverty level in 2022:
This zip code:
17.5%
Whole state:
9.4%
Residents with income below 50% of the poverty level in 2022:
This zip code:
8.5%
Whole state:
4.6%
Median number of rooms in houses and condos:
Here:
6.2
State:
6.9
Median number of rooms in apartments:
Here:
5.8
State:
4.4
Notable locations in this zip code not listed on our city pages
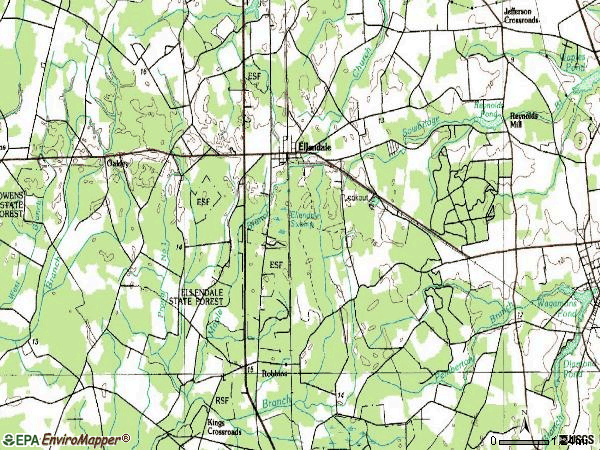
Notable locations in zip code 19941: Kent - Sussex Detoxification Center (A), Ellendale Police Department (B), Ellendale Town Hall (C), Ellendale Volunteer Fire Company Incorporated (D). Display/hide their locations on the map
Churches in zip code 19941 include: Oakley Church (A), New Shiloh F B H Church of God (B), Solid Rock Church (C), Philadelphia Pentecostal Holiness Church (D), The United Methodist Church (E), Mount Zion African Methodist Episcopal Church (F). Display/hide their locations on the map
Streams, rivers, and creeks: Prong Number One (A), Piney Branch (B), Maple Marsh and Beaver Dam Branch (C), Maple Branch (D). Display/hide their locations on the map
In group quarters: 9 (-1 institutionalized population)
Size of family households: 385 2-persons, 171 3-persons, 150 4-persons, 106 5-persons, 5 6-persons, 1 7-or-more-persons
Size of nonfamily households: 169 1-person, 101 2-persons, 59 3-persons
376 married couples with children.
427 single-parent households (152 men, 275 women).
92.6% of residents of 19941 zip code speak English at home.
6.4% of residents speak Spanish at home (63% very well, 23% well, 14% not well).
0.3% of residents speak other Indo-European language at home (12% very well, 25% well, 62% not at all).
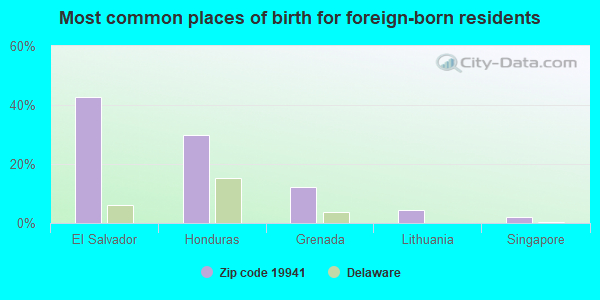
Foreign born population: 90 (2.8%) (26.4% of them are naturalized citizens)
This zip code:
2.8%
Whole state:
9.9%
43%El Salvador
30%Honduras
12%Grenada
4%Lithuania
2%Singapore
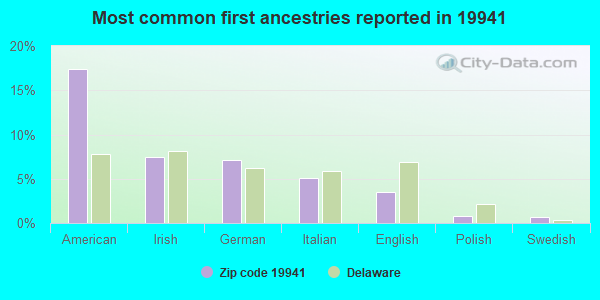
17%American
8%Irish
7%German
5%Italian
4%English
1%Polish
1%Swedish
Year of entry for the foreign-born population
152010 or later
612000 to 2009
41990 to 1999
23Before 1990
Facilities with environmental interests located in this zip code:
SHADY LANE (RT #1, BOX 301 in HARTLEY, DE)
COMPLIANCE ACTIVITY (Tracking inspections of insecticide, fungicide, and rodenticide, and toxic substances)
Housing units lacking complete plumbing facilities: 4.6% Housing units lacking complete kitchen facilities: 3.1%
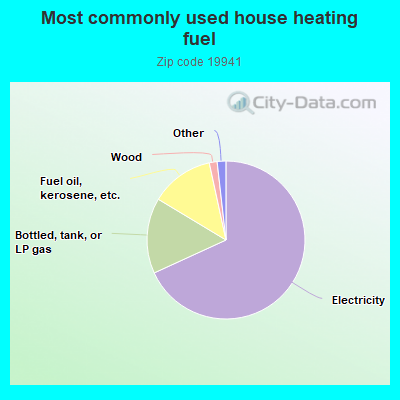
68.3%Electricity
15.5%Bottled, tank, or LP gas
13.0%Fuel oil, kerosene, etc.
1.6%Wood
0.7%Utility gas
0.6%Solar energy
Population in 1990: 2,445.
Place of birth for U.S.-born residents:
This state: 1,846
Northeast: 564
Midwest: 53
South: 484
West: 97
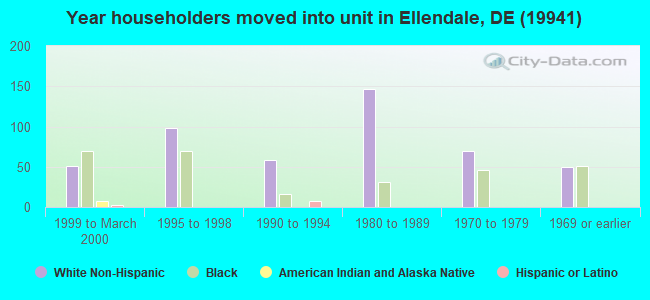
61% of the 19941 zip code residents lived in the same house 5 years ago. Out of people who lived in different houses, 59% lived in this county. Out of people who lived in different counties, 50% lived in Delaware.
96% of the 19941 zip code residents lived in the same house 1 year ago. Out of people who lived in different houses, 62% moved from this county. Out of people who lived in different houses, 7% moved from different county within same state. Out of people who lived in different houses, 20% moved from different state. Out of people who lived in different houses, 1% moved from abroad.
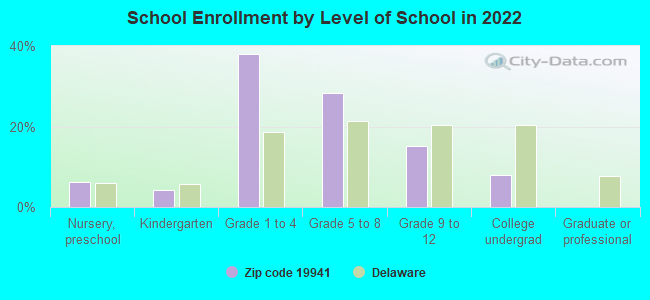
Private vs. public school enrollment:
Students in private schools in grades 1 to 8 (elementary and middle school): 7
Here:
1.6%
Delaware:
11.5%
Students in private schools in grades 9 to 12 (high school):
Here:
0.0%
Delaware:
12.1%
Students in private undergraduate colleges: 1
Here:
3.3%
Delaware:
19.2%
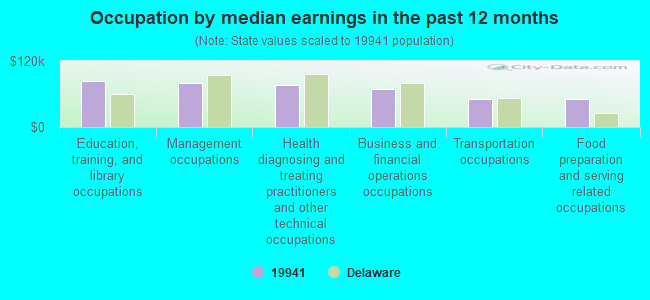
Occupation by median earnings in the past 12 months ($)
83,098Education, training, and library occupations
79,415Management occupations
75,820Health diagnosing and treating practitioners and other technical occupations
68,517Business and financial operations occupations
51,197Transportation occupations
50,429Food preparation and serving related occupations
Top industries in this zip code by the number of employees in 2005:
Health Care and Social Assistance: Other Individual and Family Services (20-49 employees: 1 establishment, 1-4 employees: 1 establishment)
Other Services (except Public Administration): Beauty Salons (5-9: 1)
Construction: Water and Sewer Line and Related Structures Construction (5-9: 1)
Other Services (except Public Administration): Commercial and Industrial Machinery and Equipment (except Automotive and Electronic) Repair and Maintenance (1-4: 2)
Health Care and Social Assistance: Child Day Care Services (1-4: 2)
Administrative and Support and Waste Management and Remediation Services: Landscaping Services (1-4: 2)
Construction: Residential Remodelers (1-4: 2)
People in group quarters in 2010:
25 people in other noninstitutional facilities
4 people in group homes intended for adults
People in group quarters in 2000:
7 people in homes or halfway houses for drug/alcohol abuse
Fatal accident statistics in 2014:
Fatal accident count: 3
Vehicles involved in fatal accidents: 3
Fatal accidents caused by drunken drivers: 0
Fatalities: 3
Persons involved in fatal accidents: 6
Pedestrians involved in fatal accidents: 1
Fatal accident statistics in 2013:
Fatal accident count: 1
Vehicles involved in fatal accidents: 1
Fatal accidents caused by drunken drivers: 0
Fatalities: 1
Persons involved in fatal accidents: 1
Pedestrians involved in fatal accidents: 1
2002 - 2018 National Fire Incident Reporting System (NFIRS) incidents
According to the data from the years 2002 - 2018 the average number of fires per year is 22. The highest number of fires - 38 took place in 2007, and the least - 9 in 2013. The data has a dropping trend.
When looking into fire subcategories, the most incidents belonged to: Outside Fires (46.5%), and Structure Fires (39.1%).
Fire incident types reported to NFIRS in Zip Code 19941
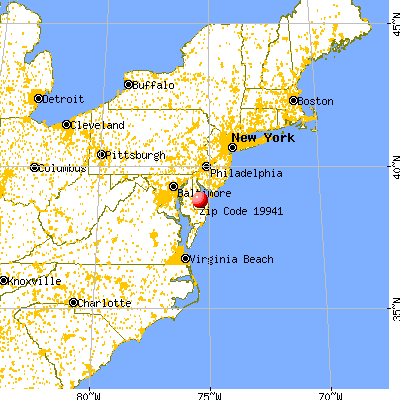


 Nearest zip codes: 19960, 19947, 19954, 19968, 19963, 19950.
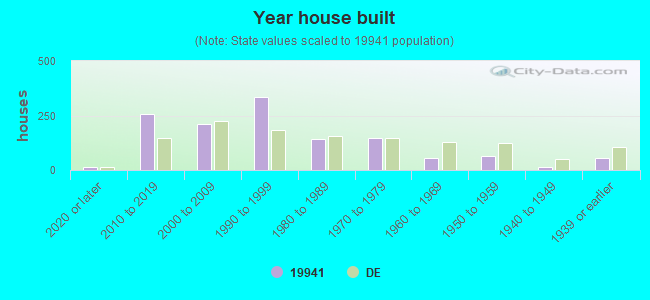


 According to the data from the years 2002 - 2018 the average number of fires per year is 22. The highest number of fires - 38 took place in 2007, and the least - 9 in 2013. The data has a dropping trend.
 When looking into fire subcategories, the most incidents belonged to: Outside Fires (46.5%), and Structure Fires (39.1%).