Estimated zip code population in 2022: 16,216 Zip code population in 2010: 15,500 Zip code population in 2000: 13,451
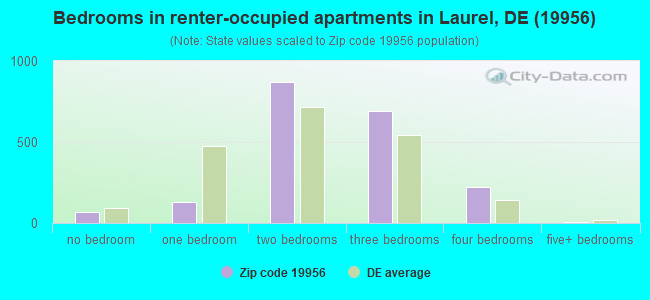
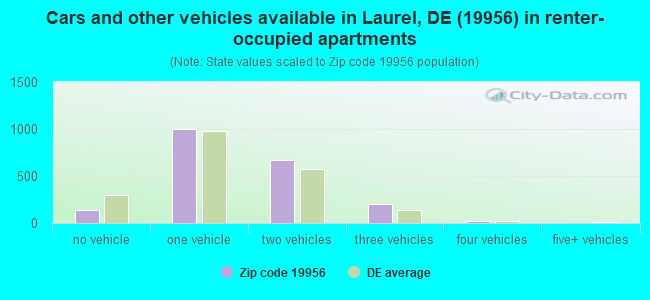
Houses and condos: 6,801 Renter-occupied apartments: 2,004
% of renters here:
32%
State:
26%
March 2022 cost of living index in zip code 19956: 84.1 (less than average, U.S. average is 100)
Land area: 101.1 sq. mi. Water area: 1.0 sq. mi.
Population density: 160 people per square mile
(very low).
OSM Map
General Map
Google Map
MSN Map
OSM Map
General Map
Google Map
MSN Map
OSM Map
General Map
Google Map
MSN Map
OSM Map
General Map
Google Map
MSN Map
Please wait while loading the map...
Real estate property taxes paid for housing units in 2022:
This zip code:
0.4% ($857)
Delaware:
0.5% ($1,635)
Median real estate property taxes paid for housing units with mortgages in 2022: $941 (0.3%) Median real estate property taxes paid for housing units with no mortgage in 2022: $803 (0.4%)
Business Search- 14 Million verified businesses
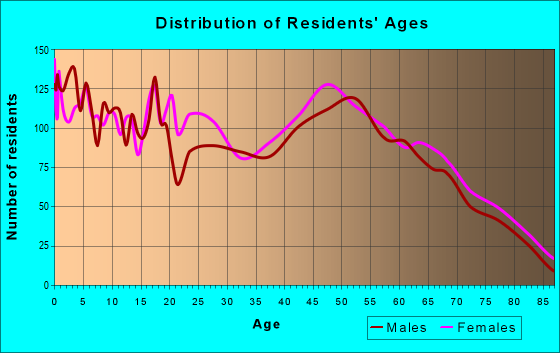
Males: 7,450
(45.9%)
Females: 8,765
(54.1%)
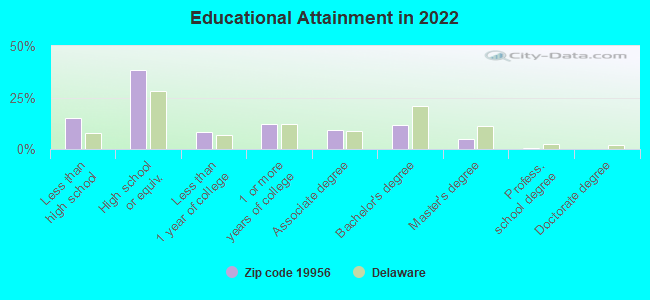
For population 25 years and over in 19956:
High school or higher: 82.4%
Bachelor's degree or higher: 16.4%
Graduate or professional degree: 5.2%
Unemployed: 5.3%
Mean travel time to work (commute): 27.3 minutes
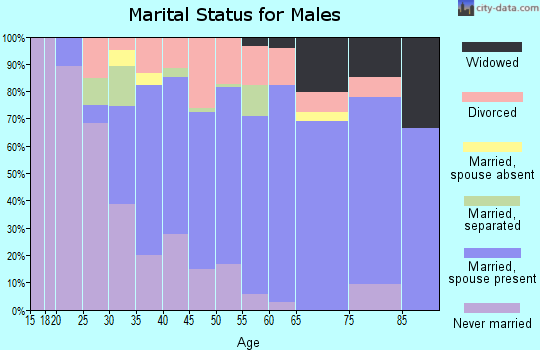
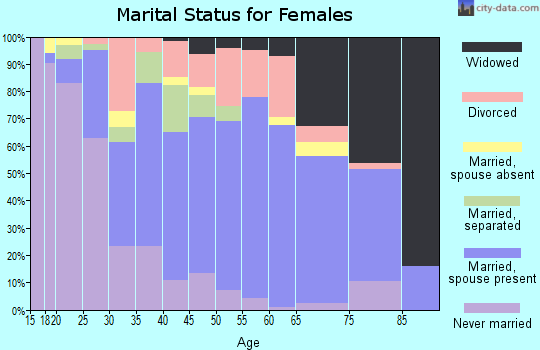
For population 15 years and over in 19956:
Never married: 28.6%
Now married: 49.7%
Separated: 2.9%
Widowed: 6.1%
Divorced: 12.6%
Zip code 19956 compared to state average:
Median age below state average.
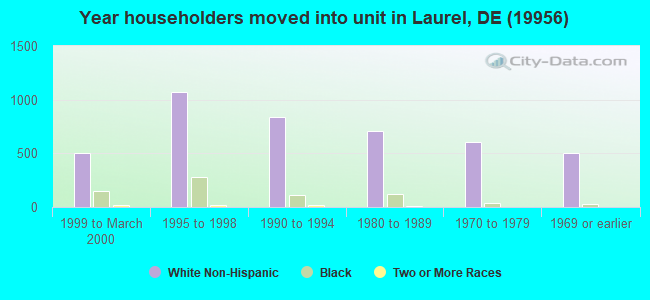
Length of stay since moving in significantly above state average.
Percentage of population with a bachelor's degree or higher significantly below state average.
Averages for the 2020 tax year for zip code 19956, filed in 2021:
Average Adjusted Gross Income (AGI) in 2020: $51,447 (Individual Income Tax Returns)
Here:
$51,447
State:
$74,239
Salary/wage: $42,210 (reported on 83.3% of returns)
Here:
$42,210
State:
$59,982
(% of AGI for various income ranges: 1272.2% for AGIs below $25k, 3644.4% for AGIs $25k-50k, 6518.2% for AGIs $50k-75k, 9838.4% for AGIs $75k-100k, 17224.3% for AGIs $100k-200k, 52456.7% for AGIs over 200k)
Taxable interest for individuals: $1,245 (reported on 19.0% of returns)
This zip code:
$1,245
Delaware:
$1,604
(% of AGI for various income ranges: 7.9% for AGIs below $25k, 15.7% for AGIs $25k-50k, 45.1% for AGIs $50k-75k, 71.6% for AGIs $75k-100k, 116.1% for AGIs $100k-200k, 850.0% for AGIs over 200k)
Ordinary dividends: $3,272 (reported on 10.6% of returns)
Here:
$3,272
State:
$8,303
(% of AGI for various income ranges: 13.0% for AGIs below $25k, 18.2% for AGIs $25k-50k, 71.0% for AGIs $50k-75k, 100.5% for AGIs $75k-100k, 179.5% for AGIs $100k-200k, 1216.7% for AGIs over 200k)
Net capital gain/loss in AGI: +$11,321 (reported on 8.5% of returns)
Here:
+$11,321
State:
+$19,461
(% of AGI for various income ranges: 2.8% for AGIs below $25k, 15.1% for AGIs $25k-50k, 19.9% for AGIs $50k-75k, 119.1% for AGIs $75k-100k, 593.9% for AGIs $100k-200k, 13550.0% for AGIs over 200k)
Profit/loss from business: +$10,023 (reported on 13.4% of returns)
Here:
+$10,023
State:
+$13,079
(% of AGI for various income ranges: 152.0% for AGIs below $25k, 99.6% for AGIs $25k-50k, 194.9% for AGIs $50k-75k, 202.3% for AGIs $75k-100k, 364.1% for AGIs $100k-200k, 5460.0% for AGIs over 200k)
Taxable individual retirement arrangement distribution: $14,163 (reported on 6.7% of returns)
19956:
$14,163
Delaware:
$22,095
(% of AGI for various income ranges: 32.5% for AGIs below $25k, 77.6% for AGIs $25k-50k, 170.6% for AGIs $50k-75k, 240.7% for AGIs $75k-100k, 698.0% for AGIs $100k-200k)
Total itemized deductions: $33,855 (reported on 4.1% of returns)
Here:
$33,855
State:
$30,452
(% of AGI for various income ranges: 76.9% for AGIs $25k-50k, 195.2% for AGIs $50k-75k, 271.2% for AGIs $75k-100k, 620.0% for AGIs $100k-200k, 14160.0% for AGIs over 200k)
Charity contributions: $15,750 (reported on 3.0% of returns)
Here:
$15,750
State:
$8,999
(% of AGI for various income ranges: 11.6% for AGIs $25k-50k, 58.5% for AGIs $50k-75k, 90.0% for AGIs $75k-100k, 150.0% for AGIs $100k-200k, 6813.3% for AGIs over 200k)
Taxes paid: $5,900 (reported on 4.0% of returns)
19956:
$5,900
State:
$7,483
(% of AGI for various income ranges: 7.4% for AGIs $25k-50k, 31.9% for AGIs $50k-75k, 66.5% for AGIs $75k-100k, 167.5% for AGIs $100k-200k, 1560.0% for AGIs over 200k)
Earned income credit: $2,515 (reported on 22.0% of returns)
Here:
$2,515
State:
$2,247
(% of AGI for various income ranges: 131.3% for AGIs below $25k, 86.0% for AGIs $25k-50k)
Percentage of individuals using paid preparers for their 2020 taxes: 92.5%
Here:
93%
State:
92%
(% for various income ranges: 91.5% for AGIs below $25k, 93.0% for AGIs $25k-50k, 92.9% for AGIs $50k-75k, 93.8% for AGIs $75k-100k, 93.6% for AGIs $100k-200k, 91.7% for AGIs over 200k)
Averages for the 2012 tax year for zip code 19956, filed in 2013:
Average Adjusted Gross Income (AGI) in 2012: $40,404 (Individual Income Tax Returns)
Here:
$40,404
State:
$61,157
Salary/wage: $35,150 (reported on 85.4% of returns)
Here:
$35,150
State:
$50,642
(% of AGI for various income ranges: 76.8% for AGIs below $25k, 79.7% for AGIs $25k-50k, 78.1% for AGIs $50k-75k, 78.2% for AGIs $75k-100k, 71.2% for AGIs $100k-200k, 36.4% for AGIs over 200k)
Taxable interest for individuals: $1,209 (reported on 25.0% of returns)
This zip code:
$1,209
Delaware:
$1,571
(% of AGI for various income ranges: 1.0% for AGIs below $25k, 0.7% for AGIs $25k-50k, 0.6% for AGIs $50k-75k, 0.5% for AGIs $75k-100k, 0.9% for AGIs $100k-200k, 1.1% for AGIs over 200k)
Ordinary dividends: $2,279 (reported on 12.6% of returns)
Here:
$2,279
State:
$6,610
(% of AGI for various income ranges: 0.8% for AGIs below $25k, 0.6% for AGIs $25k-50k, 0.6% for AGIs $50k-75k, 0.4% for AGIs $75k-100k, 1.2% for AGIs $100k-200k, 0.6% for AGIs over 200k)
Net capital gain/loss in AGI: +$7,477 (reported on 8.3% of returns)
Here:
+$7,477
State:
+$11,439
(% of AGI for various income ranges: 0.1% for AGIs $25k-50k, 0.4% for AGIs $75k-100k, 1.6% for AGIs $100k-200k, 17.6% for AGIs over 200k)
Profit/loss from business: +$7,531 (reported on 12.3% of returns)
Here:
+$7,531
State:
+$12,773
(% of AGI for various income ranges: 6.1% for AGIs below $25k, 2.4% for AGIs $25k-50k, 1.7% for AGIs $50k-75k, 0.8% for AGIs $75k-100k, 1.9% for AGIs $100k-200k)
Taxable individual retirement arrangement distribution: $10,782 (reported on 8.0% of returns)
19956:
$10,782
Delaware:
$16,790
(% of AGI for various income ranges: 2.0% for AGIs below $25k, 1.7% for AGIs $25k-50k, 2.0% for AGIs $50k-75k, 2.5% for AGIs $75k-100k, 3.5% for AGIs $100k-200k)
Total itemized deductions: $17,803 (23% of AGI, reported on 21.5% of returns)
Here:
$17,803
State:
$23,216
Here:
23.0% of AGI
State:
19.8% of AGI
(% of AGI for various income ranges: 5.9% for AGIs below $25k, 6.8% for AGIs $25k-50k, 9.6% for AGIs $50k-75k, 12.9% for AGIs $75k-100k, 12.4% for AGIs $100k-200k, 10.2% for AGIs over 200k)
Charity contributions: $3,575 (reported on 15.9% of returns)
Here:
$3,575
State:
$3,791
(% of AGI for various income ranges: 0.6% for AGIs below $25k, 0.8% for AGIs $25k-50k, 1.5% for AGIs $50k-75k, 2.0% for AGIs $75k-100k, 2.2% for AGIs $100k-200k, 1.5% for AGIs over 200k)
Taxes paid: $4,582 (reported on 21.3% of returns)
19956:
$4,582
State:
$8,129
(% of AGI for various income ranges: 0.5% for AGIs below $25k, 1.2% for AGIs $25k-50k, 2.1% for AGIs $50k-75k, 3.1% for AGIs $75k-100k, 4.3% for AGIs $100k-200k, 5.3% for AGIs over 200k)
Earned income credit: $2,467 (reported on 25.7% of returns)
Here:
$2,467
State:
$2,231
(% of AGI for various income ranges: 8.4% for AGIs below $25k, 1.3% for AGIs $25k-50k)
Percentage of individuals using paid preparers for their 2012 taxes: 53.0%
Here:
53%
State:
47%
(% for various income ranges: 48.2% for AGIs below $25k, 49.2% for AGIs $25k-50k, 60.2% for AGIs $50k-75k, 63.5% for AGIs $75k-100k, 73.7% for AGIs $100k-200k, 83.3% for AGIs over 200k)
Averages for the 2004 tax year for zip code 19956, filed in 2005:
Average Adjusted Gross Income (AGI) in 2004: $40,112 (Individual Income Tax Returns)
Here:
$40,112
State:
$54,038
Salary/wage: $31,151 (reported on 86.4% of returns)
Here:
$31,151
State:
$44,625
(% of AGI for various income ranges: 103.6% for AGIs below $10k, 78.9% for AGIs $10k-25k, 80.4% for AGIs $25k-50k, 80.0% for AGIs $50k-75k, 74.0% for AGIs $75k-100k, 34.3% for AGIs over 100k)
Taxable interest for individuals: $1,559 (reported on 33.1% of returns)
This zip code:
$1,559
Delaware:
$1,734
(% of AGI for various income ranges: 4.3% for AGIs below $10k, 1.6% for AGIs $10k-25k, 1.2% for AGIs $25k-50k, 0.9% for AGIs $50k-75k, 1.3% for AGIs $75k-100k, 1.2% for AGIs over 100k)
Taxable dividends: $2,212 (reported on 16.0% of returns)
Here:
$2,212
State:
$5,362
(% of AGI for various income ranges: 0.9% for AGIs below $10k, 1.0% for AGIs $10k-25k, 0.7% for AGIs $25k-50k, 0.7% for AGIs $50k-75k, 1.0% for AGIs $75k-100k, 1.0% for AGIs over 100k)
Net capital gain/loss: +$8,883 (reported on 10.9% of returns)
Here:
+$8,883
State:
+$17,328
(% of AGI for various income ranges: -0.7% for AGIs below $10k, 0.6% for AGIs $10k-25k, 0.5% for AGIs $25k-50k, 1.2% for AGIs $50k-75k, 2.6% for AGIs $75k-100k, 6.0% for AGIs over 100k)
Profit/loss from business: +$6,193 (reported on 13.1% of returns)
Here:
+$6,193
State:
+$12,191
(% of AGI for various income ranges: 4.6% for AGIs below $10k, 4.1% for AGIs $10k-25k, 2.4% for AGIs $25k-50k, 1.6% for AGIs $50k-75k, 0.9% for AGIs $75k-100k, 1.4% for AGIs over 100k)
Profit/loss from farming: +$354 (reported on 3.0% of returns)
Here:
+$354
State:
-$1,323
(% of AGI for various income ranges: -3.6% for AGIs below $10k, 0.4% for AGIs $10k-25k, 0.2% for AGIs $25k-50k, 0.8% for AGIs $50k-75k, -0.4% for AGIs $75k-100k, -0.4% for AGIs over 100k)
IRA payment deduction: $2,833 (reported on 1.9% of returns)
19956:
$2,833
Delaware:
$3,027
(% of AGI for various income ranges: 0.1% for AGIs $10k-25k, 0.2% for AGIs $25k-50k, 0.2% for AGIs $50k-75k, 0.1% for AGIs $75k-100k, 0.1% for AGIs over 100k)
Self-employed pension: $8,625 (reported on 0.2% of returns)
Here:
$8,625
Delaware:
$15,466
Total itemized deductions: $16,052 (22% of AGI, reported on 22.1% of returns)
Here:
$16,052
State:
$19,441
Here:
21.9% of AGI
State:
19.3% of AGI
(% of AGI for various income ranges: 5.9% for AGIs below $10k, 4.6% for AGIs $10k-25k, 8.4% for AGIs $25k-50k, 11.2% for AGIs $50k-75k, 11.7% for AGIs $75k-100k, 8.3% for AGIs over 100k)
Charity contributions deductions: $3,321 (4% of AGI, reported on 18.4% of returns)
Here:
$3,321
State:
$3,727
Here:
4.5% of AGI
State:
3.5% of AGI
(% of AGI for various income ranges: 0.4% for AGIs below $10k, 0.5% for AGIs $10k-25k, 1.2% for AGIs $25k-50k, 1.6% for AGIs $50k-75k, 2.2% for AGIs $75k-100k, 2.0% for AGIs over 100k)
Total tax: $6,671 (reported on 71.2% of returns)
19956:
$6,671
State:
$8,958
(% of AGI for various income ranges: 2.9% for AGIs below $10k, 3.9% for AGIs $10k-25k, 6.7% for AGIs $25k-50k, 8.6% for AGIs $50k-75k, 10.9% for AGIs $75k-100k, 23.6% for AGIs over 100k)
Earned income credit: $1,921 (reported on 21.8% of returns)
Here:
$1,921
State:
$1,733
Percentage of individuals using paid preparers for their 2004 taxes: 64.6%
Here:
65%
State:
55%
(% for various income ranges: 55.5% for AGIs below $10k, 66.7% for AGIs $10k-25k, 64.2% for AGIs $25k-50k, 66.9% for AGIs $50k-75k, 72.6% for AGIs $75k-100k, 79.4% for AGIs over 100k)
Likely homosexual households (counted as self-reported same-sex unmarried-partner households)
Lesbian couples: 0.0% of all households
Gay men: 0.6% of all households
Household received Food Stamps/SNAP in the past 12 months: 1,465 Household did not receive Food Stamps/SNAP in the past 12 months: 4,814
Women who had a birth in the past 12 months: 277 (90 now married, 168 unmarried) Women who did not have a birth in the past 12 months: 3,573 (1,300 now married, 2,262 unmarried)
Housing units in zip code 19956 with a mortgage: 1,917 (163 second mortgage, 5 home equity loan, 160 both second mortgage and home equity loan) Houses without a mortgage: 80
Median monthly owner costs for units with a mortgage: $1,319 Median monthly owner costs for units without a mortgage: $398
Residents with income below the poverty level in 2022:
This zip code:
17.3%
Whole state:
9.4%
Residents with income below 50% of the poverty level in 2022:
This zip code:
10.5%
Whole state:
4.6%
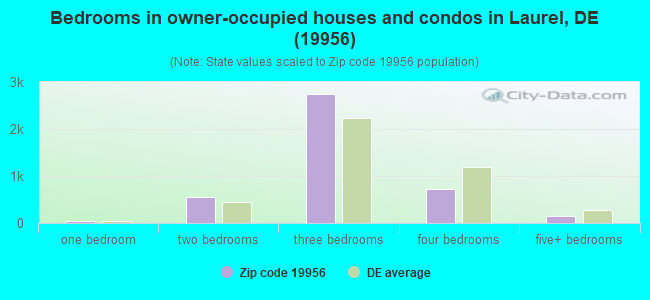
Median number of rooms in houses and condos:
Here:
6.6
State:
6.9
Median number of rooms in apartments:
Here:
4.5
State:
4.4
Notable locations in this zip code not listed on our city pages
Notable locations in zip code 19956: Shell Bridge (A), Mumford Manor (B), Dickerson Manor (C), Cherry Walk (D), Ellis Wharf (E), Delmarva Christian Camp (F), Laurel Fire Department Incorporated (G), Laurel Police Department (H), Laurel Town Hall (I), Laurel Public Library (J). Display/hide their locations on the map
Churches in zip code 19956 include: Bethesda Church (A), Saint Pauls United Methodist Church (B), Shiloh Church (C), Epworth Fellowship Church (D), Portsville Church (E), Mount Pleasant United Methodist Church (F), Christ Evangelical Church (G), Mount Zion United Methodist Church (H), Trinity Church (I). Display/hide their locations on the map
Cemeteries: New Mount Zion Methodist Cemetery (1), Mount Zion Cemetery (2), Odd Fellows Cemetery (3), Laurel Hill Cemetery (4), Ralphs Hill Cemetery (5). Display/hide their locations on the map
Lakes, reservoirs, and swamps: Raccoon Pond (A), Pepper Pond (B), Records Pond (C), Portsville Millpond (D), Horseys Pond (E), Chipman Pond (F), Wileys Pond (G), Trussum Pond (H). Display/hide their locations on the map
Streams, rivers, and creeks: Holly Branch (A), Hitch Pond Branch (B), Turkey Branch (C), Grays Branch (D), Gordon Branch (E), Gill Branch (F), Elliott Pond Branch (G), Dukes Ditch (H), Thompson Branch (I). Display/hide their locations on the map
Parks in zip code 19956 include: Nanticoke Park Wildlife Area (1), Phillips Landing Recreation Area (2), Trap Pond State Park (3). Display/hide their locations on the map
1,389 married couples with children.
1,864 single-parent households (220 men, 1,644 women).
88.9% of residents of 19956 zip code speak English at home.
9.6% of residents speak Spanish at home (55% very well, 17% well, 20% not well, 8% not at all).
0.9% of residents speak other Indo-European language at home (67% very well, 20% well, 13% not well).
0.2% of residents speak Asian or Pacific Island language at home (61% very well, 39% well).
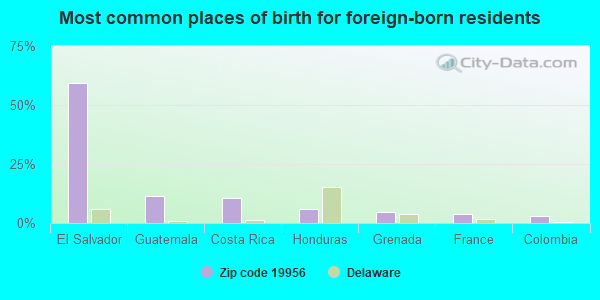
Foreign born population: 1,053 (6.5%) (39.3% of them are naturalized citizens)
This zip code:
6.5%
Whole state:
9.9%
59%El Salvador
11%Guatemala
11%Costa Rica
6%Honduras
5%Grenada
4%France
3%Colombia
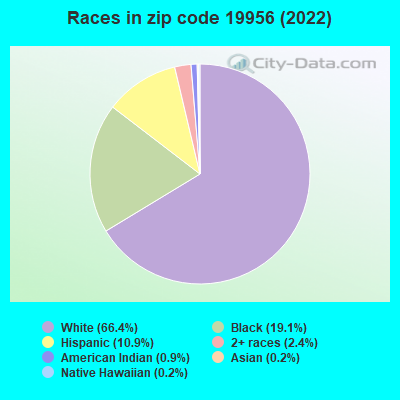
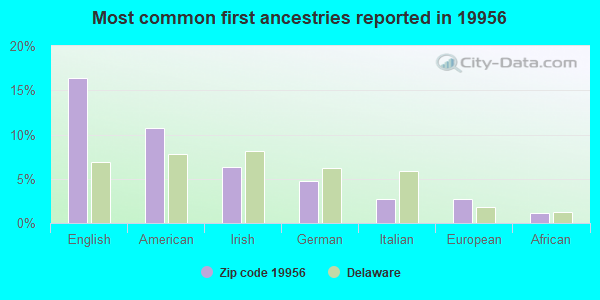
16%English
11%American
6%Irish
5%German
3%Italian
3%European
1%African
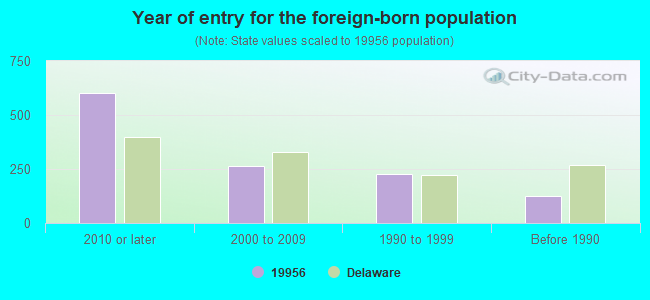
Year of entry for the foreign-born population
6012010 or later
2652000 to 2009
2281990 to 1999
125Before 1990
Major facilities with environmental interests located in this zip code:
COLONIAL ESTATES MOBILE HOME PARK (211 NORTH DUAL HIGHWAY in LAUREL, DE)
(Integrated Compliance Information System) - ICIS-03-2001-0062, FORMAL ENFORCEMENT ACTION National Pollutant Discharge Elimination System NON-MAJOR (Tracking pollutant discharge elimination systems) - permit COMMUNITY WATER SYSTEM (SDWIS) Business SIC classification: SEWERAGE SYSTEMS; OPERATORS OF RESIDENTIAL MOBILE HOME SITES Alternative names: COMMUNITY MANAGEMENT INC. - CO, COMMUNITY MANAGEMENT INC., COLONIAL ESTATES M.H.P, COLONIAL ESTATES MOBILE HOME PARKWAY
LAUREL WATER DEPARTMENT (OLD SAILOR ROAD in LAUREL, DE)
National Pollutant Discharge Elimination System NON-MAJOR (Tracking pollutant discharge elimination systems) - permit COMMUNITY WATER SYSTEM (SDWIS) - SDWIS-DE0000597 2T, WATER TREATMENT PLANT Business SIC classification: SEWERAGE SYSTEMS Alternative names: LAUREL STP
LAUREL SENIOR HIGH SCHOOL (1133 SOUTH CENTRAL AVENUE in LAUREL, DE)
(Geographic Names Information System) (National Center for Education Statistics) - STATE ID-756 Organizations: LAUREL SCHOOL DISTRICT (SCHOOL DISTRICT)
NORTH LAUREL ELEMENTARY SCHOOL (300 WILSON STREET in LAUREL, DE)
(Geographic Names Information System) (National Center for Education Statistics) - STATE ID-752 Organizations: LAUREL SCHOOL DISTRICT (SCHOOL DISTRICT)
GEORGETOWN CHARTER SCHOOL (12108 COUNTY SEAT HIGHWAY in LAUREL, DE)
(National Center for Education Statistics) - STATE ID-580
LAUREL MIDDLE SCHOOL (801 SOUTH CENTRAL AVENUE in LAUREL, DE)
(National Center for Education Statistics) - STATE ID-754 Organizations: LAUREL SCHOOL DISTRICT (SCHOOL DISTRICT)
PAUL LAURENCE DUNBAR ELEMENTARY SCHOOL (499 WEST SIXTH STREET in LAUREL, DE)
(National Center for Education Statistics) - STATE ID-753 Organizations: LAUREL SCHOOL DISTRICT (SCHOOL DISTRICT)
SUSSEX COUNTY LANDFILL NO. 5 (BETWEEN CNTY RD 494, CNTY RD 497, SH 24 in LAUREL, DE)
SUPERFUND NPL (Superfund database) (Integrated Compliance Information System) - ICIS-03-1996-0209, FORMAL ENFORCEMENT ACTION Alternative names: LAUREL LANDFILL *, SUSSEX CO LANDFILL #5, SUSSEX COUNTY LANDFILL # 5
WESTERN SUSSEX ACADEMY ILC (815 CENTRAL AVENUE in LAUREL, DE)
(National Center for Education Statistics) - STATE ID-765 Organizations: LAUREL SCHOOL DISTRICT (SCHOOL DISTRICT)
BRIARWOOD MANOR INC (HARBESON RD in LAUREL, DE)
(Integrated Compliance Information System) - ICIS-03-2000-0612, FORMAL ENFORCEMENT ACTION,
LOWES TRAILER PARK SYS (#2 CHIPMAN POND RD in LAUREL, DE)
(Integrated Compliance Information System) - ICIS-03-1999-0183, FORMAL ENFORCEMENT ACTION, Business SIC classification: FRUIT AND VEGETABLE MARKETS; RECREATIONAL VEHICLE PARKS AND CAMPSITES
LAUREL SCHOOL DISTRICT (815 CENTRAL AVE. in LAUREL, DE)
COMPLIANCE ACTIVITY (Tracking inspections of insecticide, fungicide, and rodenticide, and toxic substances) Alternative names: LAUREL MIDDLE SCHOOL
LAUREL S.D. (1160 S CENTRAL AVE in LAUREL, DE)
COMPLIANCE ACTIVITY (Tracking inspections of insecticide, fungicide, and rodenticide, and toxic substances) COMMUNITY WATER SYSTEM (SDWIS) Alternative names: LAUREL SCHOOL DISTRICCT, LAUREL SCHOOL DISTRICT
Housing units lacking complete plumbing facilities: 0.5% Housing units lacking complete kitchen facilities: 0.3%
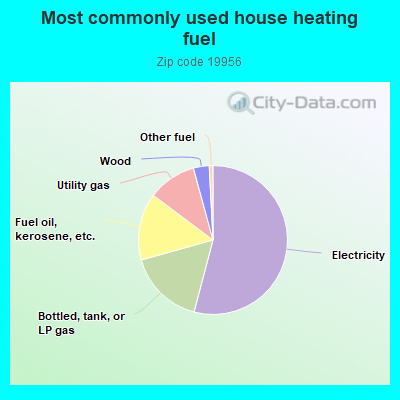
53.9%Electricity
16.5%Bottled, tank, or LP gas
14.5%Fuel oil, kerosene, etc.
10.5%Utility gas
3.4%Wood
0.8%Other fuel
Population in 1990: 9,283. Population change in the 1990s: +4,168 (+44.9%).
Place of birth for U.S.-born residents:
This state: 7,866
Northeast: 1,869
Midwest: 191
South: 4,786
West: 160
60% of the 19956 zip code residents lived in the same house 5 years ago. Out of people who lived in different houses, 64% lived in this county. Out of people who lived in different counties, 50% lived in Delaware.
91% of the 19956 zip code residents lived in the same house 1 year ago. Out of people who lived in different houses, 41% moved from this county. Out of people who lived in different houses, 1% moved from different county within same state. Out of people who lived in different houses, 54% moved from different state. Out of people who lived in different houses, 9% moved from abroad.
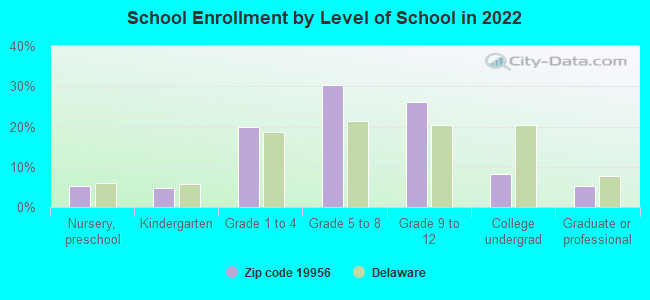
Private vs. public school enrollment:
Students in private schools in grades 1 to 8 (elementary and middle school): 211
Here:
10.1%
Delaware:
11.5%
Students in private schools in grades 9 to 12 (high school): 90
Here:
8.4%
Delaware:
12.1%
Students in private undergraduate colleges: 40
Here:
12.0%
Delaware:
19.2%
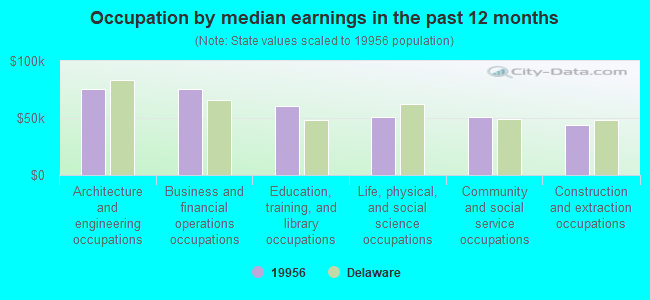
Occupation by median earnings in the past 12 months ($)
75,801Architecture and engineering occupations
75,557Business and financial operations occupations
60,682Education, training, and library occupations
50,590Life, physical, and social science occupations
50,511Community and social service occupations
43,519Construction and extraction occupations
Companies with federal contracts located in this zip code:
W B VENABLES AND SONS INC (MECHANIC ST in LAUREL, DE)
-$10,080 with Navy for Construction of Structures and Facilities -- Family Housing Facilities. Taking place in VA. Signed on 2001-08-01. Completion date: 1999-08-15.
Top industries in this zip code by the number of employees in 2005:
Other Services (except Public Administration): Religious Organizations (20-49 employees: 2 establishments, 5-9 employees: 4 establishments, 1-4 employees: 5 establishments)
Administrative and Support and Waste Management and Remediation Services: Landscaping Services (50-99: 1, 1-4: 4)
Professional, Scientific, and Technical Services: Other Accounting Services (50-99: 1, 1-4: 3)
Finance and Insurance: Commercial Banking (20-49: 1, 5-9: 3)
People in group quarters in 2010:
5 people in emergency and transitional shelters (with sleeping facilities) for people experiencing homelessness
4 people in group homes intended for adults
Fatal accident statistics in 2014:
Fatal accident count: 1
Vehicles involved in fatal accidents: 2
Fatal accidents caused by drunken drivers: 0
Fatalities: 1
Persons involved in fatal accidents: 2
Pedestrians involved in fatal accidents: 0
Fatal accident statistics in 2013:
Fatal accident count: 1
Vehicles involved in fatal accidents: 2
Fatal accidents caused by drunken drivers: 0
Fatalities: 1
Persons involved in fatal accidents: 2
Pedestrians involved in fatal accidents: 0
2002 - 2018 National Fire Incident Reporting System (NFIRS) incidents
According to the data from the years 2002 - 2018 the average number of fires per year is 88. The highest number of fires - 134 took place in 2006, and the least - 62 in 2013. The data has a growing trend.
When looking into fire subcategories, the most incidents belonged to: Structure Fires (54.4%), and Outside Fires (32.3%).
Fire incident types reported to NFIRS in Zip Code 19956


+$354
-$1,323
(% of AGI for various income ranges: -3.6% for AGIs below $10k, 0.4% for AGIs $10k-25k, 0.2% for AGIs $25k-50k, 0.8% for AGIs $50k-75k, -0.4% for AGIs $75k-100k, -0.4% for AGIs over 100k) Nearest zip codes: 19940, 19931, 21875, 19973, 19947, 21849.
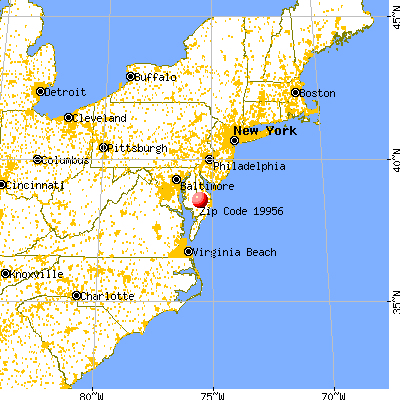
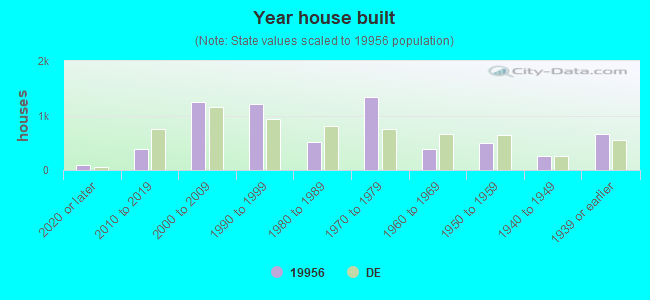


 According to the data from the years 2002 - 2018 the average number of fires per year is 88. The highest number of fires - 134 took place in 2006, and the least - 62 in 2013. The data has a growing trend.
 When looking into fire subcategories, the most incidents belonged to: Structure Fires (54.4%), and Outside Fires (32.3%).