Estimated zip code population in 2022: 603 Zip code population in 2010: 919 Zip code population in 2000: 1,015
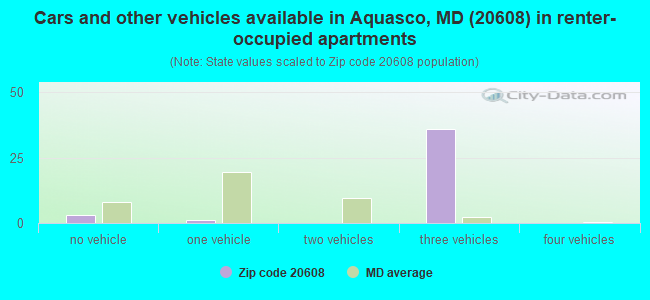
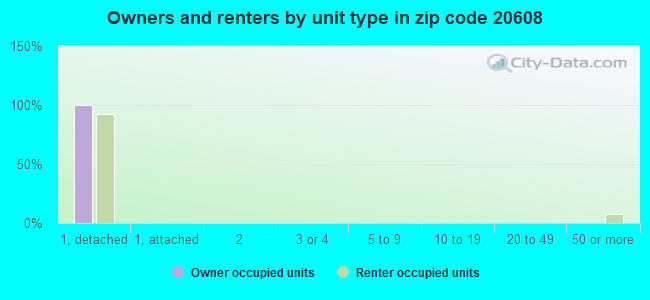
Houses and condos: 285 Renter-occupied apartments: 38
% of renters here:
16%
State:
32%
March 2022 cost of living index in zip code 20608: 132.0 (high, U.S. average is 100)
Land area: 17.6 sq. mi. Water area: 2.1 sq. mi.
Population density: 34 people per square mile
(very low).
OSM Map
General Map
Google Map
MSN Map
OSM Map
General Map
Google Map
MSN Map
OSM Map
General Map
Google Map
MSN Map
OSM Map
General Map
Google Map
MSN Map
Please wait while loading the map...
Real estate property taxes paid for housing units in 2022:
This zip code:
1.0% ($4,099)
Maryland:
0.9% ($3,777)
Median real estate property taxes paid for housing units with mortgages in 2022: $3,727 (0.8%) Median real estate property taxes paid for housing units with no mortgage in 2022: $5,502 (1.4%)
Business Search- 14 Million verified businesses
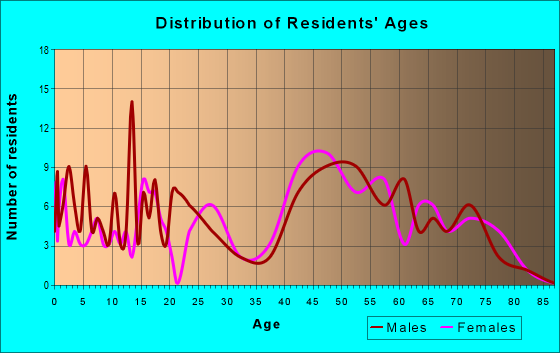
Males: 324
(53.7%)
Females: 279
(46.3%)
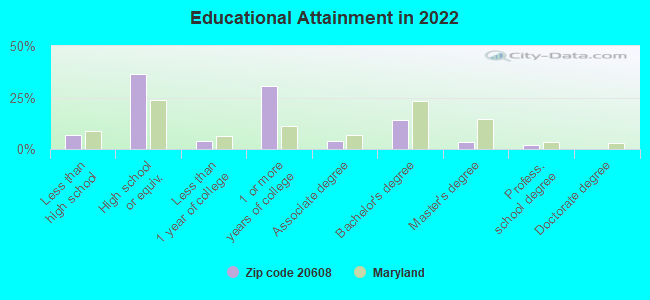
For population 25 years and over in 20608:
High school or higher: 90.4%
Bachelor's degree or higher: 19.0%
Graduate or professional degree: 5.3%
Unemployed: 2.4%
Mean travel time to work (commute): 50.5 minutes
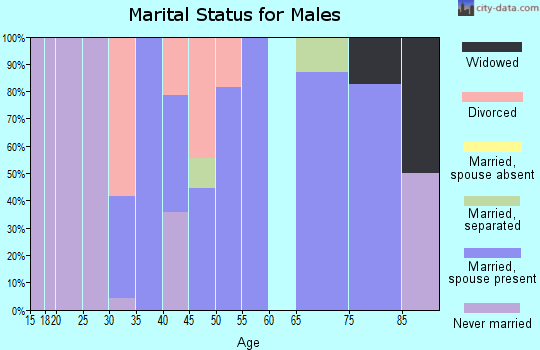
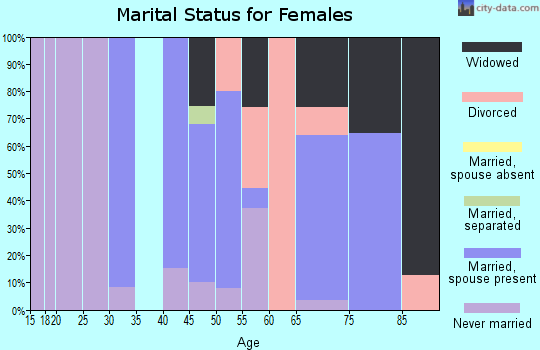
For population 15 years and over in 20608:
Never married: 14.5%
Now married: 63.9%
Separated: 0.0%
Widowed: 9.8%
Divorced: 11.8%
Zip code 20608 compared to state average:
Hispanic race population percentage below state average.
Median age significantly above state average.
Foreign-born population percentage significantly below state average.
Renting percentage below state average.
Length of stay since moving in significantly above state average.
Percentage of population with a bachelor's degree or higher significantly below state average.
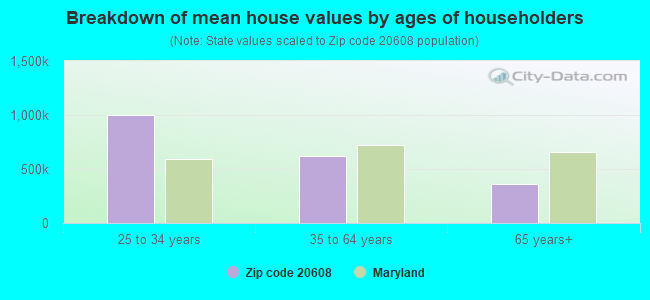
Estimated median house/condo value in 2022: $425,930
20608:
$425,930
Maryland:
$398,100
According to our research of Maryland and other state lists, there was 1 registered sex offender living in 20608 zip code as of April 26, 2024. The ratio of all residents to sex offenders in zip code 20608 is 804 to 1. The ratio of registered sex offenders to all residents in this zip code is near the state average.
Median resident age:
This zip code:
50.3 years
Maryland median age:
39.7 years
Average household size:
This zip code:
2.5 people
Maryland:
2.5 people
Averages for the 2020 tax year for zip code 20608, filed in 2021:
Average Adjusted Gross Income (AGI) in 2020: $69,670 (Individual Income Tax Returns)
Here:
$69,670
State:
$86,905
Salary/wage: $63,458 (reported on 77.5% of returns)
Here:
$63,458
State:
$73,953
(% of AGI for various income ranges: 1196.2% for AGIs below $25k, 3741.7% for AGIs $25k-50k, 6022.0% for AGIs $50k-75k, 8916.7% for AGIs $75k-100k, 26960.0% for AGIs $100k-200k)
Taxable interest for individuals: $567 (reported on 30.0% of returns)
This zip code:
$567
Maryland:
$1,528
(% of AGI for various income ranges: 11.2% for AGIs below $25k, 38.0% for AGIs $50k-75k, 23.3% for AGIs $75k-100k, 82.5% for AGIs $100k-200k)
Ordinary dividends: $6,175 (reported on 10.0% of returns)
Here:
$6,175
State:
$8,028
(% of AGI for various income ranges: 617.5% for AGIs $100k-200k)
Net capital gain/loss in AGI: +$3,400 (reported on 10.0% of returns)
Here:
+$3,400
State:
+$25,238
(% of AGI for various income ranges: 453.3% for AGIs $75k-100k)
Profit/loss from business: +$3,767 (reported on 15.0% of returns)
Here:
+$3,767
State:
+$11,398
(% of AGI for various income ranges: 596.7% for AGIs $25k-50k)
Total itemized deductions: $26,440 (reported on 25.0% of returns)
Here:
$26,440
State:
$30,672
(% of AGI for various income ranges: 2536.0% for AGIs $50k-75k, 3440.0% for AGIs $100k-200k)
Charity contributions: $9,050 (reported on 20.0% of returns)
Here:
$9,050
State:
$9,065
(% of AGI for various income ranges: 482.0% for AGIs $50k-75k, 1207.5% for AGIs $100k-200k)
Taxes paid: $7,480 (reported on 25.0% of returns)
20608:
$7,480
State:
$8,475
(% of AGI for various income ranges: 728.0% for AGIs $50k-75k, 960.0% for AGIs $100k-200k)
Earned income credit: $1,525 (reported on 10.0% of returns)
Here:
$1,525
State:
$2,151
(% of AGI for various income ranges: 76.2% for AGIs below $25k)
Percentage of individuals using paid preparers for their 2020 taxes: 90.0%
Here:
90%
State:
90%
(% for various income ranges: 81.8% for AGIs below $25k, 100.0% for AGIs $25k-50k, 85.7% for AGIs $50k-75k, 80.0% for AGIs $75k-100k, 100.0% for AGIs $100k-200k)
Averages for the 2012 tax year for zip code 20608, filed in 2013:
Average Adjusted Gross Income (AGI) in 2012: $66,010 (Individual Income Tax Returns)
Here:
$66,010
State:
$72,703
Salary/wage: $57,097 (reported on 82.9% of returns)
Here:
$57,097
State:
$62,228
(% of AGI for various income ranges: 75.0% for AGIs below $25k, 74.4% for AGIs $25k-50k, 85.3% for AGIs $50k-75k, 62.1% for AGIs $75k-100k, 69.0% for AGIs $100k-200k)
Taxable interest for individuals: $1,133 (reported on 36.6% of returns)
This zip code:
$1,133
Maryland:
$1,413
(% of AGI for various income ranges: 0.3% for AGIs below $25k, 1.8% for AGIs $25k-50k, 0.2% for AGIs $50k-75k, 0.3% for AGIs $75k-100k, 0.6% for AGIs $100k-200k)
Ordinary dividends: $2,840 (reported on 12.2% of returns)
Here:
$2,840
State:
$6,933
Net capital gain/loss in AGI: +$12,600 (reported on 9.8% of returns)
Here:
+$12,600
State:
+$14,830
Profit/loss from business: +$3,567 (reported on 14.6% of returns)
Here:
+$3,567
State:
+$12,606
Taxable individual retirement arrangement distribution: $13,350 (reported on 4.9% of returns)
20608:
$13,350
Maryland:
$17,065
Total itemized deductions: $27,290 (27% of AGI, reported on 51.2% of returns)
Here:
$27,290
State:
$27,886
Here:
27.5% of AGI
State:
22.8% of AGI
(% of AGI for various income ranges: 27.3% for AGIs $25k-50k, 22.8% for AGIs $50k-75k, 18.9% for AGIs $75k-100k, 22.0% for AGIs $100k-200k)
Charity contributions: $4,747 (reported on 36.6% of returns)
Here:
$4,747
State:
$4,452
(% of AGI for various income ranges: 3.5% for AGIs $25k-50k, 2.7% for AGIs $50k-75k, 3.0% for AGIs $75k-100k, 2.6% for AGIs $100k-200k)
Taxes paid: $9,457 (reported on 51.2% of returns)
20608:
$9,457
State:
$11,690
(% of AGI for various income ranges: 6.1% for AGIs $25k-50k, 7.7% for AGIs $50k-75k, 6.4% for AGIs $75k-100k, 8.4% for AGIs $100k-200k)
Earned income credit: $1,660 (reported on 12.2% of returns)
Here:
$1,660
State:
$2,199
(% of AGI for various income ranges: 5.5% for AGIs below $25k)
Percentage of individuals using paid preparers for their 2012 taxes: 61.0%
Here:
61%
State:
52%
(% for various income ranges: 58.3% for AGIs below $25k, 55.6% for AGIs $25k-50k, 71.4% for AGIs $50k-75k, 75.0% for AGIs $75k-100k, 55.6% for AGIs $100k-200k)
Averages for the 2004 tax year for zip code 20608, filed in 2005:
Average Adjusted Gross Income (AGI) in 2004: $49,720 (Individual Income Tax Returns)
Here:
$49,720
State:
$60,339
Salary/wage: $43,144 (reported on 87.2% of returns)
Here:
$43,144
State:
$52,211
(% of AGI for various income ranges: 78.8% for AGIs below $10k, 77.6% for AGIs $10k-25k, 86.0% for AGIs $25k-50k, 77.6% for AGIs $50k-75k, 81.8% for AGIs $75k-100k, 65.1% for AGIs over 100k)
Taxable interest for individuals: $1,228 (reported on 39.9% of returns)
This zip code:
$1,228
Maryland:
$1,701
(% of AGI for various income ranges: 0.7% for AGIs below $10k, 0.8% for AGIs $10k-25k, 0.2% for AGIs $25k-50k, 0.2% for AGIs $50k-75k, 0.6% for AGIs $75k-100k, 2.1% for AGIs over 100k)
Taxable dividends: $2,500 (reported on 12.1% of returns)
Here:
$2,500
State:
$4,235
(% of AGI for various income ranges: 1.1% for AGIs $10k-25k, 0.2% for AGIs $50k-75k, 1.4% for AGIs over 100k)
Net capital gain/loss: +$553 (reported on 8.9% of returns)
Here:
+$553
State:
+$15,888
(% of AGI for various income ranges: -0.5% for AGIs $10k-25k, -0.2% for AGIs $50k-75k, 0.5% for AGIs over 100k)
Profit/loss from business: +$7,826 (reported on 10.7% of returns)
Here:
+$7,826
State:
+$12,221
Total itemized deductions: $20,816 (27% of AGI, reported on 46.9% of returns)
Here:
$20,816
State:
$22,960
Here:
27.0% of AGI
State:
23.3% of AGI
(% of AGI for various income ranges: 16.6% for AGIs $10k-25k, 22.0% for AGIs $25k-50k, 21.9% for AGIs $50k-75k, 22.6% for AGIs $75k-100k, 16.9% for AGIs over 100k)
Charity contributions deductions: $3,643 (5% of AGI, reported on 42.4% of returns)
Here:
$3,643
State:
$4,031
Here:
4.6% of AGI
State:
3.9% of AGI
(% of AGI for various income ranges: 2.0% for AGIs $10k-25k, 4.2% for AGIs $25k-50k, 2.8% for AGIs $50k-75k, 3.7% for AGIs $75k-100k, 2.7% for AGIs over 100k)
Total tax: $6,864 (reported on 78.8% of returns)
20608:
$6,864
State:
$10,167
(% of AGI for various income ranges: 1.1% for AGIs below $10k, 3.8% for AGIs $10k-25k, 6.6% for AGIs $25k-50k, 9.1% for AGIs $50k-75k, 9.9% for AGIs $75k-100k, 16.7% for AGIs over 100k)
Earned income credit: $1,660 (reported on 11.7% of returns)
Here:
$1,660
State:
$1,700
Percentage of individuals using paid preparers for their 2004 taxes: 64.6%
Here:
65%
State:
55%
(% for various income ranges: 55.4% for AGIs below $10k, 68.5% for AGIs $10k-25k, 60.2% for AGIs $25k-50k, 68.6% for AGIs $50k-75k, 78.9% for AGIs $75k-100k, 63.0% for AGIs over 100k)
Household received Food Stamps/SNAP in the past 12 months: 22 Household did not receive Food Stamps/SNAP in the past 12 months: 222
Women who had a birth in the past 12 months: 31 (31 now married, 0 unmarried) Women who did not have a birth in the past 12 months: 46 (20 now married, 25 unmarried)
Housing units in zip code 20608 with a mortgage: 127 (12 second mortgage, 6 both second mortgage and home equity loan) Median monthly owner costs for units with a mortgage: $1,779 Median monthly owner costs for units without a mortgage: $769
Residents with income below the poverty level in 2022:
This zip code:
6.9%
Whole state:
9.6%
Residents with income below 50% of the poverty level in 2022:
This zip code:
5.8%
Whole state:
4.7%
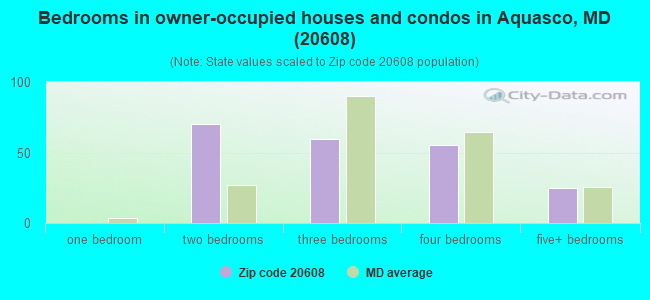
Median number of rooms in houses and condos:
Here:
7.0
State:
7.3
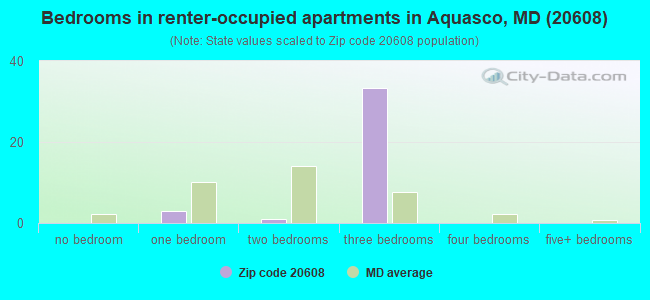
Median number of rooms in apartments:
Here:
5.8
State:
4.2
Notable locations in this zip code not listed on our city pages
Churches in zip code 20608 include: Saint Dominics Catholic Church (A), Saint Marys Episcopal Church (B), John Wesley Church (C). Display/hide their locations on the map
Size of family households: 87 2-persons, 43 3-persons, 9 4-persons, 23 5-persons, 6 7-or-more-persons
Size of nonfamily households: 66 1-person, 9 2-persons
142 married couples with children.
3 single-parent households (3 men).
97.7% of residents of 20608 zip code speak English at home.
1.9% of residents speak other Indo-European language at home (100% very well).
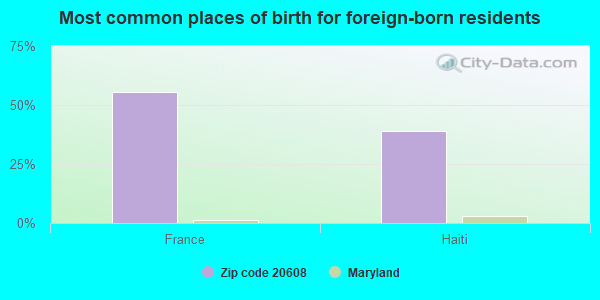
Foreign born population: 18 (3.0%) (41.3% of them are naturalized citizens)
This zip code:
3.0%
Whole state:
16.7%
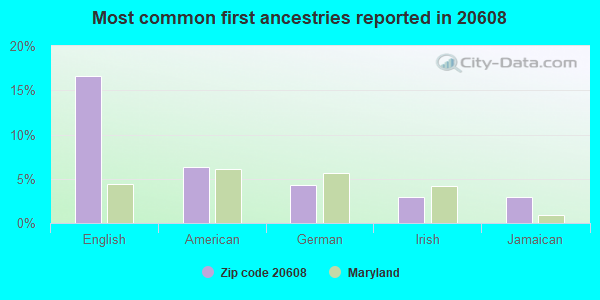
56%France
39%Haiti
17%English
6%American
4%German
3%Irish
3%Jamaican
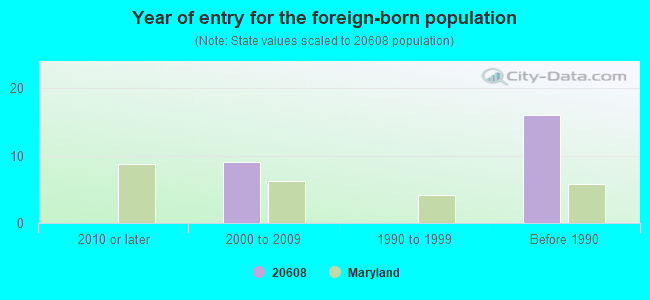
Year of entry for the foreign-born population
02010 or later
92000 to 2009
01990 to 1999
16Before 1990
Facilities with environmental interests located in this zip code:
MIRANT CHALK POINT LLC (25100 CHALK POINT ROAD in AQUASCO, MD)
AIR MAJOR (AIRS/AFS) AIR MINOR (AIRS/AFS) AIR PROGRAM (Clean Air Markets Division Business System) OIL CONTROL (Facility Response Plan for oil discharge) (Integrated Compliance Information System) - ICIS-03-1988-0334, FORMAL ENFORCEMENT ACTION, ICIS-03-1987-0716, ICIS-03-1986-0134, ICIS-03-2000-0227, ICIS-03-2000-0226, ENFORCEMENT/COMPLIANCE ACTIVITY (Integrated Compliance Information System) STATE MASTER (Maryland Permits tracking) - National Pollutant Discharge Elimination System Permit, NPDES MAJOR, OIL CONTROL STATE MASTER (Maryland Permits tracking) - OIL CONTROL STATE MASTER (Maryland Air Emissions Database) - AIR MAJOR STATE MASTER (Maryland Air Emissions Database) - AIR MINOR COMPLIANCE ACTIVITY (Tracking inspections of insecticide, fungicide, and rodenticide, and toxic substances) CRITERIA AND HAZARDOUS AIR POLLUTANT INVENTORY (Inventory of air pollution sources) National Pollutant Discharge Elimination System MAJOR (Tracking pollutant discharge elimination systems) - permit AIR MAJOR ("Best Available" air pollution technologies tracking) HAZARDOUS WASTE BIENNIAL REPORTER (Resource Conservation and Recovery Act (tracking hazardous waste)) Large Quantity Generators, more that 1000 kg of hazardous waste/month (Resource Conservation and Recovery Act (tracking hazardous waste)) - notification USED OIL PROGRAM (Resource Conservation and Recovery Act (tracking hazardous waste)) TRI REPORTER (Tracking of toxic chemicals releasing facilities) Business SIC classification: ELECTRIC SERVICES; NATURAL GAS DISTRIBUTION; ELECTRIC AND OTHER SERVICES COMBINED Business NAICS classification: FOSSIL FUEL ELECTRIC POWER GENERATION.; FOSSIL FUEL ELECTRIC POWER GENERATION. Organizations: MIRANT CHALK POINT, LLC (CONTACT/GENERAL)
, MIRANT MID-ATLANTIC, LLC (CONTACT/OPERATOR)
, SOUTH MARYLAND ELECTRIC COOPERATIVE (CONTACT/OPERATOR)
, MIRANT MID-ATLANTIC, LLC (CONTACT/OWNER)
, SOUTH MARYLAND ELECTRIC COOPERATIVE (CONTACT/OWNER)
, MIRANT MID-ATLANTIC, LLC (OWNER/OPERATOR)
, SOUTH MARYLAND ELECTRIC COOPERATIVE (OWNER/OPERATOR)
Alternative names: CHALK POINT GENERATING STATION , MIRANT - CHALK POINT, MIRANT CHALK POINT L.L.C., MIRANT MID-ATLANTIC CHALK POINT LLC, PEPCO - CHALK POINT PLANT, PEPCO CHALK POINT GEN. STATION, PEPCO - CHALK POINT PLANT, PEPCO'S CHALK POINT SWITCHYARD FACILITY, POTOMAC ELECTRIC POWER CO, POTOMAC ELECTRIC POWER CO. (CHALK POINT), POTOMAC ELECTRIC POWER COMPANY CHALK POINT SWITCHYARD FACILITY, SMECO - CHALK POINT, SOUTHERN ENERGY MID-ATLANTIC, SOUTHERN MARYLAND ELECTRIC COOPERATIVE (SMECO), SOUTHERN MARYLAND ELECTRIC COOPERATIVE (SMECO), WASHINGTON GAS - CHALK POINT STATION
Housing units lacking complete plumbing facilities: 3.1% Housing units lacking complete kitchen facilities: 3.4%
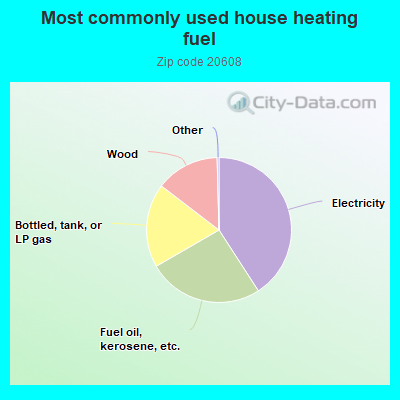
41.2%Electricity
26.0%Fuel oil, kerosene, etc.
18.9%Bottled, tank, or LP gas
14.3%Wood
Population in 1990: 939. Population change in the 1990s: +76 (+8.1%).
Place of birth for U.S.-born residents:
This state: 356
Northeast: 23
Midwest: 5
South: 176
West: 5
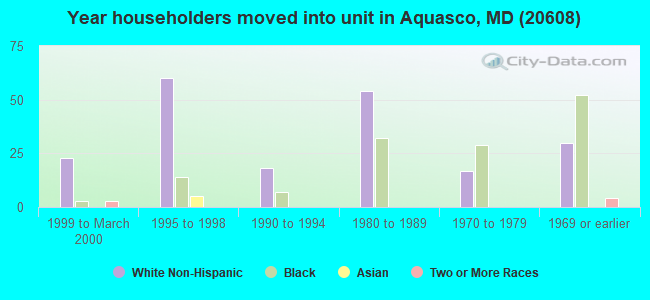
76% of the 20608 zip code residents lived in the same house 5 years ago. Out of people who lived in different houses, 70% lived in this county. Out of people who lived in different counties, 50% lived in Maryland.
98% of the 20608 zip code residents lived in the same house 1 year ago. Out of people who lived in different houses, 129% moved from this county.
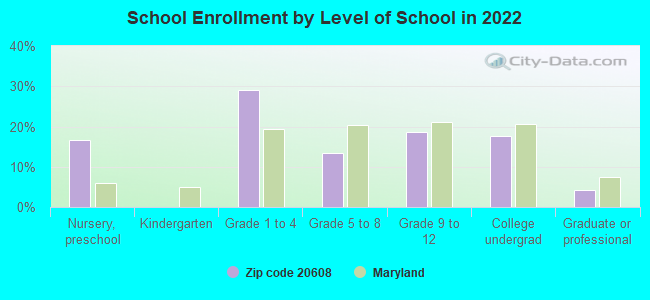
Private vs. public school enrollment:
Students in private schools in grades 1 to 8 (elementary and middle school): 22
Here:
50.3%
Maryland:
15.2%
Students in private schools in grades 9 to 12 (high school):
Here:
0.0%
Maryland:
14.4%
Students in private undergraduate colleges: 10
Here:
60.5%
Maryland:
20.2%
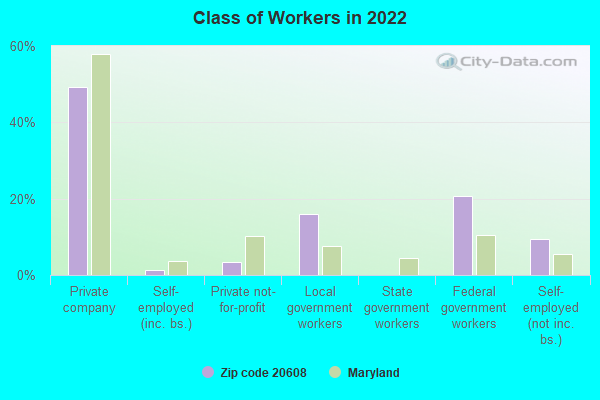
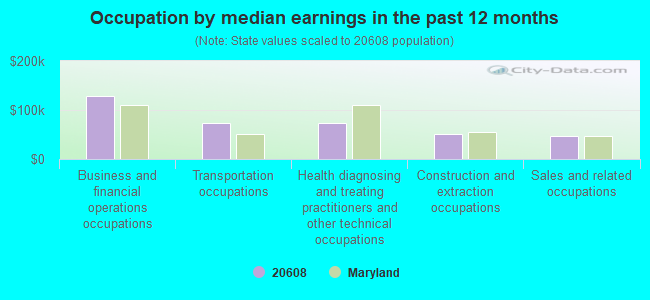
Occupation by median earnings in the past 12 months ($)
128,897Business and financial operations occupations
73,776Transportation occupations
73,093Health diagnosing and treating practitioners and other technical occupations
51,929Construction and extraction occupations
46,597Sales and related occupations
Top industries in this zip code by the number of employees in 2005:
Utilities: Fossil Fuel Electric Power Generation (100-249 employees: 1 establishment)
Administrative and Support and Waste Management and Remediation Services: Locksmiths (5-9: 1)
Other Services (except Public Administration): Pet Care (except Veterinary) Services (1-4: 1)
Construction: Residential Remodelers (1-4: 1)
Professional, Scientific, and Technical Services: Administrative Management and General Management Consulting Services (1-4: 1)
Construction: Commercial and Institutional Building Construction (1-4: 1)
Other Services (except Public Administration): Funeral Homes and Funeral Services (1-4: 1)
Fatal accident statistics in 2014:
Fatal accident count: 1
Vehicles involved in fatal accidents: 3
Fatal accidents caused by drunken drivers: 0
Fatalities: 1
Persons involved in fatal accidents: 3
Pedestrians involved in fatal accidents: 0
Home Mortgage Disclosure Act Aggregated Statistics For Year 2009 (Based on 2 partial tracts)
A) FHA, FSA/RHS & VA Home Purchase Loans
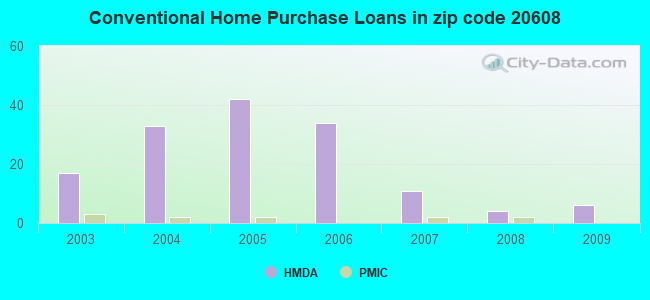
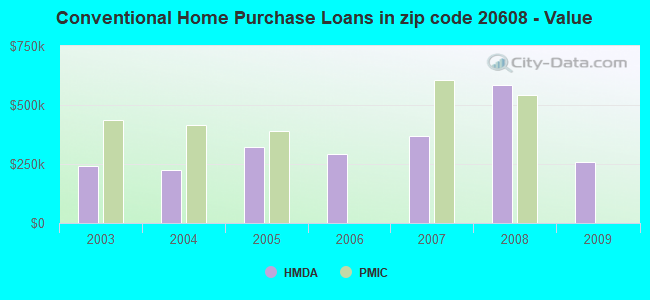
B) Conventional Home Purchase Loans
C) Refinancings
D) Home Improvement Loans
F) Non-occupant Loans on < 5 Family Dwellings (A B C & D)
Number
Average Value
Number
Average Value
Number
Average Value
Number
Average Value
Number
Average Value
LOANS ORIGINATED
9
$236,758
6
$260,067
32
$260,743
2
$38,540
6
$175,275
APPLICATIONS APPROVED, NOT ACCEPTED
0
$0
1
$526,370
0
$0
0
$0
0
$0
APPLICATIONS DENIED
2
$275,300
0
$0
18
$365,231
2
$170,685
2
$63,870
APPLICATIONS WITHDRAWN
0
$0
0
$0
11
$305,633
1
$264,290
1
$93,600
FILES CLOSED FOR INCOMPLETENESS
0
$0
0
$0
1
$302,830
0
$0
0
$0
Aggregated Statistics For Year 2008 (Based on 2 partial tracts)
A) FHA, FSA/RHS & VA Home Purchase Loans
B) Conventional Home Purchase Loans
C) Refinancings
D) Home Improvement Loans
F) Non-occupant Loans on < 5 Family Dwellings (A B C & D)
G) Loans On Manufactured Home Dwelling (A B C & D)
Number
Average Value
Number
Average Value
Number
Average Value
Number
Average Value
Number
Average Value
Number
Average Value
LOANS ORIGINATED
3
$350,917
4
$585,838
36
$276,187
3
$142,053
1
$165,180
0
$0
APPLICATIONS APPROVED, NOT ACCEPTED
1
$288,510
0
$0
7
$300,156
0
$0
0
$0
0
$0
APPLICATIONS DENIED
1
$291,820
7
$291,346
19
$338,648
12
$133,521
0
$0
2
$183,350
APPLICATIONS WITHDRAWN
2
$321,000
3
$269,793
11
$286,112
4
$146,185
1
$88,100
0
$0
FILES CLOSED FOR INCOMPLETENESS
0
$0
1
$88,100
3
$709,173
0
$0
1
$88,100
0
$0
Aggregated Statistics For Year 2007 (Based on 2 partial tracts)
B) Conventional Home Purchase Loans
C) Refinancings
D) Home Improvement Loans
F) Non-occupant Loans on < 5 Family Dwellings (A B C & D)
Number
Average Value
Number
Average Value
Number
Average Value
Number
Average Value
LOANS ORIGINATED
11
$368,502
72
$363,702
12
$100,392
7
$195,541
APPLICATIONS APPROVED, NOT ACCEPTED
2
$569,870
8
$302,830
1
$18,720
4
$267,592
APPLICATIONS DENIED
6
$416,070
67
$380,424
12
$84,792
18
$289,371
APPLICATIONS WITHDRAWN
2
$676,685
25
$456,470
1
$660,720
0
$0
FILES CLOSED FOR INCOMPLETENESS
0
$0
3
$357,523
0
$0
0
$0
Aggregated Statistics For Year 2006 (Based on 2 partial tracts)
A) FHA, FSA/RHS & VA Home Purchase Loans
B) Conventional Home Purchase Loans
C) Refinancings
D) Home Improvement Loans
F) Non-occupant Loans on < 5 Family Dwellings (A B C & D)
G) Loans On Manufactured Home Dwelling (A B C & D)
Number
Average Value
Number
Average Value
Number
Average Value
Number
Average Value
Number
Average Value
Number
Average Value
LOANS ORIGINATED
2
$230,150
34
$293,308
111
$321,878
14
$133,009
17
$201,196
0
$0
APPLICATIONS APPROVED, NOT ACCEPTED
0
$0
11
$292,519
10
$381,235
2
$164,080
3
$347,247
0
$0
APPLICATIONS DENIED
0
$0
39
$262,763
41
$368,714
21
$205,400
3
$381,383
2
$34,135
APPLICATIONS WITHDRAWN
0
$0
6
$217,853
30
$250,560
1
$589,140
0
$0
0
$0
FILES CLOSED FOR INCOMPLETENESS
0
$0
8
$287,138
4
$188,855
0
$0
0
$0
0
$0
Aggregated Statistics For Year 2005 (Based on 2 partial tracts)
A) FHA, FSA/RHS & VA Home Purchase Loans
B) Conventional Home Purchase Loans
C) Refinancings
D) Home Improvement Loans
F) Non-occupant Loans on < 5 Family Dwellings (A B C & D)
Number
Average Value
Number
Average Value
Number
Average Value
Number
Average Value
Number
Average Value
LOANS ORIGINATED
1
$231,250
42
$322,442
74
$262,294
12
$62,952
3
$206,290
APPLICATIONS APPROVED, NOT ACCEPTED
0
$0
7
$202,149
19
$244,756
3
$72,680
1
$220,240
APPLICATIONS DENIED
0
$0
19
$312,567
52
$283,919
9
$90,053
1
$247,770
APPLICATIONS WITHDRAWN
0
$0
7
$443,941
37
$280,598
1
$440,480
3
$280,807
FILES CLOSED FOR INCOMPLETENESS
0
$0
1
$308,340
3
$197,113
2
$63,320
0
$0
Aggregated Statistics For Year 2004 (Based on 2 partial tracts)
A) FHA, FSA/RHS & VA Home Purchase Loans
B) Conventional Home Purchase Loans
C) Refinancings
D) Home Improvement Loans
F) Non-occupant Loans on < 5 Family Dwellings (A B C & D)
G) Loans On Manufactured Home Dwelling (A B C & D)
Number
Average Value
Number
Average Value
Number
Average Value
Number
Average Value
Number
Average Value
Number
Average Value
LOANS ORIGINATED
2
$315,495
33
$223,610
75
$238,549
14
$173,360
6
$124,068
0
$0
APPLICATIONS APPROVED, NOT ACCEPTED
0
$0
7
$311,797
19
$187,030
8
$26,980
1
$515,360
0
$0
APPLICATIONS DENIED
1
$170,690
4
$341,372
33
$155,302
6
$67,907
0
$0
1
$170,690
APPLICATIONS WITHDRAWN
0
$0
4
$392,028
28
$211,588
2
$226,295
2
$285,210
0
$0
FILES CLOSED FOR INCOMPLETENESS
0
$0
0
$0
3
$163,343
0
$0
0
$0
0
$0
Aggregated Statistics For Year 2003 (Based on 2 partial tracts)
A) FHA, FSA/RHS & VA Home Purchase Loans
B) Conventional Home Purchase Loans
C) Refinancings
D) Home Improvement Loans
F) Non-occupant Loans on < 5 Family Dwellings (A B C & D)
Detailed PMIC statistics for the following Tracts:8009.00
2002 - 2017 National Fire Incident Reporting System (NFIRS) incidents
Based on the data from the years 2002 - 2017 the average number of fire incidents per year is 8. The highest number of reported fires - 16 took place in 2005, and the least - 1 in 2015. The data has a dropping trend.
When looking into fire subcategories, the most incidents belonged to: Structure Fires (63.8%), and Outside Fires (28.3%).
Fire incident types reported to NFIRS in Zip Code 20608


 Nearest zip codes: 20637, 20612, 20639, 20678, 20736, 20613.
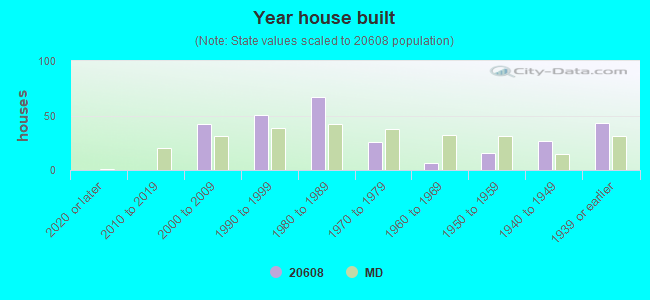


 Based on the data from the years 2002 - 2017 the average number of fire incidents per year is 8. The highest number of reported fires - 16 took place in 2005, and the least - 1 in 2015. The data has a dropping trend.
 When looking into fire subcategories, the most incidents belonged to: Structure Fires (63.8%), and Outside Fires (28.3%).