Estimated zip code population in 2022: 8,043 Zip code population in 2010: 8,848 Zip code population in 2000: 7,965
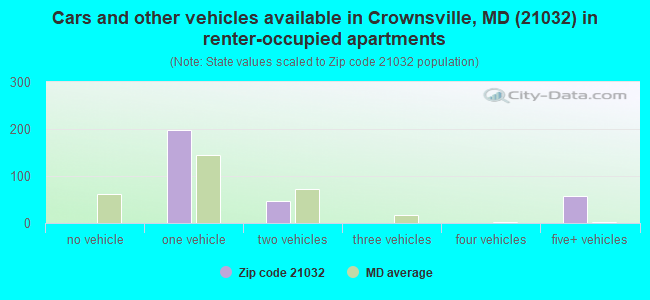
Houses and condos: 3,270 Renter-occupied apartments: 300
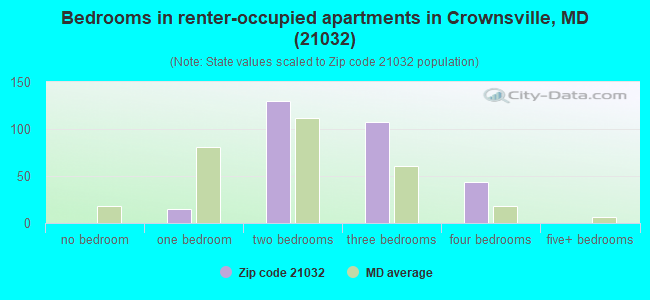
% of renters here:
10%
State:
32%
March 2022 cost of living index in zip code 21032: 109.5 (more than average, U.S. average is 100)
Land area: 17.6 sq. mi. Water area: 1.7 sq. mi.
Population density: 456 people per square mile
(low).
OSM Map
General Map
Google Map
MSN Map
OSM Map
General Map
Google Map
MSN Map
OSM Map
General Map
Google Map
MSN Map
OSM Map
General Map
Google Map
MSN Map
Please wait while loading the map...
Real estate property taxes paid for housing units in 2022:
This zip code:
0.7% ($4,660)
Maryland:
0.9% ($3,777)
Median real estate property taxes paid for housing units with mortgages in 2022: $4,551 (0.7%) Median real estate property taxes paid for housing units with no mortgage in 2022: $4,929 (0.8%)
Business Search- 14 Million verified businesses
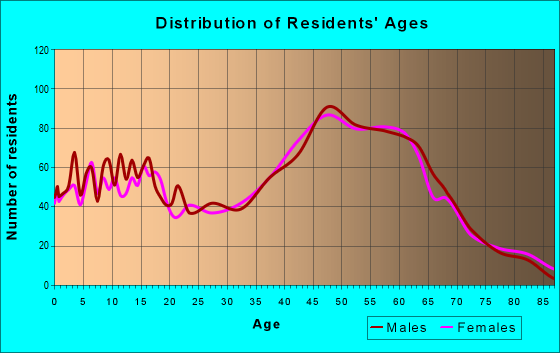
Males: 4,203
(52.3%)
Females: 3,840
(47.7%)
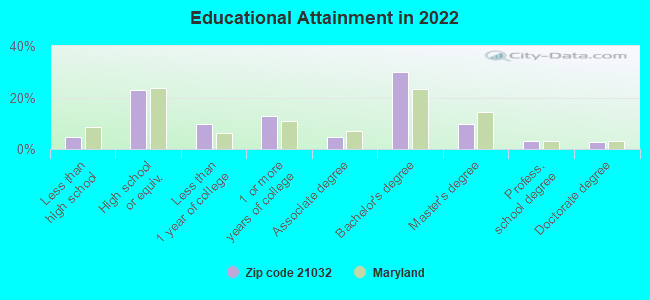
For population 25 years and over in 21032:
High school or higher: 95.1%
Bachelor's degree or higher: 45.1%
Graduate or professional degree: 15.4%
Unemployed: 1.9%
Mean travel time to work (commute): 26.3 minutes
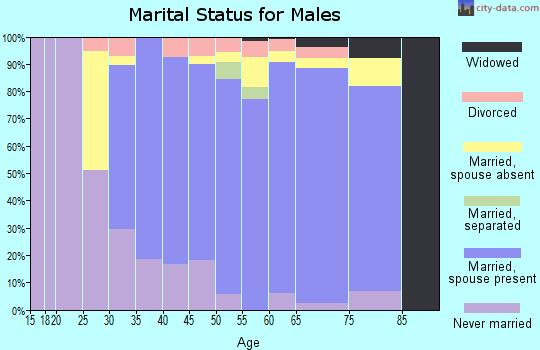
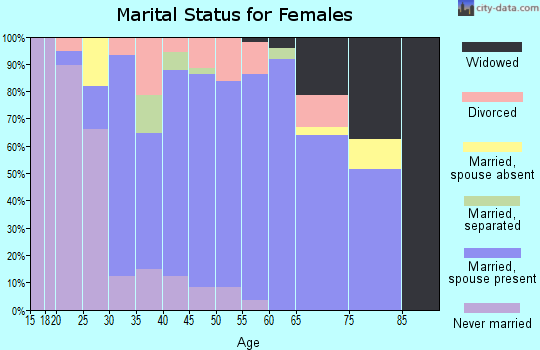
For population 15 years and over in 21032:
Never married: 22.5%
Now married: 64.3%
Separated: 0.2%
Widowed: 5.3%
Divorced: 7.7%
Zip code 21032 compared to state average:
Median house value above state average.
Unemployed percentage below state average.
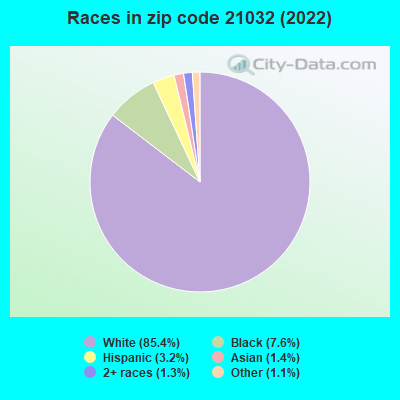
Black race population percentage significantly below state average.
Hispanic race population percentage significantly below state average.
Median age significantly above state average.
Foreign-born population percentage significantly below state average.
Renting percentage significantly below state average.
Length of stay since moving in significantly above state average.
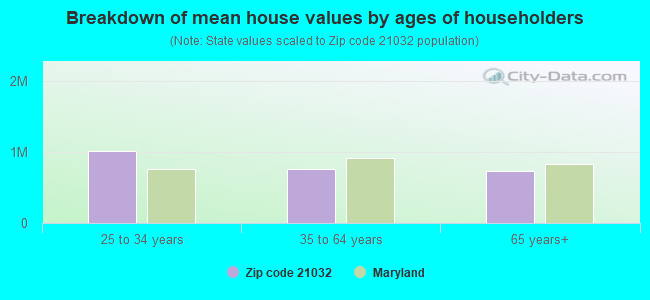
Estimated median house/condo value in 2022: $633,298
21032:
$633,298
Maryland:
$398,100
According to our research of Maryland and other state lists, there were 4 registered sex offenders living in 21032 zip code as of April 27, 2024. The ratio of all residents to sex offenders in zip code 21032 is 2,337 to 1. The ratio of registered sex offenders to all residents in this zip code is much lower than the state average.
Median resident age:
This zip code:
52.3 years
Maryland median age:
39.7 years
Average household size:
This zip code:
2.5 people
Maryland:
2.5 people
Averages for the 2020 tax year for zip code 21032, filed in 2021:
Average Adjusted Gross Income (AGI) in 2020: $150,753 (Individual Income Tax Returns)
Here:
$150,753
State:
$86,905
Salary/wage: $116,303 (reported on 79.1% of returns)
Here:
$116,303
State:
$73,953
(% of AGI for various income ranges: 1143.3% for AGIs below $25k, 3736.2% for AGIs $25k-50k, 6702.6% for AGIs $50k-75k, 8761.7% for AGIs $75k-100k, 19373.4% for AGIs $100k-200k, 93096.0% for AGIs over 200k)
Taxable interest for individuals: $2,551 (reported on 54.4% of returns)
This zip code:
$2,551
Maryland:
$1,528
(% of AGI for various income ranges: 22.4% for AGIs below $25k, 38.5% for AGIs $25k-50k, 88.5% for AGIs $50k-75k, 83.8% for AGIs $75k-100k, 195.7% for AGIs $100k-200k, 1725.2% for AGIs over 200k)
Ordinary dividends: $10,244 (reported on 35.9% of returns)
Here:
$10,244
State:
$8,028
(% of AGI for various income ranges: 36.2% for AGIs below $25k, 61.0% for AGIs $25k-50k, 219.4% for AGIs $50k-75k, 277.2% for AGIs $75k-100k, 482.4% for AGIs $100k-200k, 4743.2% for AGIs over 200k)
Net capital gain/loss in AGI: +$32,539 (reported on 33.0% of returns)
Here:
+$32,539
State:
+$25,238
(% of AGI for various income ranges: 26.0% for AGIs below $25k, 78.3% for AGIs $25k-50k, 173.8% for AGIs $50k-75k, 146.9% for AGIs $75k-100k, 601.0% for AGIs $100k-200k, 17514.4% for AGIs over 200k)
Profit/loss from business: +$23,477 (reported on 21.1% of returns)
Here:
+$23,477
State:
+$11,398
(% of AGI for various income ranges: 217.6% for AGIs below $25k, 235.0% for AGIs $25k-50k, 295.0% for AGIs $50k-75k, 474.5% for AGIs $75k-100k, 747.6% for AGIs $100k-200k, 5399.2% for AGIs over 200k)
Taxable individual retirement arrangement distribution: $26,241 (reported on 12.3% of returns)
21032:
$26,241
Maryland:
$20,944
(% of AGI for various income ranges: 54.0% for AGIs below $25k, 148.5% for AGIs $25k-50k, 299.7% for AGIs $50k-75k, 349.7% for AGIs $75k-100k, 673.3% for AGIs $100k-200k, 3098.8% for AGIs over 200k)
Self-employed (Keogh) retirement plans: $29,240 (reported on 2.2% of returns)
21032:
$29,240
Maryland:
$29,558
(% of AGI for various income ranges: 104.8% for AGIs $100k-200k, 926.4% for AGIs over 200k)
Total itemized deductions: $36,075 (reported on 30.6% of returns)
Here:
$36,075
State:
$30,672
(% of AGI for various income ranges: 121.5% for AGIs below $25k, 299.6% for AGIs $25k-50k, 875.3% for AGIs $50k-75k, 1344.5% for AGIs $75k-100k, 2366.9% for AGIs $100k-200k, 10974.0% for AGIs over 200k)
Charity contributions: $12,164 (reported on 25.3% of returns)
Here:
$12,164
State:
$9,065
(% of AGI for various income ranges: 16.9% for AGIs below $25k, 30.4% for AGIs $25k-50k, 106.8% for AGIs $50k-75k, 163.8% for AGIs $75k-100k, 383.8% for AGIs $100k-200k, 4274.4% for AGIs over 200k)
Taxes paid: $9,037 (reported on 30.6% of returns)
21032:
$9,037
State:
$8,475
(% of AGI for various income ranges: 20.7% for AGIs below $25k, 76.7% for AGIs $25k-50k, 260.6% for AGIs $50k-75k, 438.3% for AGIs $75k-100k, 789.0% for AGIs $100k-200k, 2138.8% for AGIs over 200k)
Earned income credit: $1,560 (reported on 5.5% of returns)
Here:
$1,560
State:
$2,151
(% of AGI for various income ranges: 48.4% for AGIs below $25k, 25.8% for AGIs $25k-50k)
Percentage of individuals using paid preparers for their 2020 taxes: 91.4%
Here:
91%
State:
90%
(% for various income ranges: 88.0% for AGIs below $25k, 92.5% for AGIs $25k-50k, 90.7% for AGIs $50k-75k, 90.9% for AGIs $75k-100k, 93.6% for AGIs $100k-200k, 92.0% for AGIs over 200k)
Averages for the 2012 tax year for zip code 21032, filed in 2013:
Average Adjusted Gross Income (AGI) in 2012: $133,000 (Individual Income Tax Returns)
Here:
$133,000
State:
$72,703
Salary/wage: $104,831 (reported on 83.1% of returns)
Here:
$104,831
State:
$62,228
(% of AGI for various income ranges: 73.0% for AGIs below $25k, 74.6% for AGIs $25k-50k, 67.2% for AGIs $50k-75k, 74.9% for AGIs $75k-100k, 75.5% for AGIs $100k-200k, 59.3% for AGIs over 200k)
Taxable interest for individuals: $2,079 (reported on 57.3% of returns)
This zip code:
$2,079
Maryland:
$1,413
(% of AGI for various income ranges: 1.1% for AGIs below $25k, 0.8% for AGIs $25k-50k, 1.1% for AGIs $50k-75k, 1.2% for AGIs $75k-100k, 0.7% for AGIs $100k-200k, 0.9% for AGIs over 200k)
Ordinary dividends: $6,796 (reported on 36.2% of returns)
Here:
$6,796
State:
$6,933
(% of AGI for various income ranges: 1.9% for AGIs below $25k, 1.1% for AGIs $25k-50k, 1.9% for AGIs $50k-75k, 2.3% for AGIs $75k-100k, 1.9% for AGIs $100k-200k, 1.8% for AGIs over 200k)
Net capital gain/loss in AGI: +$15,548 (reported on 29.2% of returns)
Here:
+$15,548
State:
+$14,830
(% of AGI for various income ranges: 0.3% for AGIs below $25k, 0.2% for AGIs $25k-50k, 0.1% for AGIs $50k-75k, 0.6% for AGIs $75k-100k, 1.8% for AGIs $100k-200k, 5.1% for AGIs over 200k)
Profit/loss from business: +$26,596 (reported on 17.3% of returns)
Here:
+$26,596
State:
+$12,606
(% of AGI for various income ranges: 6.4% for AGIs below $25k, 3.9% for AGIs $25k-50k, 3.7% for AGIs $50k-75k, 3.1% for AGIs $75k-100k, 2.8% for AGIs $100k-200k, 3.6% for AGIs over 200k)
Taxable individual retirement arrangement distribution: $21,237 (reported on 13.3% of returns)
21032:
$21,237
Maryland:
$17,065
(% of AGI for various income ranges: 2.8% for AGIs below $25k, 3.1% for AGIs $25k-50k, 3.6% for AGIs $50k-75k, 2.4% for AGIs $75k-100k, 2.7% for AGIs $100k-200k, 1.6% for AGIs over 200k)
Self-employment retirement plans: $24,990 (reported on 2.2% of returns)
21032:
$24,990
Maryland:
$24,439
Total itemized deductions: $43,514 (21% of AGI, reported on 58.0% of returns)
Here:
$43,514
State:
$27,886
Here:
21.1% of AGI
State:
22.8% of AGI
(% of AGI for various income ranges: 16.9% for AGIs below $25k, 17.7% for AGIs $25k-50k, 19.0% for AGIs $50k-75k, 22.6% for AGIs $75k-100k, 20.7% for AGIs $100k-200k, 18.0% for AGIs over 200k)
Charity contributions: $8,754 (reported on 50.6% of returns)
Here:
$8,754
State:
$4,452
(% of AGI for various income ranges: 1.1% for AGIs below $25k, 1.3% for AGIs $25k-50k, 2.1% for AGIs $50k-75k, 2.0% for AGIs $75k-100k, 2.0% for AGIs $100k-200k, 4.4% for AGIs over 200k)
Taxes paid: $18,614 (reported on 57.8% of returns)
21032:
$18,614
State:
$11,690
(% of AGI for various income ranges: 3.4% for AGIs below $25k, 4.0% for AGIs $25k-50k, 6.2% for AGIs $50k-75k, 8.0% for AGIs $75k-100k, 8.9% for AGIs $100k-200k, 8.5% for AGIs over 200k)
Earned income credit: $1,500 (reported on 6.3% of returns)
Here:
$1,500
State:
$2,199
(% of AGI for various income ranges: 2.3% for AGIs below $25k, 0.5% for AGIs $25k-50k)
Percentage of individuals using paid preparers for their 2012 taxes: 51.2%
Here:
51%
State:
52%
(% for various income ranges: 41.7% for AGIs below $25k, 48.7% for AGIs $25k-50k, 50.9% for AGIs $50k-75k, 52.2% for AGIs $75k-100k, 53.1% for AGIs $100k-200k, 67.7% for AGIs over 200k)
Averages for the 2004 tax year for zip code 21032, filed in 2005:
Average Adjusted Gross Income (AGI) in 2004: $95,888 (Individual Income Tax Returns)
Here:
$95,888
State:
$60,339
Salary/wage: $79,319 (reported on 84.7% of returns)
Here:
$79,319
State:
$52,211
(% of AGI for various income ranges: 189.0% for AGIs below $10k, 72.9% for AGIs $10k-25k, 79.1% for AGIs $25k-50k, 78.6% for AGIs $50k-75k, 79.5% for AGIs $75k-100k, 66.2% for AGIs over 100k)
Taxable interest for individuals: $1,917 (reported on 63.9% of returns)
This zip code:
$1,917
Maryland:
$1,701
(% of AGI for various income ranges: 28.7% for AGIs below $10k, 1.6% for AGIs $10k-25k, 1.1% for AGIs $25k-50k, 1.3% for AGIs $50k-75k, 1.0% for AGIs $75k-100k, 1.2% for AGIs over 100k)
Taxable dividends: $3,931 (reported on 38.8% of returns)
Here:
$3,931
State:
$4,235
(% of AGI for various income ranges: 15.7% for AGIs below $10k, 1.5% for AGIs $10k-25k, 1.2% for AGIs $25k-50k, 1.3% for AGIs $50k-75k, 1.5% for AGIs $75k-100k, 1.6% for AGIs over 100k)
Net capital gain/loss: +$15,363 (reported on 31.9% of returns)
Here:
+$15,363
State:
+$15,888
(% of AGI for various income ranges: -7.6% for AGIs below $10k, 0.8% for AGIs $10k-25k, 0.2% for AGIs $25k-50k, 0.6% for AGIs $50k-75k, 1.0% for AGIs $75k-100k, 7.0% for AGIs over 100k)
Profit/loss from business: +$21,305 (reported on 17.7% of returns)
Here:
+$21,305
State:
+$12,221
(% of AGI for various income ranges: -7.4% for AGIs below $10k, 7.7% for AGIs $10k-25k, 4.0% for AGIs $25k-50k, 2.9% for AGIs $50k-75k, 2.4% for AGIs $75k-100k, 4.2% for AGIs over 100k)
IRA payment deduction: $3,342 (reported on 3.6% of returns)
21032:
$3,342
Maryland:
$2,968
(% of AGI for various income ranges: 0.3% for AGIs $10k-25k, 0.4% for AGIs $25k-50k, 0.2% for AGIs $50k-75k, 0.2% for AGIs $75k-100k, 0.1% for AGIs over 100k)
Self-employed pension: $18,093 (reported on 2.8% of returns)
Here:
$18,093
Maryland:
$17,155
Total itemized deductions: $30,038 (21% of AGI, reported on 59.7% of returns)
Here:
$30,038
State:
$22,960
Here:
20.7% of AGI
State:
23.3% of AGI
(% of AGI for various income ranges: 32.0% for AGIs below $10k, 16.9% for AGIs $10k-25k, 19.8% for AGIs $25k-50k, 22.9% for AGIs $50k-75k, 23.7% for AGIs $75k-100k, 17.4% for AGIs over 100k)
Charity contributions deductions: $4,006 (3% of AGI, reported on 54.9% of returns)
Here:
$4,006
State:
$4,031
Here:
2.7% of AGI
State:
3.9% of AGI
(% of AGI for various income ranges: 1.9% for AGIs below $10k, 1.4% for AGIs $10k-25k, 1.8% for AGIs $25k-50k, 2.4% for AGIs $50k-75k, 2.7% for AGIs $75k-100k, 2.3% for AGIs over 100k)
Total tax: $19,095 (reported on 84.6% of returns)
21032:
$19,095
State:
$10,167
(% of AGI for various income ranges: 7.2% for AGIs below $10k, 5.2% for AGIs $10k-25k, 7.9% for AGIs $25k-50k, 9.5% for AGIs $50k-75k, 10.2% for AGIs $75k-100k, 20.1% for AGIs over 100k)
Earned income credit: $1,456 (reported on 5.1% of returns)
Here:
$1,456
State:
$1,700
Percentage of individuals using paid preparers for their 2004 taxes: 53.3%
Here:
53%
State:
55%
(% for various income ranges: 49.1% for AGIs below $10k, 47.3% for AGIs $10k-25k, 53.2% for AGIs $25k-50k, 54.2% for AGIs $50k-75k, 54.3% for AGIs $75k-100k, 57.7% for AGIs over 100k)
Likely homosexual households (counted as self-reported same-sex unmarried-partner households)
Lesbian couples: 0.3% of all households
Gay men: 0.4% of all households
Household received Food Stamps/SNAP in the past 12 months: 0 Household did not receive Food Stamps/SNAP in the past 12 months: 3,055
Women who had a birth in the past 12 months: 104 (101 now married, 3 unmarried) Women who did not have a birth in the past 12 months: 1,242 (641 now married, 601 unmarried)
Housing units in zip code 21032 with a mortgage: 1,956 (361 second mortgage, 15 home equity loan, 335 both second mortgage and home equity loan) Houses without a mortgage: 31
Median monthly owner costs for units with a mortgage: $2,564 Median monthly owner costs for units without a mortgage: $798
Residents with income below the poverty level in 2022:
This zip code:
4.0%
Whole state:
9.6%
Residents with income below 50% of the poverty level in 2022:
This zip code:
0.8%
Whole state:
4.7%
Median number of rooms in houses and condos:
Here:
7.3
State:
7.3
Median number of rooms in apartments:
Here:
5.4
State:
4.2
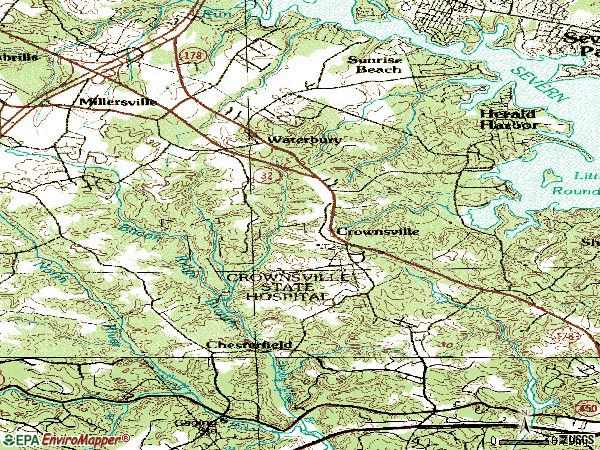
Notable locations in this zip code not listed on our city pages
Notable locations in zip code 21032: Joyces Marina (A), Beehive Beach (B), Whitneys Landing Farm (C), Smiths Marina (D), Crownsville Water Treatment Plant (E), Abington Farm (F), Anne Arundel County Police Department Criminal Investigations Division (G), Herald Harbor Volunteer Fire Department (H). Display/hide their locations on the map
Churches in zip code 21032 include: Saint Marys on the Severn Church (A), Saint Pauls Church (B), Mount Tabor United Methodist Church (C), Saint Stephens Episcopal Church (D), Union of Herald Harbor Presbyterian Church (E). Display/hide their locations on the map
Streams, rivers, and creeks: Old Place Creek (A), Deep Ditch Branch (B), Davids Run (C), Cypress Branch (D), Anne Green Spring Branch (E), Plum Creek (F), Indian Creek Branch (G), Gumbottom Branch (H). Display/hide their locations on the map
Parks in zip code 21032 include: Herald Harbor Park (1), Bacon Ridge Natural Area (2), Arden Park (3), Waterbury Recreation Area (4). Display/hide their locations on the map
In group quarters: 229 (-1 institutionalized population)
Size of family households: 1,243 2-persons, 425 3-persons, 500 4-persons, 222 5-persons, 1 7-or-more-persons
Size of nonfamily households: 593 1-person, 97 2-persons, 7 4-persons
1,118 married couples with children.
68 single-parent households (43 men, 25 women).
90.7% of residents of 21032 zip code speak English at home.
1.6% of residents speak Spanish at home (100% very well).
5.3% of residents speak other Indo-European language at home (90% very well, 4% well, 6% not well).
0.9% of residents speak Asian or Pacific Island language at home (77% very well, 23% well).
0.8% of residents speak other language at home (83% very well, 17% not well).
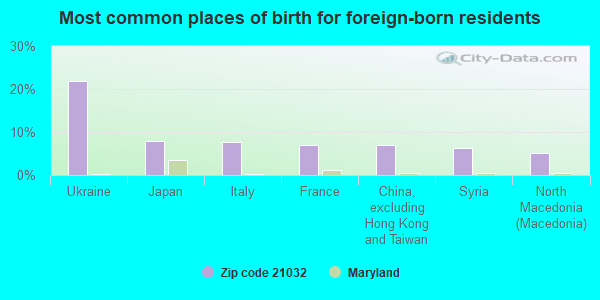
Foreign born population: 445 (5.5%) (79.7% of them are naturalized citizens)
This zip code:
5.5%
Whole state:
16.7%
22%Ukraine
8%Japan
8%Italy
7%France
7%China, excluding Hong Kong and Taiwan
6%Syria
5%North Macedonia (Macedonia)
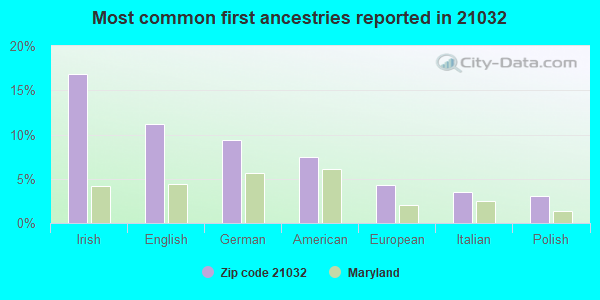
17%Irish
11%English
9%German
7%American
4%European
4%Italian
3%Polish
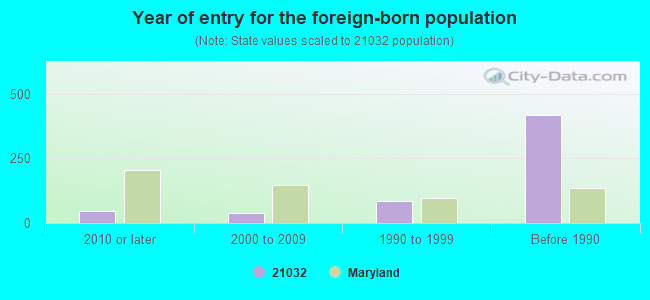
Year of entry for the foreign-born population
472010 or later
372000 to 2009
841990 to 1999
418Before 1990
Facilities with environmental interests located in this zip code:
BLAZING BULL CROWNSVILLE (1021 GENERALS HIGHWAY in CROWNSVILLE, MD)
AIR MINOR (AIRS/AFS) STATE MASTER (Maryland Air Emissions Database) - AIR MINOR Business SIC classification: EATING PLACES
PINE TREE ASSOCIATION (1801 HAWKINS ROAD in CROWNSVILLE, MD)
STATE MASTER (Maryland Permits tracking) - National Pollutant Discharge Elimination System Permit National Pollutant Discharge Elimination System NON-MAJOR (Tracking pollutant discharge elimination systems) - permit Business SIC classification: CIVIC, SOCIAL, AND FRATERNAL ASSOCIATIONS
FAIRFIELD NURSING CENTER (1454 FAIRFIELD LOOP ROAD in CROWNSVILLE, MD)
AIR MINOR (AIRS/AFS) STATE MASTER (Maryland Air Emissions Database) - AIR MINOR Business SIC classification: SKILLED NURSING CARE FACILITIES
AMOCO 1335 GENERALS HIGHWAY (1335 GENERAL'S HIGHWAY in CROWNSVILLE, MD)
AIR MINOR (AIRS/AFS) Conditionally Exempt Small Quantity Generators, less than 100 kg/month of hazardous waste (Resource Conservation and Recovery Act (tracking hazardous waste)) - notification Business SIC classification: GASOLINE SERVICE STATIONS Organizations: MICHAEL L COALE (CONTACT/OWNER)
Alternative names: COALES AMOCO
AACO - DEPARTMENT OF HOUSING & COMMUNITY (100 COMMUNITY PL in CROWNSVILLE, MD)
HAZARDOUS WASTE BIENNIAL REPORTER (Resource Conservation and Recovery Act (tracking hazardous waste)) (Resource Conservation and Recovery Act (tracking hazardous waste))
PROVIDENCE ACADEMY (45 COMMUNITY PLACE in CROWNSVILLE, MD)
ENFORCEMENT/COMPLIANCE ACTIVITY (Integrated Compliance Information System) Conditionally Exempt Small Quantity Generators, less than 100 kg/month of hazardous waste (Resource Conservation and Recovery Act (tracking hazardous waste)) - notification Organizations: ANNE ARUNDEL CO PUBLIC SCHOOLS (CONTACT/OWNER)
Alternative names: MARY E. MOSS ACADEMY
MD DEPT OF HOUSING & COMMUNITY DEV (100 COMMUNITY in CROWNSVILLE, MD)
Conditionally Exempt Small Quantity Generators, less than 100 kg/month of hazardous waste (Resource Conservation and Recovery Act (tracking hazardous waste)) - notification Organizations: STATE OF MARYLAND (CONTACT/OWNER)
Housing units lacking complete plumbing facilities: 0.4% Housing units lacking complete kitchen facilities: 0.4%
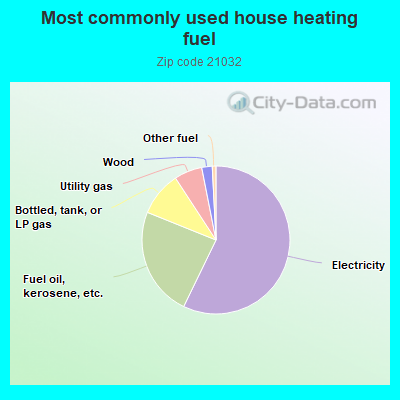
57.2%Electricity
23.9%Fuel oil, kerosene, etc.
9.7%Bottled, tank, or LP gas
6.1%Utility gas
2.3%Wood
0.8%Other fuel
Population in 1990: 7,269. Population change in the 1990s: +696 (+9.6%).
Place of birth for U.S.-born residents:
This state: 4,107
Northeast: 1,278
Midwest: 548
South: 1,203
West: 237
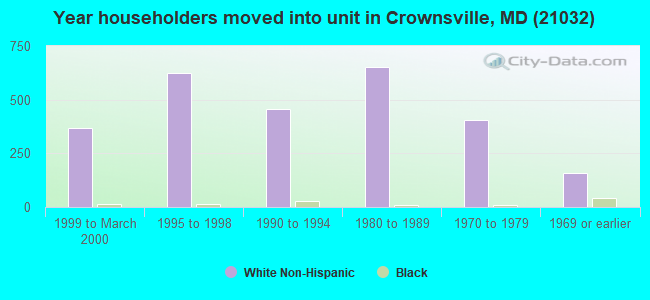
64% of the 21032 zip code residents lived in the same house 5 years ago. Out of people who lived in different houses, 52% lived in this county. Out of people who lived in different counties, 50% lived in Maryland.
95% of the 21032 zip code residents lived in the same house 1 year ago. Out of people who lived in different houses, 22% moved from this county. Out of people who lived in different houses, 42% moved from different county within same state. Out of people who lived in different houses, 45% moved from different state.
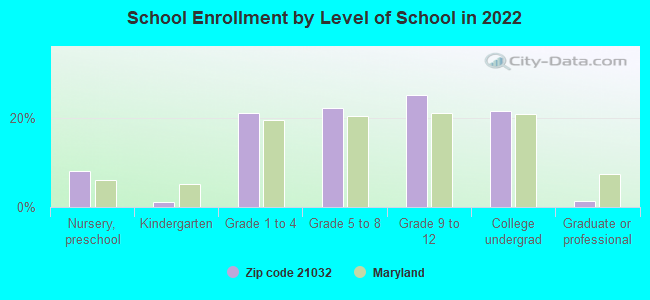
Private vs. public school enrollment:
Students in private schools in grades 1 to 8 (elementary and middle school): 227
Here:
35.9%
Maryland:
15.2%
Students in private schools in grades 9 to 12 (high school): 191
Here:
53.7%
Maryland:
14.4%
Students in private undergraduate colleges: 20
Here:
6.6%
Maryland:
20.2%
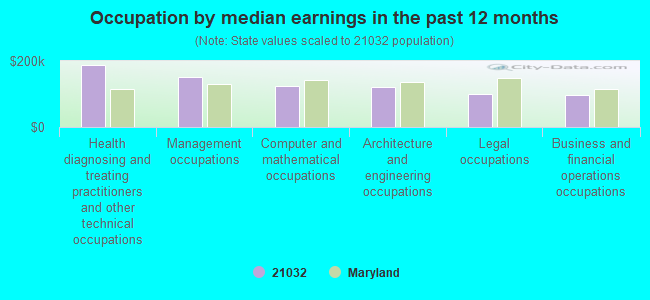
Occupation by median earnings in the past 12 months ($)
189,298Health diagnosing and treating practitioners and other technical occupations
151,305Management occupations
125,628Computer and mathematical occupations
120,914Architecture and engineering occupations
99,983Legal occupations
98,385Business and financial operations occupations
Companies with federal contracts located in this zip code (CROWNSVILLE, MD):
FAIRFIELD NURSING CENTER (1454 FAIRFIELD LOOP ROAD) : $216,286 in 2 contractsfrom 2001 to 2003
$191,286 with Department of Veterans Affairs for Nursing Home Care Contracts. Signed on 2003-10-01. Completion date: 2004-09-30.
$25,000, same as above.Signed on 2001-10-15. Completion date: 2002-09-15.
NORMAN S BULL (1309 ST PAULS WAY; small business) : $174,300 in 3 contractsin 2000
$107,100 with Army for Logistics Support Services. Taking place in VA. Signed on 2000-10-10. Completion date: 2001-10-31.
$42,000 with Army for Lectures For Training. Taking place in VA. Signed on 2000-01-07. Completion date: 2000-01-10.
$25,200, same as above.Signed on 2000-07-07. Completion date: 2000-09-29.
TITAN WELDING & CONSTRUCTION L (2006 COLERIDGE LN; small business) : $51,780 in 2 contractsin 2005
$47,800 with Navy for Maintenance, Repair and Rebuilding of Equipment -- Electric Wire, and Power and Distribution Equipment. Signed on 2005-02-05. Completion date: 2005-03-11.
$3,980, same as above.Signed on 2005-08-08. Completion date: 2006-08-26.
PROFESSIONAL INVENTORY CONTROL (908 BUTTONWOOD TRAIL; small business) : $23,019 in 4 contractsfrom 2003 to 2005
$15,325 with Defense Commissary Agency for Other Management Support Services. Signed on 2005-03-17. Completion date: 2005-05-16.
$4,833, same as above.Signed on 2005-04-04. Completion date: 2005-07-15.
$2,861, same as above.Signed on 2004-12-22. Completion date: 2005-01-22.
$0 with Department of Defense for Other Management Support Services. Signed on 2003-08-15. Completion date: 2004-08-31.
CALVERT UTILITIES INCORPORATED (1686 CROWNSVILLE RD; small business)
$8,000 with Navy for Water Services. Signed on 2003-04-25. Completion date: 2003-04-28.
SHIELDTECH SYSTEMS (823 HOLLYWOOD BLVD; small business)
$7,500 with Army for ADP Components. Signed on 2004-05-10. Completion date: 2004-05-21.
MARYLAND DEPARTMENT OF HOUSING (100 COMMUNITY PL) : $4,423 in 2 contractsin 2005
$3,881 with Army for Construction of Structures and Facilities -- Other Warehouse Buildings. Signed on 2005-07-22. Completion date: 2008-09-30.
$542 with Public Buildings Service for . Signed on 2005-02-14. Completion date: 2005-02-14.
Top industries in this zip code by the number of employees in 2005:
2002 - 2018 National Fire Incident Reporting System (NFIRS) incidents
According to the data from the years 2002 - 2018 the average number of fires per year is 21. The highest number of reported fires - 33 took place in 2007, and the least - 0 in 2008. The data has a dropping trend.
When looking into fire subcategories, the most reports belonged to: Outside Fires (40.1%), and Structure Fires (25.1%).
Fire incident types reported to NFIRS in Zip Code 21032


 Nearest zip codes: 21405, 21108, 21401, 21146, 21140, 21114.
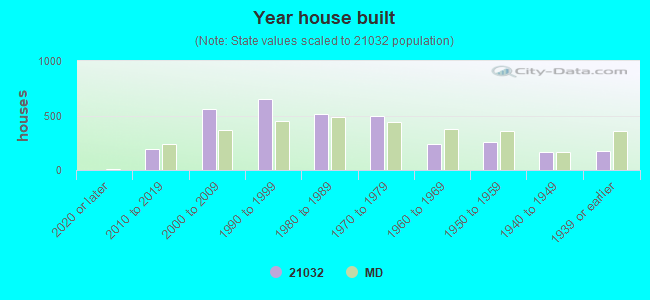


 According to the data from the years 2002 - 2018 the average number of fires per year is 21. The highest number of reported fires - 33 took place in 2007, and the least - 0 in 2008. The data has a dropping trend.
 When looking into fire subcategories, the most reports belonged to: Outside Fires (40.1%), and Structure Fires (25.1%).