Estimated zip code population in 2022: 544 Zip code population in 2010: 700 Zip code population in 2000: 687
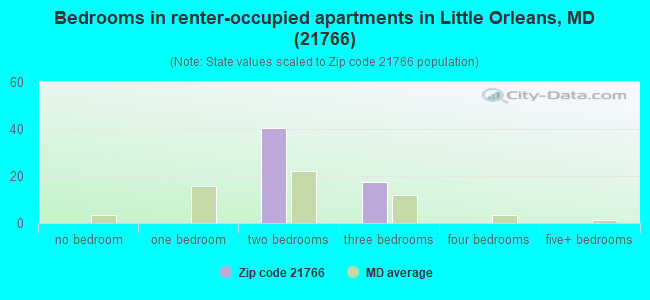
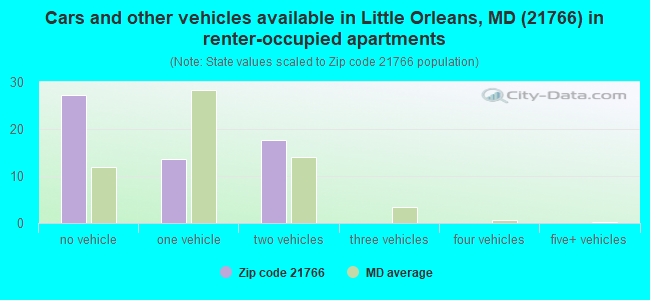
Houses and condos: 516 Renter-occupied apartments: 58
% of renters here:
19%
State:
32%
March 2022 cost of living index in zip code 21766: 91.1 (less than average, U.S. average is 100)
Land area: 37.8 sq. mi. Water area: 0.9 sq. mi.
Population density: 14 people per square mile
(very low).
OSM Map
General Map
Google Map
MSN Map
OSM Map
General Map
Google Map
MSN Map
OSM Map
General Map
Google Map
MSN Map
OSM Map
General Map
Google Map
MSN Map
Please wait while loading the map...
Real estate property taxes paid for housing units in 2022:
This zip code:
0.7% ($1,589)
Maryland:
0.9% ($3,777)
Median real estate property taxes paid for housing units with mortgages in 2022: $895 (0.6%) Median real estate property taxes paid for housing units with no mortgage in 2022: $1,697 (0.7%)
Business Search- 14 Million verified businesses
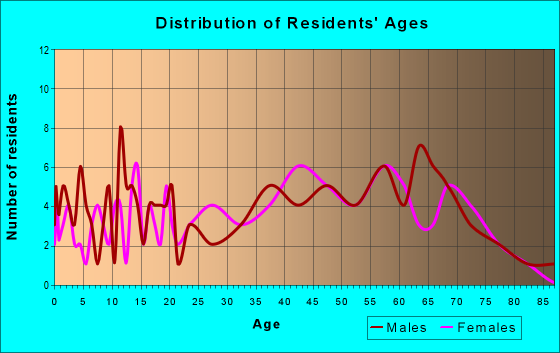
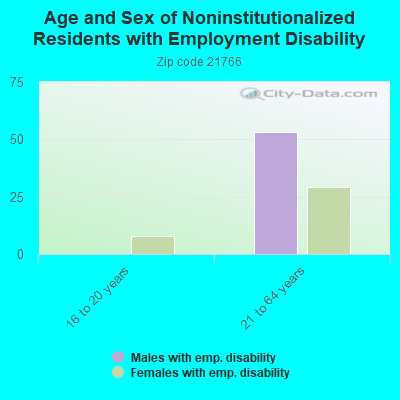
Males: 324
(59.6%)
Females: 220
(40.4%)
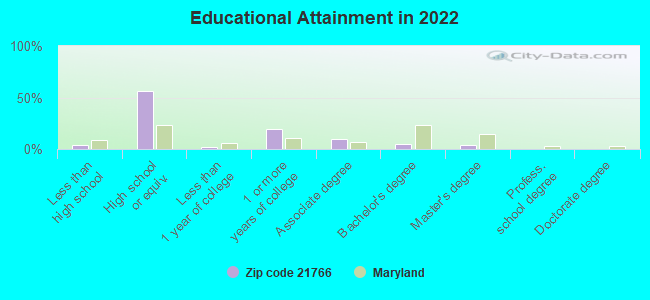
For population 25 years and over in 21766:
High school or higher: 93.9%
Bachelor's degree or higher: 9.1%
Graduate or professional degree: 4.4%
Unemployed: 2.5%
Mean travel time to work (commute): 29.8 minutes
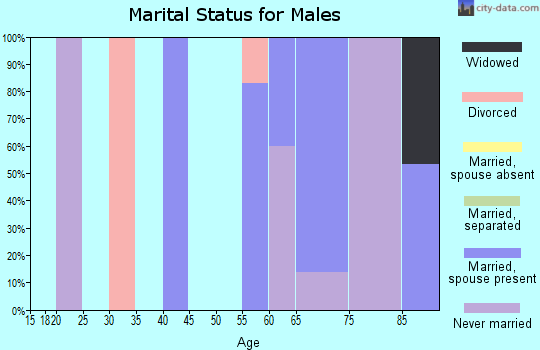
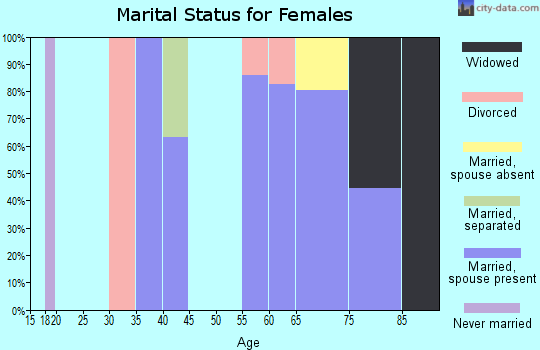
For population 15 years and over in 21766:
Never married: 30.9%
Now married: 50.3%
Separated: 0.0%
Widowed: 10.0%
Divorced: 8.8%
Zip code 21766 compared to state average:
Median household income below state average.
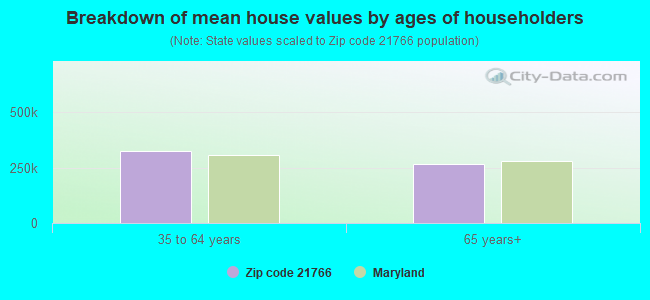
Median house value below state average.
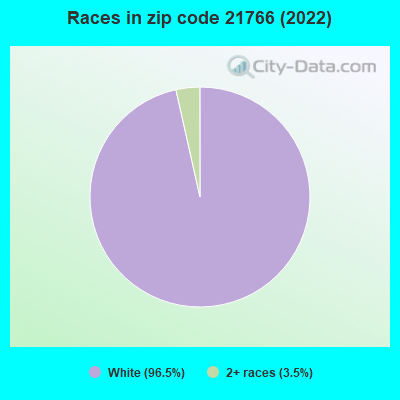
Black race population percentage significantly below state average.
Hispanic race population percentage significantly below state average.
Median age significantly above state average.
Foreign-born population percentage significantly below state average.
Renting percentage below state average.
Length of stay since moving in significantly above state average.
Percentage of population with a bachelor's degree or higher significantly below state average.
Averages for the 2020 tax year for zip code 21766, filed in 2021:
Average Adjusted Gross Income (AGI) in 2020: $48,271 (Individual Income Tax Returns)
Here:
$48,271
State:
$86,905
Salary/wage: $43,532 (reported on 80.6% of returns)
Here:
$43,532
State:
$73,953
(% of AGI for various income ranges: 1005.0% for AGIs below $25k, 3065.0% for AGIs $25k-50k, 4266.0% for AGIs $50k-75k, 19525.0% for AGIs $100k-200k)
Taxable interest for individuals: $411 (reported on 29.0% of returns)
This zip code:
$411
Maryland:
$1,528
(% of AGI for various income ranges: 10.0% for AGIs below $25k, 16.2% for AGIs $25k-50k, 32.0% for AGIs $50k-75k)
Ordinary dividends: $1,000 (reported on 9.7% of returns)
Here:
$1,000
State:
$8,028
(% of AGI for various income ranges: 37.5% for AGIs $25k-50k)
Net capital gain/loss in AGI: +$3,700 (reported on 6.5% of returns)
Here:
+$3,700
State:
+$25,238
(% of AGI for various income ranges: 92.5% for AGIs below $25k)
Profit/loss from business: +$2,950 (reported on 6.5% of returns)
Here:
+$2,950
State:
+$11,398
(% of AGI for various income ranges: 73.8% for AGIs below $25k)
Taxable individual retirement arrangement distribution: $6,350 (reported on 6.5% of returns)
21766:
$6,350
Maryland:
$20,944
(% of AGI for various income ranges: 158.8% for AGIs below $25k)
Earned income credit: $1,700 (reported on 16.1% of returns)
Here:
$1,700
State:
$2,151
(% of AGI for various income ranges: 106.2% for AGIs below $25k)
Percentage of individuals using paid preparers for their 2020 taxes: 100.0%
Here:
100%
State:
90%
(% for various income ranges: 100.0% for AGIs below $25k, 100.0% for AGIs $25k-50k, 100.0% for AGIs $50k-75k, 100.0% for AGIs $75k-100k, 100.0% for AGIs $100k-200k)
Averages for the 2012 tax year for zip code 21766, filed in 2013:
Average Adjusted Gross Income (AGI) in 2012: $40,531 (Individual Income Tax Returns)
Here:
$40,531
State:
$72,703
Salary/wage: $36,235 (reported on 79.3% of returns)
Here:
$36,235
State:
$62,228
(% of AGI for various income ranges: 52.5% for AGIs below $25k, 66.8% for AGIs $25k-50k, 77.7% for AGIs $50k-75k, 74.8% for AGIs $75k-100k)
Taxable interest for individuals: $460 (reported on 34.5% of returns)
This zip code:
$460
Maryland:
$1,413
(% of AGI for various income ranges: 0.5% for AGIs below $25k, 1.1% for AGIs $25k-50k)
Profit/loss from business: +$8,925 (reported on 13.8% of returns)
Here:
+$8,925
State:
+$12,606
Taxable individual retirement arrangement distribution: $9,700 (reported on 6.9% of returns)
21766:
$9,700
Maryland:
$17,065
Total itemized deductions: $15,844 (25% of AGI, reported on 31.0% of returns)
Here:
$15,844
State:
$27,886
Here:
25.2% of AGI
State:
22.8% of AGI
(% of AGI for various income ranges: 14.1% for AGIs $25k-50k, 10.9% for AGIs $50k-75k, 15.3% for AGIs $75k-100k)
Charity contributions: $1,250 (reported on 20.7% of returns)
Here:
$1,250
State:
$4,452
(% of AGI for various income ranges: 1.1% for AGIs $25k-50k, 1.0% for AGIs $75k-100k)
Taxes paid: $6,156 (reported on 31.0% of returns)
21766:
$6,156
State:
$11,690
(% of AGI for various income ranges: 4.4% for AGIs $25k-50k, 4.1% for AGIs $50k-75k, 7.1% for AGIs $75k-100k)
Earned income credit: $2,020 (reported on 17.2% of returns)
Here:
$2,020
State:
$2,199
(% of AGI for various income ranges: 8.2% for AGIs below $25k)
Percentage of individuals using paid preparers for their 2012 taxes: 51.7%
Here:
52%
State:
52%
(% for various income ranges: 50.0% for AGIs below $25k, 50.0% for AGIs $25k-50k, 60.0% for AGIs $50k-75k, 50.0% for AGIs $75k-100k)
Averages for the 2004 tax year for zip code 21766, filed in 2005:
Average Adjusted Gross Income (AGI) in 2004: $34,435 (Individual Income Tax Returns)
Here:
$34,435
State:
$60,339
Salary/wage: $33,202 (reported on 81.8% of returns)
Here:
$33,202
State:
$52,211
(% of AGI for various income ranges: 73.2% for AGIs below $10k, 68.0% for AGIs $10k-25k, 72.9% for AGIs $25k-50k, 91.6% for AGIs $50k-75k, 79.0% for AGIs $75k-100k)
Taxable interest for individuals: $533 (reported on 36.8% of returns)
This zip code:
$533
Maryland:
$1,701
(% of AGI for various income ranges: 4.0% for AGIs below $10k, 0.3% for AGIs $10k-25k, 1.0% for AGIs $25k-50k, 0.0% for AGIs $50k-75k, 0.4% for AGIs $75k-100k)
Taxable dividends: $480 (reported on 8.8% of returns)
Here:
$480
State:
$4,235
Net capital gain/loss: +$294 (reported on 6.0% of returns)
Here:
+$294
State:
+$15,888
Profit/loss from business: +$6,278 (reported on 12.6% of returns)
Here:
+$6,278
State:
+$12,221
Total itemized deductions: $14,306 (22% of AGI, reported on 25.3% of returns)
Here:
$14,306
State:
$22,960
Here:
22.5% of AGI
State:
23.3% of AGI
Charity contributions deductions: $1,696 (3% of AGI, reported on 19.6% of returns)
Here:
$1,696
State:
$4,031
Here:
2.5% of AGI
State:
3.9% of AGI
Total tax: $3,414 (reported on 79.6% of returns)
21766:
$3,414
State:
$10,167
(% of AGI for various income ranges: 1.8% for AGIs below $10k, 4.8% for AGIs $10k-25k, 7.3% for AGIs $25k-50k, 7.5% for AGIs $50k-75k, 11.3% for AGIs $75k-100k)
Earned income credit: $1,594 (reported on 11.2% of returns)
Here:
$1,594
State:
$1,700
Percentage of individuals using paid preparers for their 2004 taxes: 60.4%
Here:
60%
State:
55%
(% for various income ranges: 51.0% for AGIs below $10k, 57.5% for AGIs $10k-25k, 64.3% for AGIs $25k-50k, 62.8% for AGIs $50k-75k, 70.4% for AGIs $75k-100k)
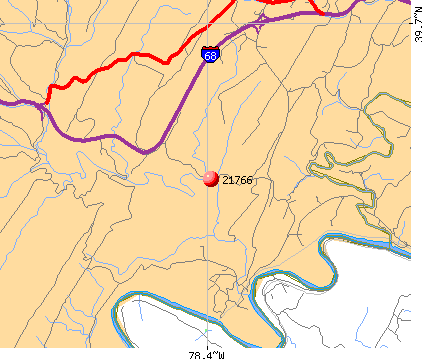
Notable locations in zip code 21766: Fifteen Mile Creek Campground (A), Devils Alley Campground (B), Indigo Neck Campground (C), Camp Strauss (D), Orleans Volunteer Fire Department (E), Fischers Greenhouse (F). Display/hide their locations on the map
Churches in zip code 21766 include: Big Ridge Church (A), Piney Plains United Methodist Church (B), Saint Patrick Church (C). Display/hide their locations on the map
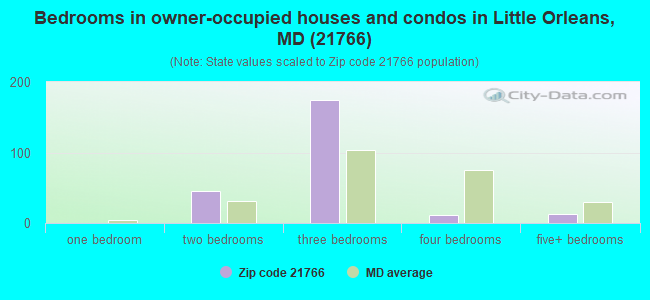
Size of family households: 94 2-persons, 25 3-persons, 31 4-persons
Size of nonfamily households: 126 1-person, 27 2-persons
99.3% of residents of 21766 zip code speak English at home.
Foreign born population: 0 (0.0%)
:
0.0%
Whole state:
16.7%
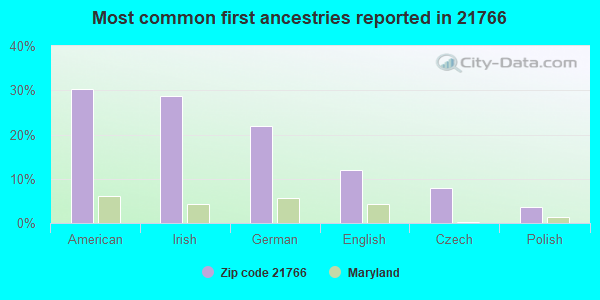
30%American
29%Irish
22%German
12%English
8%Czech
4%Polish
Facilities with environmental interests located in this zip code:
AMOCO - 35206 NATIONAAL PIKE, NORTH (35206 NATIONAL PIKE, NORTH EAST in LITTLE ORLEANS, MD)
AIR MINOR (AIRS/AFS) STATE MASTER (Maryland Air Emissions Database) - AIR MINOR Business SIC classification: GASOLINE SERVICE STATIONS Alternative names: SIDELING HILL AMOCO
LITTLE ORLEANS CAMPGROUND WWTP (31661 GREEN FOREST DRIVE, S.E. in LITTLE ORLEANS, MD)
STATE MASTER (Maryland Permits tracking) - National Pollutant Discharge Elimination System Permit, NPDES NON-MAJOR National Pollutant Discharge Elimination System NON-MAJOR (Tracking pollutant discharge elimination systems) - permit Business SIC classification: SEWERAGE SYSTEMS; SPORTING AND RECREATIONAL CAMPS
EXXON - RURAL ROUTE 1, BOX 54 (BOX 54 RURAL ROUTE 1 in LITTLE ORLEANS, MD)
AIR MINOR (AIRS/AFS) Business SIC classification: GASOLINE SERVICE STATIONS
MARYLAND STATE HIGHWAY ADMINISTRATION (US40 in LITTLE ORLEANS, MD)
Conditionally Exempt Small Quantity Generators, less than 100 kg/month of hazardous waste (Resource Conservation and Recovery Act (tracking hazardous waste)) - notification Organizations: OPERNAME (CONTACT/OPERATOR)
, MARYLAND STATE OF (CONTACT/OWNER)
Housing units lacking complete plumbing facilities: 2.5% Housing units lacking complete kitchen facilities: 2.1%
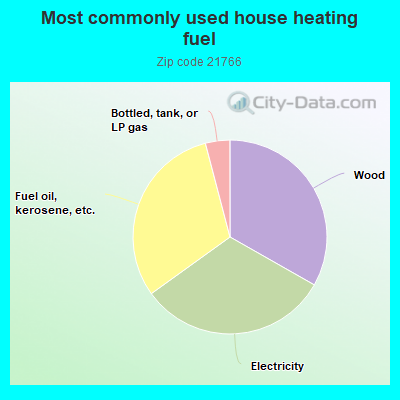
33.4%Wood
32.0%Electricity
31.0%Fuel oil, kerosene, etc.
4.1%Bottled, tank, or LP gas
Population in 1990: 699.
Place of birth for U.S.-born residents:
This state: 285
Northeast: 106
South: 141
60% of the 21766 zip code residents lived in the same house 5 years ago. Out of people who lived in different houses, 64% lived in this county. Out of people who lived in different counties, 50% lived in Maryland.
91% of the 21766 zip code residents lived in the same house 1 year ago. Out of people who lived in different houses, 98% moved from different state.
Top industries in this zip code by the number of employees in 2005:
Construction: Poured Concrete Foundation and Structure Contractors (10-19 employees: 2 establishments)
Professional, Scientific, and Technical Services: All Other Professional, Scientific, and Technical Services (1-4: 1)
Accommodation and Food Services: RV (Recreational Vehicle) Parks and Campgrounds (1-4: 1)
Arts, Entertainment, and Recreation: Fitness and Recreational Sports Centers (1-4: 1)
Other Services (except Public Administration): Other Personal and Household Goods Repair and Maintenance (1-4: 1)
Construction: Masonry Contractors (1-4: 1)
Fatal accident statistics in 2012:
Fatal accident count: 1
Vehicles involved in fatal accidents: 2
Fatal accidents caused by drunken drivers: 1
Fatalities: 2
Persons involved in fatal accidents: 3
Pedestrians involved in fatal accidents: 0
Home Mortgage Disclosure Act Aggregated Statistics For Year 2009 (Based on 2 partial tracts)
A) FHA, FSA/RHS & VA Home Purchase Loans
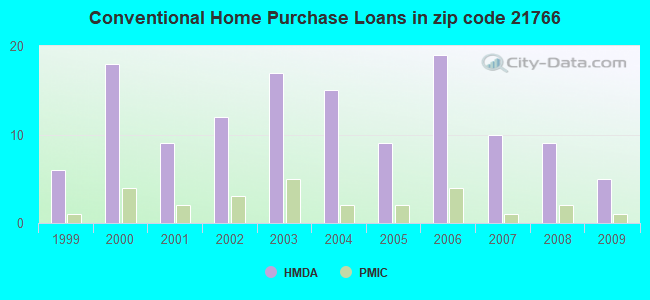
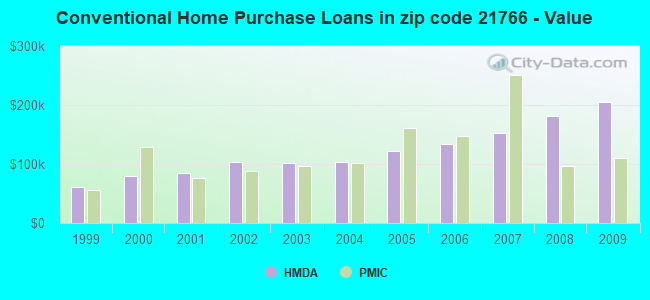
B) Conventional Home Purchase Loans
C) Refinancings
D) Home Improvement Loans
F) Non-occupant Loans on < 5 Family Dwellings (A B C & D)
G) Loans On Manufactured Home Dwelling (A B C & D)
Number
Average Value
Number
Average Value
Number
Average Value
Number
Average Value
Number
Average Value
Number
Average Value
LOANS ORIGINATED
3
$138,703
5
$204,846
34
$150,835
7
$42,017
3
$147,137
3
$108,733
APPLICATIONS APPROVED, NOT ACCEPTED
0
$0
0
$0
4
$158,582
0
$0
0
$0
0
$0
APPLICATIONS DENIED
0
$0
1
$95,330
14
$143,124
1
$39,760
1
$65,510
1
$91,720
APPLICATIONS WITHDRAWN
0
$0
0
$0
10
$139,471
1
$45,180
1
$186,590
1
$100,750
FILES CLOSED FOR INCOMPLETENESS
0
$0
0
$0
1
$134,640
0
$0
0
$0
0
$0
Aggregated Statistics For Year 2008 (Based on 2 partial tracts)
A) FHA, FSA/RHS & VA Home Purchase Loans
B) Conventional Home Purchase Loans
C) Refinancings
D) Home Improvement Loans
F) Non-occupant Loans on < 5 Family Dwellings (A B C & D)
G) Loans On Manufactured Home Dwelling (A B C & D)
Number
Average Value
Number
Average Value
Number
Average Value
Number
Average Value
Number
Average Value
Number
Average Value
LOANS ORIGINATED
1
$171,680
9
$181,021
28
$133,749
8
$56,136
2
$83,585
5
$119,456
APPLICATIONS APPROVED, NOT ACCEPTED
0
$0
0
$0
5
$168,432
0
$0
0
$0
0
$0
APPLICATIONS DENIED
0
$0
2
$201,505
21
$175,320
6
$70,255
3
$34,637
3
$92,470
APPLICATIONS WITHDRAWN
0
$0
1
$431,470
8
$188,344
1
$447,280
0
$0
0
$0
FILES CLOSED FOR INCOMPLETENESS
0
$0
0
$0
3
$208,280
0
$0
1
$226,800
0
$0
Aggregated Statistics For Year 2007 (Based on 2 partial tracts)
B) Conventional Home Purchase Loans
C) Refinancings
D) Home Improvement Loans
F) Non-occupant Loans on < 5 Family Dwellings (A B C & D)
G) Loans On Manufactured Home Dwelling (A B C & D)
Number
Average Value
Number
Average Value
Number
Average Value
Number
Average Value
Number
Average Value
LOANS ORIGINATED
10
$152,708
34
$118,757
11
$56,885
2
$110,240
5
$81,234
APPLICATIONS APPROVED, NOT ACCEPTED
3
$175,600
8
$128,368
1
$75,900
1
$117,920
1
$55,570
APPLICATIONS DENIED
3
$85,390
39
$139,884
7
$71,643
1
$79,060
6
$106,398
APPLICATIONS WITHDRAWN
1
$105,270
14
$130,344
2
$79,290
0
$0
1
$87,200
FILES CLOSED FOR INCOMPLETENESS
0
$0
5
$184,244
0
$0
0
$0
0
$0
Aggregated Statistics For Year 2006 (Based on 2 partial tracts)
A) FHA, FSA/RHS & VA Home Purchase Loans
B) Conventional Home Purchase Loans
C) Refinancings
D) Home Improvement Loans
F) Non-occupant Loans on < 5 Family Dwellings (A B C & D)
G) Loans On Manufactured Home Dwelling (A B C & D)
Number
Average Value
Number
Average Value
Number
Average Value
Number
Average Value
Number
Average Value
Number
Average Value
LOANS ORIGINATED
1
$97,590
19
$134,660
35
$103,075
11
$54,626
5
$120,088
5
$89,638
APPLICATIONS APPROVED, NOT ACCEPTED
0
$0
4
$64,043
3
$85,690
2
$78,385
1
$93,070
0
$0
APPLICATIONS DENIED
0
$0
5
$92,348
32
$135,117
6
$32,982
2
$58,960
1
$121,990
APPLICATIONS WITHDRAWN
0
$0
4
$92,280
21
$119,125
2
$66,640
0
$0
0
$0
FILES CLOSED FOR INCOMPLETENESS
0
$0
1
$91,720
5
$114,306
0
$0
0
$0
0
$0
Aggregated Statistics For Year 2005 (Based on 2 partial tracts)
B) Conventional Home Purchase Loans
C) Refinancings
D) Home Improvement Loans
F) Non-occupant Loans on < 5 Family Dwellings (A B C & D)
G) Loans On Manufactured Home Dwelling (A B C & D)
Number
Average Value
Number
Average Value
Number
Average Value
Number
Average Value
Number
Average Value
LOANS ORIGINATED
9
$121,484
33
$115,866
10
$41,114
3
$71,233
2
$103,460
APPLICATIONS APPROVED, NOT ACCEPTED
3
$202,407
9
$76,253
1
$7,680
0
$0
0
$0
APPLICATIONS DENIED
4
$37,048
36
$120,944
5
$37,680
1
$63,700
3
$31,627
APPLICATIONS WITHDRAWN
5
$85,932
34
$114,053
3
$140,960
2
$100,300
2
$47,440
FILES CLOSED FOR INCOMPLETENESS
0
$0
3
$177,257
0
$0
0
$0
0
$0
Aggregated Statistics For Year 2004 (Based on 2 partial tracts)
A) FHA, FSA/RHS & VA Home Purchase Loans
B) Conventional Home Purchase Loans
C) Refinancings
D) Home Improvement Loans
F) Non-occupant Loans on < 5 Family Dwellings (A B C & D)
G) Loans On Manufactured Home Dwelling (A B C & D)
Number
Average Value
Number
Average Value
Number
Average Value
Number
Average Value
Number
Average Value
Number
Average Value
LOANS ORIGINATED
0
$0
15
$102,559
39
$89,792
7
$31,561
4
$68,222
3
$68,823
APPLICATIONS APPROVED, NOT ACCEPTED
0
$0
2
$49,925
7
$102,881
1
$14,010
0
$0
1
$47,890
APPLICATIONS DENIED
0
$0
4
$54,442
32
$102,954
8
$32,530
4
$52,860
2
$39,760
APPLICATIONS WITHDRAWN
1
$80,870
1
$112,500
25
$104,510
1
$77,710
1
$97,590
0
$0
FILES CLOSED FOR INCOMPLETENESS
0
$0
0
$0
3
$85,993
0
$0
0
$0
0
$0
Aggregated Statistics For Year 2003 (Based on 2 partial tracts)
A) FHA, FSA/RHS & VA Home Purchase Loans
B) Conventional Home Purchase Loans
C) Refinancings
D) Home Improvement Loans
F) Non-occupant Loans on < 5 Family Dwellings (A B C & D)
Number
Average Value
Number
Average Value
Number
Average Value
Number
Average Value
Number
Average Value
LOANS ORIGINATED
1
$117,920
17
$101,389
49
$92,665
5
$13,826
5
$74,998
APPLICATIONS APPROVED, NOT ACCEPTED
0
$0
1
$74,550
16
$101,966
0
$0
1
$107,530
APPLICATIONS DENIED
0
$0
4
$48,002
41
$90,437
1
$51,050
1
$35,240
APPLICATIONS WITHDRAWN
0
$0
1
$108,430
28
$108,706
0
$0
0
$0
FILES CLOSED FOR INCOMPLETENESS
0
$0
0
$0
8
$103,124
0
$0
0
$0
Aggregated Statistics For Year 2002 (Based on 2 partial tracts)
A) FHA, FSA/RHS & VA Home Purchase Loans
B) Conventional Home Purchase Loans
C) Refinancings
D) Home Improvement Loans
F) Non-occupant Loans on < 5 Family Dwellings (A B C & D)
Number
Average Value
Number
Average Value
Number
Average Value
Number
Average Value
Number
Average Value
LOANS ORIGINATED
1
$86,290
12
$102,784
31
$89,806
7
$16,910
2
$125,600
APPLICATIONS APPROVED, NOT ACCEPTED
0
$0
1
$52,860
6
$108,808
2
$6,325
1
$83,580
APPLICATIONS DENIED
0
$0
7
$42,791
28
$83,890
5
$20,422
2
$65,510
APPLICATIONS WITHDRAWN
0
$0
1
$29,820
19
$97,541
0
$0
0
$0
FILES CLOSED FOR INCOMPLETENESS
0
$0
0
$0
1
$140,060
0
$0
0
$0
Aggregated Statistics For Year 2001 (Based on 2 partial tracts)
A) FHA, FSA/RHS & VA Home Purchase Loans
B) Conventional Home Purchase Loans
C) Refinancings
D) Home Improvement Loans
F) Non-occupant Loans on < 5 Family Dwellings (A B C & D)
Number
Average Value
Number
Average Value
Number
Average Value
Number
Average Value
Number
Average Value
LOANS ORIGINATED
1
$105,270
9
$84,236
33
$77,518
5
$18,434
2
$100,525
APPLICATIONS APPROVED, NOT ACCEPTED
0
$0
1
$42,020
7
$74,224
0
$0
0
$0
APPLICATIONS DENIED
0
$0
3
$25,300
20
$67,431
4
$20,105
0
$0
APPLICATIONS WITHDRAWN
0
$0
1
$58,730
19
$102,701
2
$18,975
0
$0
FILES CLOSED FOR INCOMPLETENESS
0
$0
0
$0
2
$95,555
0
$0
0
$0
Aggregated Statistics For Year 2000 (Based on 2 partial tracts)
A) FHA, FSA/RHS & VA Home Purchase Loans
B) Conventional Home Purchase Loans
C) Refinancings
D) Home Improvement Loans
F) Non-occupant Loans on < 5 Family Dwellings (A B C & D)
Number
Average Value
Number
Average Value
Number
Average Value
Number
Average Value
Number
Average Value
LOANS ORIGINATED
2
$85,840
18
$80,169
37
$69,712
8
$14,966
2
$81,775
APPLICATIONS APPROVED, NOT ACCEPTED
1
$105,270
4
$61,558
8
$80,025
1
$44,730
0
$0
APPLICATIONS DENIED
2
$97,590
19
$55,429
33
$79,352
6
$18,298
7
$38,531
APPLICATIONS WITHDRAWN
0
$0
2
$80,195
9
$64,708
1
$9,490
0
$0
FILES CLOSED FOR INCOMPLETENESS
0
$0
1
$103,910
5
$52,770
0
$0
0
$0
Aggregated Statistics For Year 1999 (Based on 1 partial tract)
A) FHA, FSA/RHS & VA Home Purchase Loans
B) Conventional Home Purchase Loans
C) Refinancings
D) Home Improvement Loans
F) Non-occupant Loans on < 5 Family Dwellings (A B C & D)
Detailed PMIC statistics for the following Tracts:0001.00
2002 - 2018 National Fire Incident Reporting System (NFIRS) incidents
Based on the data from the years 2002 - 2018 the average number of fire incidents per year is 10. The highest number of reported fires - 19 took place in 2011, and the least - 2 in 2004. The data has a growing trend.
When looking into fire subcategories, the most incidents belonged to: Outside Fires (37.5%), and Structure Fires (32.4%).
Fire incident types reported to NFIRS in Zip Code 21766
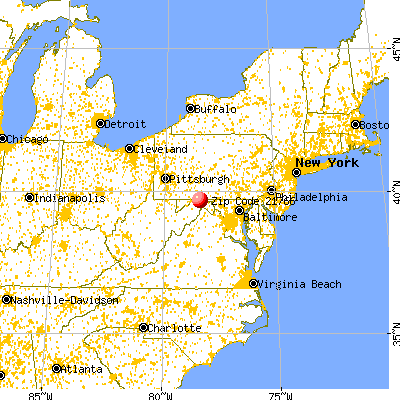


 Nearest zip codes: 17211, 25422, 21750, 21530, 15535, 21555.
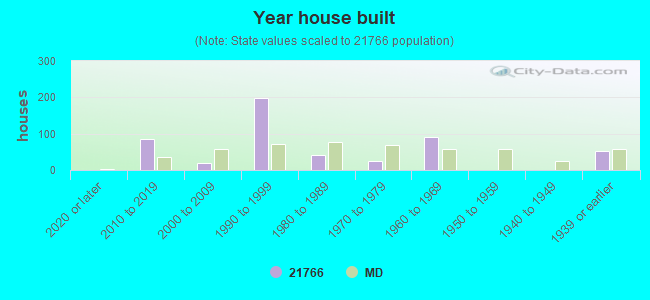


 Based on the data from the years 2002 - 2018 the average number of fire incidents per year is 10. The highest number of reported fires - 19 took place in 2011, and the least - 2 in 2004. The data has a growing trend.
 When looking into fire subcategories, the most incidents belonged to: Outside Fires (37.5%), and Structure Fires (32.4%).