Estimated zip code population in 2022: 5,527 Zip code population in 2010: 5,099 Zip code population in 2000: 5,166
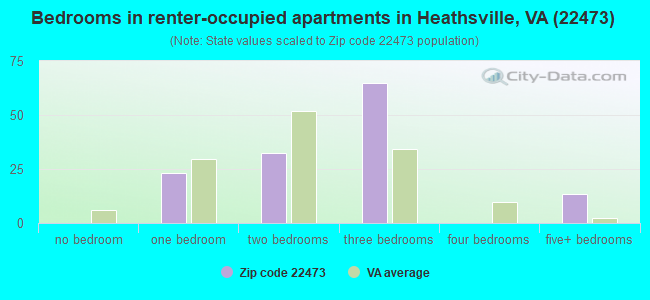
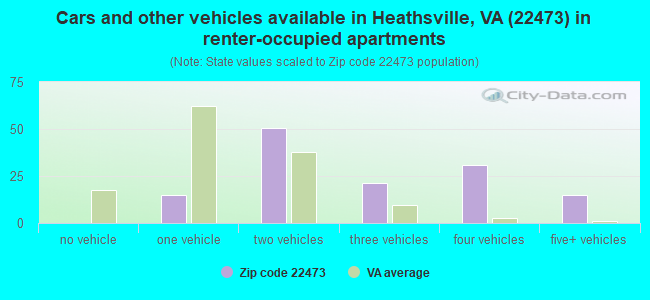
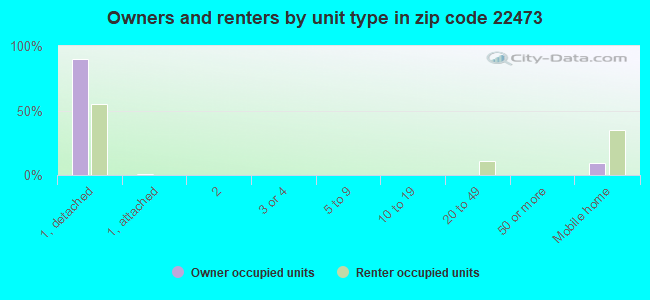
Houses and condos: 3,958 Renter-occupied apartments: 134
% of renters here:
6%
State:
33%
March 2022 cost of living index in zip code 22473: 84.4 (less than average, U.S. average is 100)
Land area: 112.5 sq. mi. Water area: 10.4 sq. mi.
Population density: 49 people per square mile
(very low).
OSM Map
General Map
Google Map
MSN Map
OSM Map
General Map
Google Map
MSN Map
OSM Map
General Map
Google Map
MSN Map
OSM Map
General Map
Google Map
MSN Map
Please wait while loading the map...
Real estate property taxes paid for housing units in 2022:
This zip code:
0.5% ($1,356)
Virginia:
0.7% ($2,617)
Median real estate property taxes paid for housing units with mortgages in 2022: $1,552 (0.5%) Median real estate property taxes paid for housing units with no mortgage in 2022: $997 (0.6%)
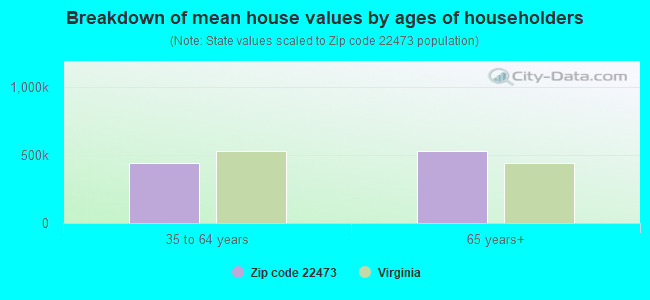
Estimated median house/condo value in 2022: $275,620
22473:
$275,620
Virginia:
$365,700
According to our research of Virginia and other state lists, there were 16 registered sex offenders living in 22473 zip code as of April 26, 2024. The ratio of all residents to sex offenders in zip code 22473 is 310 to 1. The ratio of registered sex offenders to all residents in this zip code is near the state average.
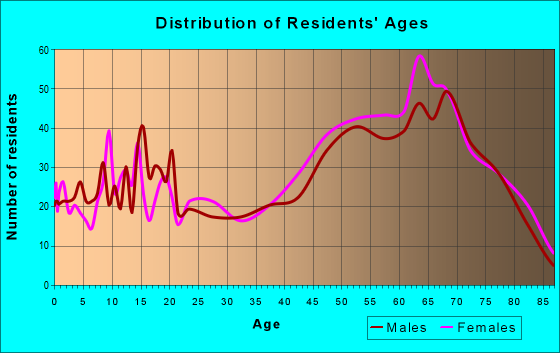
Median resident age:
This zip code:
57.5 years
Virginia median age:
39.0 years
Average household size:
This zip code:
2.4 people
Virginia:
2.5 people
Averages for the 2020 tax year for zip code 22473, filed in 2021:
Average Adjusted Gross Income (AGI) in 2020: $74,317 (Individual Income Tax Returns)
Here:
$74,317
State:
$86,446
Salary/wage: $53,970 (reported on 69.9% of returns)
Here:
$53,970
State:
$71,185
(% of AGI for various income ranges: 1102.6% for AGIs below $25k, 3823.5% for AGIs $25k-50k, 5481.0% for AGIs $50k-75k, 8429.0% for AGIs $75k-100k, 10942.2% for AGIs $100k-200k, 93890.0% for AGIs over 200k)
Taxable interest for individuals: $2,145 (reported on 42.8% of returns)
This zip code:
$2,145
Virginia:
$1,805
(% of AGI for various income ranges: 34.6% for AGIs below $25k, 48.8% for AGIs $25k-50k, 89.5% for AGIs $50k-75k, 213.0% for AGIs $75k-100k, 336.7% for AGIs $100k-200k, 2590.0% for AGIs over 200k)
Ordinary dividends: $6,994 (reported on 27.1% of returns)
Here:
$6,994
State:
$8,327
(% of AGI for various income ranges: 51.1% for AGIs below $25k, 80.8% for AGIs $25k-50k, 239.0% for AGIs $50k-75k, 444.0% for AGIs $75k-100k, 816.7% for AGIs $100k-200k, 4870.0% for AGIs over 200k)
Net capital gain/loss in AGI: +$12,775 (reported on 23.7% of returns)
Here:
+$12,775
State:
+$24,644
(% of AGI for various income ranges: 18.5% for AGIs below $25k, 30.2% for AGIs $25k-50k, 139.0% for AGIs $50k-75k, 419.0% for AGIs $75k-100k, 759.4% for AGIs $100k-200k, 16183.3% for AGIs over 200k)
Profit/loss from business: +$7,451 (reported on 17.4% of returns)
Here:
+$7,451
State:
+$12,836
(% of AGI for various income ranges: 152.6% for AGIs below $25k, 100.5% for AGIs $25k-50k, 160.0% for AGIs $50k-75k, 67.0% for AGIs $75k-100k, 341.1% for AGIs $100k-200k, 2706.7% for AGIs over 200k)
Taxable individual retirement arrangement distribution: $22,426 (reported on 16.5% of returns)
22473:
$22,426
Virginia:
$21,535
(% of AGI for various income ranges: 71.1% for AGIs below $25k, 166.2% for AGIs $25k-50k, 401.0% for AGIs $50k-75k, 1036.0% for AGIs $75k-100k, 2097.2% for AGIs $100k-200k, 6813.3% for AGIs over 200k)
Total itemized deductions: $31,993 (reported on 12.7% of returns)
Here:
$31,993
State:
$33,287
(% of AGI for various income ranges: 248.0% for AGIs $25k-50k, 870.5% for AGIs $50k-75k, 1177.0% for AGIs $75k-100k, 1807.2% for AGIs $100k-200k, 7826.7% for AGIs over 200k)
Charity contributions: $9,050 (reported on 11.0% of returns)
Here:
$9,050
State:
$10,381
(% of AGI for various income ranges: 50.5% for AGIs $25k-50k, 123.8% for AGIs $50k-75k, 245.0% for AGIs $75k-100k, 402.8% for AGIs $100k-200k, 3070.0% for AGIs over 200k)
Taxes paid: $6,650 (reported on 12.7% of returns)
22473:
$6,650
State:
$8,284
(% of AGI for various income ranges: 24.2% for AGIs $25k-50k, 97.1% for AGIs $50k-75k, 277.0% for AGIs $75k-100k, 486.7% for AGIs $100k-200k, 1803.3% for AGIs over 200k)
Earned income credit: $2,383 (reported on 17.4% of returns)
Here:
$2,383
State:
$2,214
(% of AGI for various income ranges: 123.0% for AGIs below $25k, 78.2% for AGIs $25k-50k)
Percentage of individuals using paid preparers for their 2020 taxes: 89.4%
Here:
89%
State:
92%
(% for various income ranges: 88.5% for AGIs below $25k, 87.7% for AGIs $25k-50k, 90.9% for AGIs $50k-75k, 89.5% for AGIs $75k-100k, 91.7% for AGIs $100k-200k, 92.3% for AGIs over 200k)
Averages for the 2012 tax year for zip code 22473, filed in 2013:
Average Adjusted Gross Income (AGI) in 2012: $55,875 (Individual Income Tax Returns)
Here:
$55,875
State:
$71,192
Salary/wage: $38,404 (reported on 68.6% of returns)
Here:
$38,404
State:
$59,229
(% of AGI for various income ranges: 66.1% for AGIs below $25k, 68.4% for AGIs $25k-50k, 51.4% for AGIs $50k-75k, 41.0% for AGIs $75k-100k, 39.5% for AGIs $100k-200k, 33.2% for AGIs over 200k)
Taxable interest for individuals: $1,950 (reported on 43.5% of returns)
This zip code:
$1,950
Virginia:
$1,600
(% of AGI for various income ranges: 2.3% for AGIs below $25k, 1.7% for AGIs $25k-50k, 2.0% for AGIs $50k-75k, 1.4% for AGIs $75k-100k, 1.4% for AGIs $100k-200k, 0.9% for AGIs over 200k)
Ordinary dividends: $6,281 (reported on 26.1% of returns)
Here:
$6,281
State:
$6,959
(% of AGI for various income ranges: 2.0% for AGIs below $25k, 2.0% for AGIs $25k-50k, 3.0% for AGIs $50k-75k, 2.6% for AGIs $75k-100k, 3.7% for AGIs $100k-200k, 3.0% for AGIs over 200k)
Net capital gain/loss in AGI: +$11,372 (reported on 20.8% of returns)
Here:
+$11,372
State:
+$16,672
(% of AGI for various income ranges: 0.4% for AGIs below $25k, 4.3% for AGIs $25k-50k, 0.1% for AGIs $50k-75k, 2.6% for AGIs $75k-100k, 2.0% for AGIs $100k-200k, 18.7% for AGIs over 200k)
Profit/loss from business: +$9,238 (reported on 16.4% of returns)
Here:
+$9,238
State:
+$14,116
(% of AGI for various income ranges: 9.0% for AGIs below $25k, 1.9% for AGIs $25k-50k, 0.9% for AGIs $50k-75k, 1.0% for AGIs $75k-100k, 4.6% for AGIs $100k-200k)
Taxable individual retirement arrangement distribution: $17,008 (reported on 18.4% of returns)
22473:
$17,008
Virginia:
$16,667
(% of AGI for various income ranges: 3.3% for AGIs below $25k, 2.3% for AGIs $25k-50k, 4.3% for AGIs $50k-75k, 7.5% for AGIs $75k-100k, 10.9% for AGIs $100k-200k)
Total itemized deductions: $23,159 (25% of AGI, reported on 38.2% of returns)
Here:
$23,159
State:
$26,596
Here:
24.9% of AGI
State:
20.1% of AGI
(% of AGI for various income ranges: 15.2% for AGIs below $25k, 14.0% for AGIs $25k-50k, 17.7% for AGIs $50k-75k, 15.5% for AGIs $75k-100k, 17.6% for AGIs $100k-200k, 13.3% for AGIs over 200k)
Charity contributions: $4,606 (reported on 31.4% of returns)
Here:
$4,606
State:
$4,443
(% of AGI for various income ranges: 1.5% for AGIs below $25k, 1.7% for AGIs $25k-50k, 2.8% for AGIs $50k-75k, 2.1% for AGIs $75k-100k, 3.3% for AGIs $100k-200k, 2.9% for AGIs over 200k)
Taxes paid: $6,086 (reported on 38.2% of returns)
22473:
$6,086
State:
$9,951
(% of AGI for various income ranges: 1.6% for AGIs below $25k, 2.4% for AGIs $25k-50k, 3.8% for AGIs $50k-75k, 4.2% for AGIs $75k-100k, 5.4% for AGIs $100k-200k, 5.1% for AGIs over 200k)
Earned income credit: $2,353 (reported on 20.8% of returns)
Here:
$2,353
State:
$2,211
(% of AGI for various income ranges: 8.2% for AGIs below $25k, 1.0% for AGIs $25k-50k)
Percentage of individuals using paid preparers for their 2012 taxes: 52.2%
Here:
52%
State:
46%
(% for various income ranges: 51.3% for AGIs below $25k, 54.0% for AGIs $25k-50k, 53.6% for AGIs $50k-75k, 47.4% for AGIs $75k-100k, 51.9% for AGIs $100k-200k, 60.0% for AGIs over 200k)
Averages for the 2004 tax year for zip code 22473, filed in 2005:
Average Adjusted Gross Income (AGI) in 2004: $43,216 (Individual Income Tax Returns)
Here:
$43,216
State:
$56,704
Salary/wage: $30,229 (reported on 73.3% of returns)
Here:
$30,229
State:
$48,441
(% of AGI for various income ranges: 103.3% for AGIs below $10k, 70.8% for AGIs $10k-25k, 65.1% for AGIs $25k-50k, 51.9% for AGIs $50k-75k, 41.8% for AGIs $75k-100k, 38.7% for AGIs over 100k)
Taxable interest for individuals: $2,584 (reported on 49.6% of returns)
This zip code:
$2,584
Virginia:
$1,688
(% of AGI for various income ranges: 11.1% for AGIs below $10k, 3.5% for AGIs $10k-25k, 2.5% for AGIs $25k-50k, 2.6% for AGIs $50k-75k, 2.5% for AGIs $75k-100k, 3.1% for AGIs over 100k)
Taxable dividends: $4,109 (reported on 30.5% of returns)
Here:
$4,109
State:
$4,028
(% of AGI for various income ranges: 4.8% for AGIs below $10k, 2.1% for AGIs $10k-25k, 2.3% for AGIs $25k-50k, 2.5% for AGIs $50k-75k, 4.6% for AGIs $75k-100k, 2.9% for AGIs over 100k)
Net capital gain/loss: +$14,235 (reported on 22.9% of returns)
Here:
+$14,235
State:
+$14,375
(% of AGI for various income ranges: 1.8% for AGIs below $10k, 1.0% for AGIs $10k-25k, 0.9% for AGIs $25k-50k, 2.4% for AGIs $50k-75k, 2.3% for AGIs $75k-100k, 18.6% for AGIs over 100k)
Profit/loss from business: +$10,317 (reported on 17.3% of returns)
Here:
+$10,317
State:
+$13,342
(% of AGI for various income ranges: 8.4% for AGIs below $10k, 5.0% for AGIs $10k-25k, 3.0% for AGIs $25k-50k, 1.0% for AGIs $50k-75k, 4.3% for AGIs $75k-100k, 5.9% for AGIs over 100k)
IRA payment deduction: $3,224 (reported on 3.7% of returns)
22473:
$3,224
Virginia:
$2,943
Self-employed pension: $9,000 (reported on 1.1% of returns)
Here:
$9,000
Virginia:
$17,430
Total itemized deductions: $18,469 (22% of AGI, reported on 29.3% of returns)
Here:
$18,469
State:
$21,492
Here:
22.0% of AGI
State:
21.0% of AGI
(% of AGI for various income ranges: 9.5% for AGIs below $10k, 8.8% for AGIs $10k-25k, 12.0% for AGIs $25k-50k, 15.3% for AGIs $50k-75k, 15.8% for AGIs $75k-100k, 11.2% for AGIs over 100k)
Charity contributions deductions: $3,537 (4% of AGI, reported on 26.2% of returns)
Here:
$3,537
State:
$3,794
Here:
4.0% of AGI
State:
3.5% of AGI
(% of AGI for various income ranges: 1.0% for AGIs $10k-25k, 2.0% for AGIs $25k-50k, 2.8% for AGIs $50k-75k, 2.5% for AGIs $75k-100k, 2.2% for AGIs over 100k)
Total tax: $6,854 (reported on 71.2% of returns)
22473:
$6,854
State:
$9,537
(% of AGI for various income ranges: 3.3% for AGIs below $10k, 3.6% for AGIs $10k-25k, 6.3% for AGIs $25k-50k, 8.8% for AGIs $50k-75k, 11.3% for AGIs $75k-100k, 18.2% for AGIs over 100k)
Earned income credit: $1,855 (reported on 20.3% of returns)
Here:
$1,855
State:
$1,734
Percentage of individuals using paid preparers for their 2004 taxes: 57.1%
Here:
57%
State:
52%
(% for various income ranges: 53.5% for AGIs below $10k, 61.9% for AGIs $10k-25k, 55.3% for AGIs $25k-50k, 55.6% for AGIs $50k-75k, 50.4% for AGIs $75k-100k, 63.4% for AGIs over 100k)
Household received Food Stamps/SNAP in the past 12 months: 225 Household did not receive Food Stamps/SNAP in the past 12 months: 2,044
Women who had a birth in the past 12 months: 16 (17 now married, 0 unmarried) Women who did not have a birth in the past 12 months: 1,109 (333 now married, 781 unmarried)
Housing units in zip code 22473 with a mortgage: 880 (139 second mortgage, 137 both second mortgage and home equity loan) Median monthly owner costs for units with a mortgage: $1,449 Median monthly owner costs for units without a mortgage: $392
Residents with income below the poverty level in 2022:
This zip code:
17.1%
Whole state:
10.6%
Residents with income below 50% of the poverty level in 2022:
This zip code:
8.6%
Whole state:
5.2%
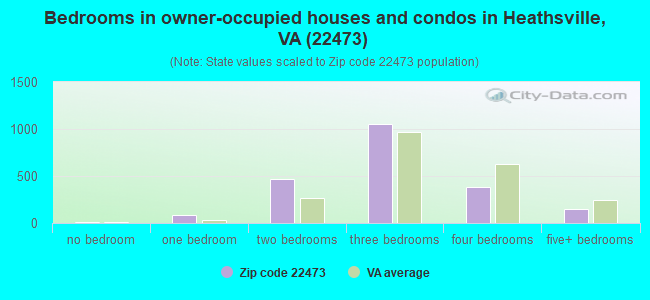
Median number of rooms in houses and condos:
Here:
6.1
State:
7.0
Median number of rooms in apartments:
Here:
4.4
State:
4.3
Notable locations in this zip code not listed on our city pages
Notable locations in zip code 22473: Cedar Point Landing (A), Bush Mill (B), Sampsons Wharf (C), Coan Stage (D), Beanes Corners (E), Rehoboth Church (F), Kirkland Campground (G), Pumpkin Hill (H), Miskimon Lookout Tower (I), Little Wicomico Landing (J), Indian Point Landing (K), Rowes Landing (L), Hacks Neck Landing (M), Deep Landing (N), Forrest Landing (O), Cooper Landing (P), Fountain Gate (Q), Brents Landing (R), Betz Landing (S), Camp Kittamaqund (T). Display/hide their locations on the map
Churches in zip code 22473 include: Providence Church (A), Corinth Church (B), First Baptist Church (C), Mount Olive Church (D), Saint Stephen's Anglican Church (E), Smithland Church (F), Coan Church (G), Fairfields Church (H), Galilee Church (I). Display/hide their locations on the map
Lakes and reservoirs: Flag Pond (A), Lowes Pond (B), Black Pond (C), Boathouse Pond (D), Condit Pond (E), Corbin Pond (F), Clarkes Millpond (G), Falling Millpond (H). Display/hide their locations on the map
Streams, rivers, and creeks: Davis Mill Run (A), Towles Creek (B), Tipers Creek (C), Sydnors Mill Creek (D), Shell Creek (E), Rogers Creek (F), Presley Creek (G), Penny Creek (H), Knight Run (I). Display/hide their locations on the map
Size of family households: 1,048 2-persons, 196 3-persons, 96 4-persons, 9 5-persons, 40 6-persons, 93 7-or-more-persons
Size of nonfamily households: 718 1-person, 87 2-persons
382 married couples with children.
206 single-parent households (206 women).
93.7% of residents of 22473 zip code speak English at home.
3.1% of residents speak Spanish at home (73% very well, 20% well, 7% not well).
2.5% of residents speak other Indo-European language at home (84% very well, 16% well).
1.4% of residents speak Asian or Pacific Island language at home (100% very well).
0.1% of residents speak other language at home (100% well).
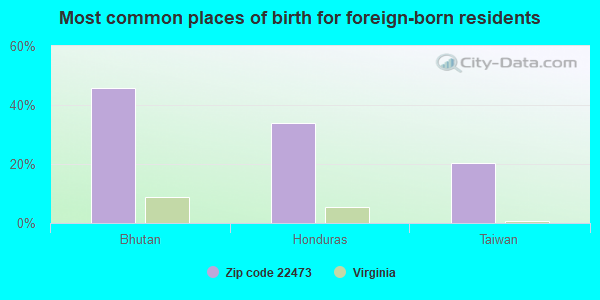
Foreign born population: 128 (2.3%) (64.4% of them are naturalized citizens)
This zip code:
2.3%
Whole state:
12.7%
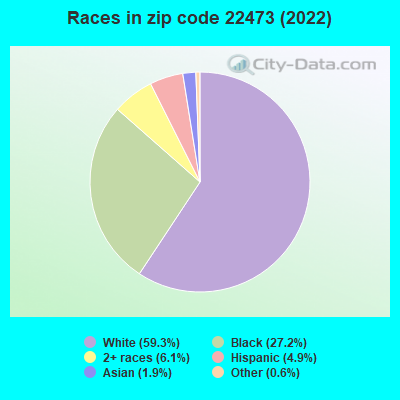
46%Bhutan
34%Honduras
20%Taiwan
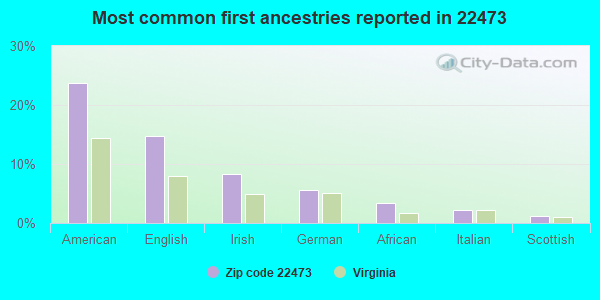
24%American
15%English
8%Irish
6%German
3%African
2%Italian
1%Scottish
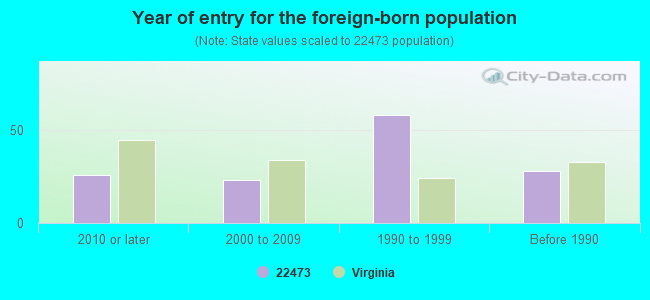
Year of entry for the foreign-born population
262010 or later
232000 to 2009
581990 to 1999
28Before 1990
Housing units lacking complete plumbing facilities: 3.9% Housing units lacking complete kitchen facilities: 3.3%
66.2%Electricity
13.1%Fuel oil, kerosene, etc.
8.3%Utility gas
7.7%Bottled, tank, or LP gas
2.6%Wood
2.3%No fuel used
Population in 1990: 2,670. Population change in the 1990s: +2,496 (+93.5%).
Place of birth for U.S.-born residents:
This state: 3,152
Northeast: 726
Midwest: 192
South: 1,156
West: 144
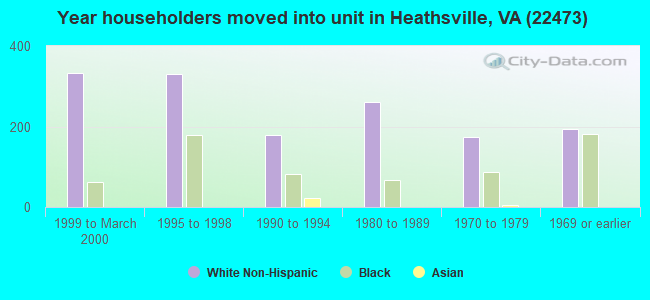
61% of the 22473 zip code residents lived in the same house 5 years ago. Out of people who lived in different houses, 32% lived in this county. Out of people who lived in different counties, 50% lived in Virginia.
92% of the 22473 zip code residents lived in the same house 1 year ago. Out of people who lived in different houses, 9% moved from this county. Out of people who lived in different houses, 70% moved from different county within same state. Out of people who lived in different houses, 24% moved from different state. Out of people who lived in different houses, 3% moved from abroad.
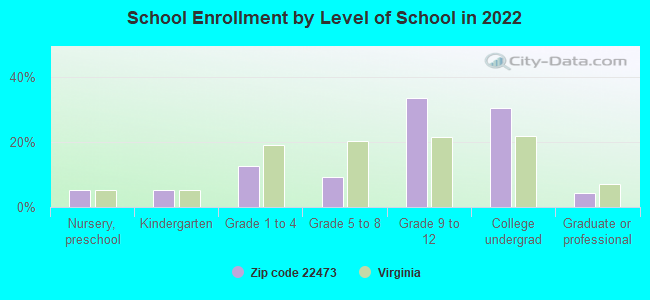
Private vs. public school enrollment:
Students in private schools in grades 1 to 8 (elementary and middle school): 75
Here:
30.7%
Virginia:
13.2%
Students in private schools in grades 9 to 12 (high school): 86
Here:
23.1%
Virginia:
10.2%
Students in private undergraduate colleges: 80
Here:
23.5%
Virginia:
18.7%
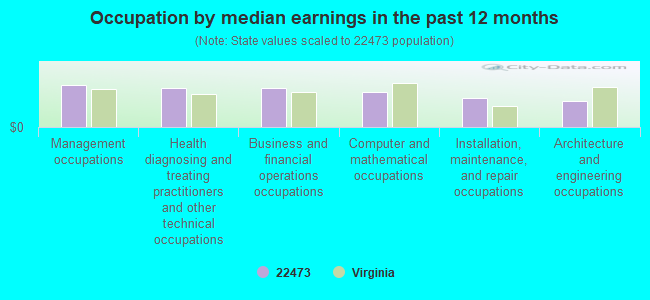
Occupation by median earnings in the past 12 months ($)
97,331Management occupations
91,664Health diagnosing and treating practitioners and other technical occupations
90,545Business and financial operations occupations
82,151Computer and mathematical occupations
67,044Installation, maintenance, and repair occupations
61,141Architecture and engineering occupations
Companies with federal contracts located in this zip code (HEATHSVILLE, VA):
STRUCTURAL SOLUTIONS INC (599 SKIPJACK DR; small business)
$59,520 with Army for Maintenance, Repair or Alteration of Real Property -- Miscellaneous Buildings. Signed on 2000-09-19. Completion date: 2001-01-02.
KEAN,BARRET E (555 CANVASBACK LANE; small business)
$19,800 with Air Force for Technical Writing Services. Taking place in MD. Signed on 2005-04-04. Completion date: 2005-08-01.
MASS, MERIDEAN (403 RIDGE WAY DR; small business)
$15,000 with Uniformed Services University of the Health Sciences for Medical/Psychiatric Consultation Services. Signed on 2005-09-13. Completion date: 2006-08-31.
ROBERT L RAMSEY JR (RR 600; small business)
$1,000 with National Park Service for Maintenance, Repair or Alteration of Real Property -- Other Administrative Facilities and Service Buildings. Signed on 2001-10-15. Completion date: 2001-12-15.
Top industries in this zip code by the number of employees in 2005:
Accommodation and Food Services: Full-Service Restaurants (20-49: 1, 5-9: 1)
Construction: Poured Concrete Foundation and Structure Contractors (20-49: 1, 1-4: 1)
Administrative and Support and Waste Management and Remediation Services: Security Guards and Patrol Services (20-49: 1)
Professional, Scientific, and Technical Services: Veterinary Services (20-49: 1)
Other Services (except Public Administration): Religious Organizations (5-9: 2, 1-4: 7)
Accommodation and Food Services: Food Service Contractors (10-19: 1, 5-9: 1, 1-4: 1)
People in group quarters in 2000:
12 people in local jails and other confinement facilities (including police lockups)
Fatal accident statistics in 2014:
Fatal accident count: 1
Vehicles involved in fatal accidents: 1
Fatal accidents caused by drunken drivers: 0
Fatalities: 1
Persons involved in fatal accidents: 1
Pedestrians involved in fatal accidents: 0
Fatal accident statistics in 2013:
Fatal accident count: 1
Vehicles involved in fatal accidents: 2
Fatal accidents caused by drunken drivers: 0
Fatalities: 1
Persons involved in fatal accidents: 3
Pedestrians involved in fatal accidents: 0
2005 - 2018 National Fire Incident Reporting System (NFIRS) incidents
According to the data from the years 2005 - 2018 the average number of fire incidents per year is 17. The highest number of fire incidents - 35 took place in 2008, and the least - 3 in 2005. The data has an increasing trend.
When looking into fire subcategories, the most reports belonged to: Structure Fires (47.6%), and Outside Fires (39.9%).
Fire incident types reported to NFIRS in Zip Code 22473


 Nearest zip codes: 22432, 22530, 22511, 22539, 22579, 22503.


 According to the data from the years 2005 - 2018 the average number of fire incidents per year is 17. The highest number of fire incidents - 35 took place in 2008, and the least - 3 in 2005. The data has an increasing trend.
 When looking into fire subcategories, the most reports belonged to: Structure Fires (47.6%), and Outside Fires (39.9%).