Estimated zip code population in 2022: 3,273 Zip code population in 2010: 3,641 Zip code population in 2000: 2,896
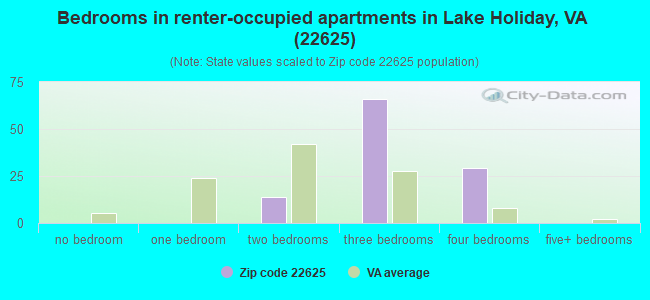
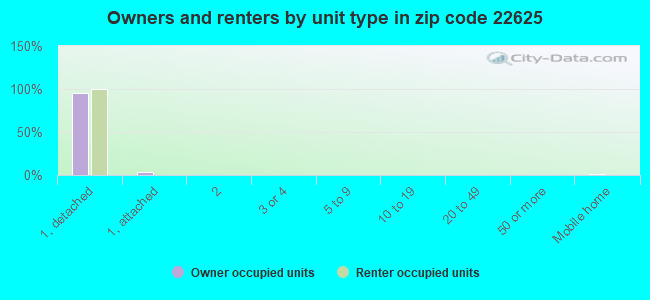
Houses and condos: 1,523 Renter-occupied apartments: 110
% of renters here:
9%
State:
33%
March 2022 cost of living index in zip code 22625: 82.5 (low, U.S. average is 100)
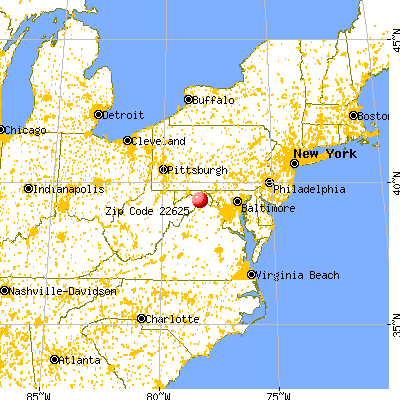
Land area: 43.8 sq. mi. Water area: 0.3 sq. mi.
Population density: 75 people per square mile
(very low).
OSM Map
General Map
Google Map
MSN Map
OSM Map
General Map
Google Map
MSN Map
OSM Map
General Map
Google Map
MSN Map
OSM Map
General Map
Google Map
MSN Map
Please wait while loading the map...
Real estate property taxes paid for housing units in 2022:
This zip code:
0.6% ($1,874)
Virginia:
0.7% ($2,617)
Median real estate property taxes paid for housing units with mortgages in 2022: $2,052 (0.7%) Median real estate property taxes paid for housing units with no mortgage in 2022: $1,815 (0.6%)
Business Search- 14 Million verified businesses
Males: 1,534
(46.9%)
Females: 1,738
(53.1%)
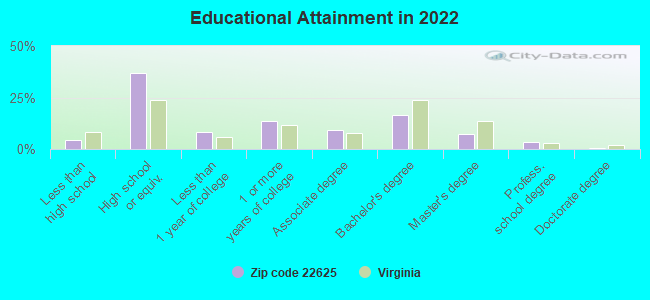
For population 25 years and over in 22625:
High school or higher: 94.8%
Bachelor's degree or higher: 27.4%
Graduate or professional degree: 11.1%
Unemployed: 0.9%
Mean travel time to work (commute): 44.1 minutes
For population 15 years and over in 22625:
Never married: 23.4%
Now married: 61.7%
Separated: 0.0%
Widowed: 5.2%
Divorced: 9.6%
Zip code 22625 compared to state average:
Unemployed percentage significantly below state average.
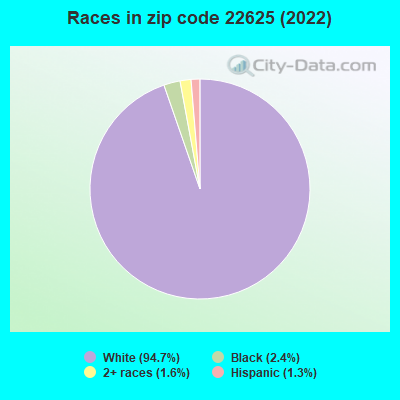
Black race population percentage significantly below state average.
Hispanic race population percentage significantly below state average.
Median age significantly above state average.
Foreign-born population percentage significantly below state average.
Renting percentage significantly below state average.
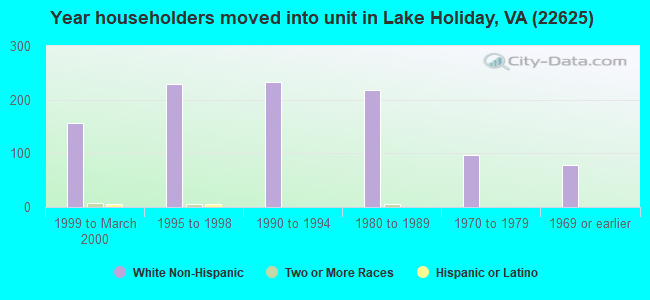
Length of stay since moving in significantly above state average.
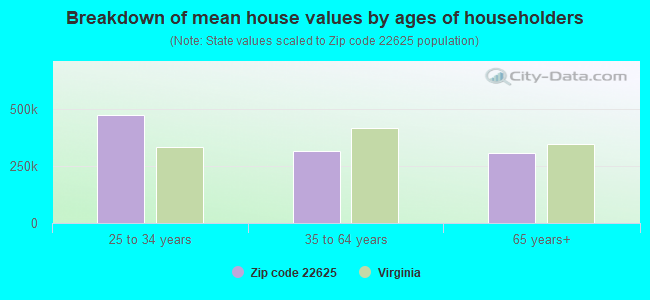
Estimated median house/condo value in 2022: $290,903
22625:
$290,903
Virginia:
$365,700
According to our research of Virginia and other state lists, there were 11 registered sex offenders living in 22625 zip code as of April 28, 2024. The ratio of all residents to sex offenders in zip code 22625 is 361 to 1. The ratio of registered sex offenders to all residents in this zip code is near the state average.
Median resident age:
This zip code:
51.6 years
Virginia median age:
39.0 years
Average household size:
This zip code:
2.6 people
Virginia:
2.5 people
Averages for the 2020 tax year for zip code 22625, filed in 2021:
Average Adjusted Gross Income (AGI) in 2020: $76,839 (Individual Income Tax Returns)
Here:
$76,839
State:
$86,446
Salary/wage: $67,967 (reported on 81.0% of returns)
Here:
$67,967
State:
$71,185
(% of AGI for various income ranges: 1150.8% for AGIs below $25k, 3535.0% for AGIs $25k-50k, 5998.1% for AGIs $50k-75k, 8844.4% for AGIs $75k-100k, 17488.4% for AGIs $100k-200k, 51007.5% for AGIs over 200k)
Taxable interest for individuals: $837 (reported on 29.2% of returns)
This zip code:
$837
Virginia:
$1,805
(% of AGI for various income ranges: 6.1% for AGIs below $25k, 12.7% for AGIs $25k-50k, 26.7% for AGIs $50k-75k, 34.4% for AGIs $75k-100k, 83.2% for AGIs $100k-200k, 227.5% for AGIs over 200k)
Ordinary dividends: $3,433 (reported on 18.5% of returns)
Here:
$3,433
State:
$8,327
(% of AGI for various income ranges: 21.9% for AGIs below $25k, 66.0% for AGIs $25k-50k, 96.7% for AGIs $50k-75k, 73.3% for AGIs $75k-100k, 204.8% for AGIs $100k-200k, 280.0% for AGIs over 200k)
Net capital gain/loss in AGI: +$8,491 (reported on 16.9% of returns)
Here:
+$8,491
State:
+$24,644
(% of AGI for various income ranges: 49.7% for AGIs $25k-50k, 41.4% for AGIs $50k-75k, 199.4% for AGIs $75k-100k, 526.8% for AGIs $100k-200k, 2230.0% for AGIs over 200k)
Profit/loss from business: +$10,426 (reported on 15.9% of returns)
Here:
+$10,426
State:
+$12,836
(% of AGI for various income ranges: 53.9% for AGIs below $25k, 120.3% for AGIs $25k-50k, 234.8% for AGIs $50k-75k, 268.3% for AGIs $75k-100k, 680.4% for AGIs $100k-200k)
Taxable individual retirement arrangement distribution: $21,923 (reported on 11.3% of returns)
22625:
$21,923
Virginia:
$21,535
(% of AGI for various income ranges: 64.7% for AGIs below $25k, 159.7% for AGIs $25k-50k, 225.7% for AGIs $50k-75k, 339.4% for AGIs $75k-100k, 1210.4% for AGIs $100k-200k)
Total itemized deductions: $27,921 (reported on 12.3% of returns)
Here:
$27,921
State:
$33,287
(% of AGI for various income ranges: 122.5% for AGIs below $25k, 255.7% for AGIs $50k-75k, 604.4% for AGIs $75k-100k, 1154.4% for AGIs $100k-200k, 4372.5% for AGIs over 200k)
Charity contributions: $7,861 (reported on 9.2% of returns)
Here:
$7,861
State:
$10,381
(% of AGI for various income ranges: 37.0% for AGIs $25k-50k, 83.3% for AGIs $75k-100k, 268.4% for AGIs $100k-200k, 1207.5% for AGIs over 200k)
Taxes paid: $7,608 (reported on 12.3% of returns)
22625:
$7,608
State:
$8,284
(% of AGI for various income ranges: 19.4% for AGIs below $25k, 76.2% for AGIs $50k-75k, 169.4% for AGIs $75k-100k, 320.0% for AGIs $100k-200k, 1227.5% for AGIs over 200k)
Earned income credit: $2,125 (reported on 8.2% of returns)
Here:
$2,125
State:
$2,214
(% of AGI for various income ranges: 53.1% for AGIs below $25k, 49.7% for AGIs $25k-50k)
Percentage of individuals using paid preparers for their 2020 taxes: 90.8%
Here:
91%
State:
92%
(% for various income ranges: 91.5% for AGIs below $25k, 92.1% for AGIs $25k-50k, 89.7% for AGIs $50k-75k, 92.0% for AGIs $75k-100k, 88.9% for AGIs $100k-200k, 90.9% for AGIs over 200k)
Averages for the 2012 tax year for zip code 22625, filed in 2013:
Average Adjusted Gross Income (AGI) in 2012: $63,283 (Individual Income Tax Returns)
Here:
$63,283
State:
$71,192
Salary/wage: $55,452 (reported on 86.3% of returns)
Here:
$55,452
State:
$59,229
(% of AGI for various income ranges: 77.6% for AGIs below $25k, 77.6% for AGIs $25k-50k, 74.0% for AGIs $50k-75k, 80.2% for AGIs $75k-100k, 77.1% for AGIs $100k-200k, 62.4% for AGIs over 200k)
Taxable interest for individuals: $874 (reported on 33.5% of returns)
This zip code:
$874
Virginia:
$1,600
(% of AGI for various income ranges: 0.5% for AGIs below $25k, 0.3% for AGIs $25k-50k, 0.4% for AGIs $50k-75k, 0.2% for AGIs $75k-100k, 0.7% for AGIs $100k-200k, 0.2% for AGIs over 200k)
Ordinary dividends: $3,088 (reported on 20.5% of returns)
Here:
$3,088
State:
$6,959
(% of AGI for various income ranges: 1.4% for AGIs below $25k, 1.3% for AGIs $25k-50k, 0.9% for AGIs $50k-75k, 0.9% for AGIs $75k-100k, 0.9% for AGIs $100k-200k, 1.3% for AGIs over 200k)
Net capital gain/loss in AGI: +$4,221 (reported on 14.9% of returns)
Here:
+$4,221
State:
+$16,672
(% of AGI for various income ranges: 0.3% for AGIs $50k-75k, 0.1% for AGIs $75k-100k, 1.8% for AGIs $100k-200k, 2.7% for AGIs over 200k)
Profit/loss from business: +$9,962 (reported on 16.1% of returns)
Here:
+$9,962
State:
+$14,116
(% of AGI for various income ranges: 7.6% for AGIs below $25k, 3.5% for AGIs $25k-50k, 2.3% for AGIs $50k-75k, 2.3% for AGIs $75k-100k, 2.5% for AGIs $100k-200k)
Taxable individual retirement arrangement distribution: $16,489 (reported on 11.8% of returns)
22625:
$16,489
Virginia:
$16,667
(% of AGI for various income ranges: 2.7% for AGIs below $25k, 2.7% for AGIs $25k-50k, 3.1% for AGIs $50k-75k, 2.2% for AGIs $75k-100k, 4.6% for AGIs $100k-200k)
Total itemized deductions: $21,869 (22% of AGI, reported on 44.7% of returns)
Here:
$21,869
State:
$26,596
Here:
22.3% of AGI
State:
20.1% of AGI
(% of AGI for various income ranges: 13.3% for AGIs below $25k, 11.1% for AGIs $25k-50k, 14.2% for AGIs $50k-75k, 17.4% for AGIs $75k-100k, 16.5% for AGIs $100k-200k, 16.4% for AGIs over 200k)
Charity contributions: $2,848 (reported on 33.5% of returns)
Here:
$2,848
State:
$4,443
(% of AGI for various income ranges: 0.5% for AGIs below $25k, 0.8% for AGIs $25k-50k, 1.4% for AGIs $50k-75k, 1.3% for AGIs $75k-100k, 1.9% for AGIs $100k-200k, 1.9% for AGIs over 200k)
Taxes paid: $7,035 (reported on 44.7% of returns)
22625:
$7,035
State:
$9,951
(% of AGI for various income ranges: 1.9% for AGIs below $25k, 2.3% for AGIs $25k-50k, 3.8% for AGIs $50k-75k, 5.3% for AGIs $75k-100k, 6.2% for AGIs $100k-200k, 6.4% for AGIs over 200k)
Earned income credit: $2,122 (reported on 11.2% of returns)
Here:
$2,122
State:
$2,211
(% of AGI for various income ranges: 5.5% for AGIs below $25k, 0.9% for AGIs $25k-50k)
Percentage of individuals using paid preparers for their 2012 taxes: 50.3%
Here:
50%
State:
46%
(% for various income ranges: 45.7% for AGIs below $25k, 48.5% for AGIs $25k-50k, 53.6% for AGIs $50k-75k, 54.5% for AGIs $75k-100k, 50.0% for AGIs $100k-200k, 75.0% for AGIs over 200k)
Averages for the 2004 tax year for zip code 22625, filed in 2005:
Average Adjusted Gross Income (AGI) in 2004: $53,664 (Individual Income Tax Returns)
Here:
$53,664
State:
$56,704
Salary/wage: $48,091 (reported on 86.5% of returns)
Here:
$48,091
State:
$48,441
(% of AGI for various income ranges: 99.1% for AGIs below $10k, 78.4% for AGIs $10k-25k, 81.2% for AGIs $25k-50k, 84.2% for AGIs $50k-75k, 82.9% for AGIs $75k-100k, 66.8% for AGIs over 100k)
Taxable interest for individuals: $912 (reported on 46.3% of returns)
This zip code:
$912
Virginia:
$1,688
(% of AGI for various income ranges: 5.9% for AGIs below $10k, 0.8% for AGIs $10k-25k, 0.9% for AGIs $25k-50k, 0.6% for AGIs $50k-75k, 0.6% for AGIs $75k-100k, 0.8% for AGIs over 100k)
Taxable dividends: $1,690 (reported on 22.8% of returns)
Here:
$1,690
State:
$4,028
(% of AGI for various income ranges: 3.3% for AGIs below $10k, 0.4% for AGIs $10k-25k, 0.7% for AGIs $25k-50k, 0.4% for AGIs $50k-75k, 0.8% for AGIs $75k-100k, 0.8% for AGIs over 100k)
Net capital gain/loss: +$12,931 (reported on 17.9% of returns)
Here:
+$12,931
State:
+$14,375
(% of AGI for various income ranges: 4.0% for AGIs below $10k, -0.2% for AGIs $10k-25k, 0.6% for AGIs $25k-50k, 0.4% for AGIs $50k-75k, 3.0% for AGIs $75k-100k, 10.5% for AGIs over 100k)
Profit/loss from business: +$10,782 (reported on 18.3% of returns)
Here:
+$10,782
State:
+$13,342
(% of AGI for various income ranges: 10.2% for AGIs below $10k, 7.8% for AGIs $10k-25k, 3.0% for AGIs $25k-50k, 4.0% for AGIs $50k-75k, -0.6% for AGIs $75k-100k, 5.5% for AGIs over 100k)
IRA payment deduction: $3,406 (reported on 2.3% of returns)
22625:
$3,406
Virginia:
$2,943
Total itemized deductions: $17,510 (21% of AGI, reported on 45.5% of returns)
Here:
$17,510
State:
$21,492
Here:
21.4% of AGI
State:
21.0% of AGI
(% of AGI for various income ranges: 19.7% for AGIs below $10k, 9.7% for AGIs $10k-25k, 13.8% for AGIs $25k-50k, 16.6% for AGIs $50k-75k, 17.0% for AGIs $75k-100k, 13.5% for AGIs over 100k)
Charity contributions deductions: $2,621 (3% of AGI, reported on 37.5% of returns)
Here:
$2,621
State:
$3,794
Here:
3.1% of AGI
State:
3.5% of AGI
(% of AGI for various income ranges: 0.8% for AGIs $10k-25k, 1.3% for AGIs $25k-50k, 1.6% for AGIs $50k-75k, 2.1% for AGIs $75k-100k, 2.3% for AGIs over 100k)
Total tax: $7,209 (reported on 81.4% of returns)
22625:
$7,209
State:
$9,537
(% of AGI for various income ranges: 3.5% for AGIs below $10k, 4.8% for AGIs $10k-25k, 7.0% for AGIs $25k-50k, 8.3% for AGIs $50k-75k, 9.9% for AGIs $75k-100k, 16.7% for AGIs over 100k)
Earned income credit: $1,565 (reported on 10.0% of returns)
Here:
$1,565
State:
$1,734
Percentage of individuals using paid preparers for their 2004 taxes: 57.8%
Here:
58%
State:
52%
(% for various income ranges: 49.2% for AGIs below $10k, 58.0% for AGIs $10k-25k, 60.8% for AGIs $25k-50k, 61.6% for AGIs $50k-75k, 51.4% for AGIs $75k-100k, 62.9% for AGIs over 100k)
Likely homosexual households (counted as self-reported same-sex unmarried-partner households)
Lesbian couples: 1.2% of all households
Gay men: 0.0% of all households
Household received Food Stamps/SNAP in the past 12 months: 83 Household did not receive Food Stamps/SNAP in the past 12 months: 1,174
Women who had a birth in the past 12 months: 51 (12 now married, 36 unmarried) Women who did not have a birth in the past 12 months: 649 (272 now married, 377 unmarried)
Housing units in zip code 22625 with a mortgage: 823 (75 second mortgage, 14 both second mortgage and home equity loan) Houses without a mortgage: 23
Median monthly owner costs for units with a mortgage: $1,669 Median monthly owner costs for units without a mortgage: $662
Residents with income below the poverty level in 2022:
This zip code:
3.3%
Whole state:
10.6%
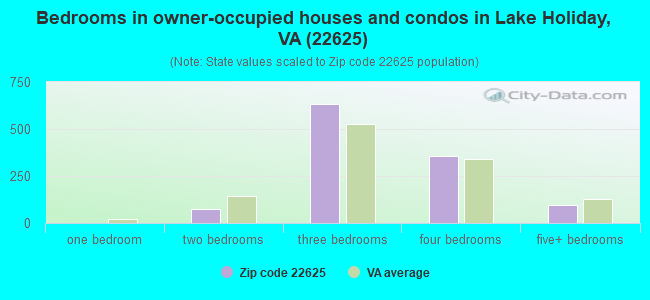
Median number of rooms in houses and condos:
Here:
7.5
State:
7.0
Median number of rooms in apartments:
Here:
7.1
State:
4.3
Notable locations in this zip code not listed on our city pages
Notable locations in zip code 22625: Reynolds Store (A), Lake Holiday Country Club (B), Camp Win-Wah (C), Frederick County Fire and Rescue Department Station 20 - Reynolds Store Volunteer Fire and Rescue (D). Display/hide their locations on the map
Churches in zip code 22625 include: Redland Church (A), Salem Church (B), Timber Ridge Church (C), Wesley Chapel (D), Mount Hebron Church (E). Display/hide their locations on the map
In group quarters: 18 (-1 institutionalized population)
Size of family households: 568 2-persons, 239 3-persons, 179 4-persons, 68 5-persons, 10 7-or-more-persons
Size of nonfamily households: 156 1-person, 34 2-persons
436 married couples with children.
115 single-parent households (115 men).
97.9% of residents of 22625 zip code speak English at home.
1.9% of residents speak Spanish at home (70% very well, 30% well).
0.3% of residents speak other Indo-European language at home (100% very well).
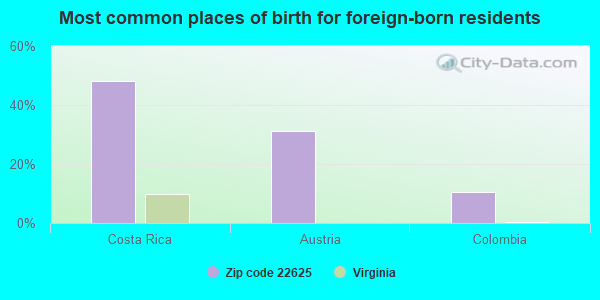
Foreign born population: 28 (0.9%) (37.0% of them are naturalized citizens)
This zip code:
0.9%
Whole state:
12.7%
48%Costa Rica
31%Austria
10%Colombia
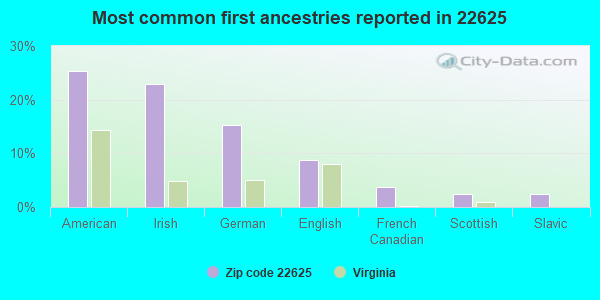
25%American
23%Irish
15%German
9%English
4%French Canadian
2%Scottish
2%Slavic
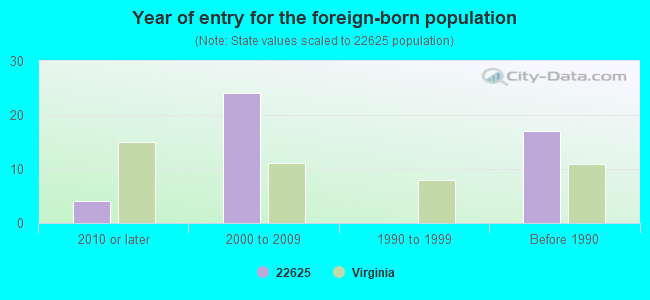
Year of entry for the foreign-born population
42010 or later
242000 to 2009
01990 to 1999
17Before 1990
Private high school in in this zip code not listed on the city page:
TIMBER RIDGE SCHOOL (Students: 66, Location: 1463 NEW HOPE RD, Grades: UG-12, Boys only)
Housing units lacking complete plumbing facilities: 1.1% Housing units lacking complete kitchen facilities: 1.2%
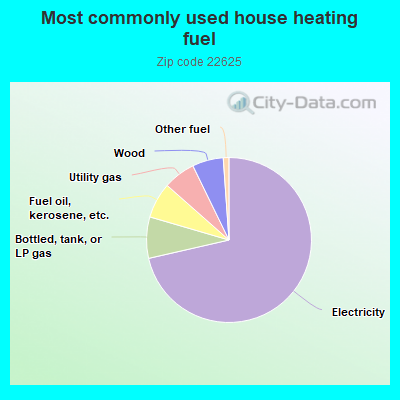
71.5%Electricity
8.1%Bottled, tank, or LP gas
7.0%Fuel oil, kerosene, etc.
6.3%Utility gas
6.1%Wood
1.1%Other fuel
Population in 1990: 1,229. Population change in the 1990s: +1,667 (+135.6%).
Place of birth for U.S.-born residents:
This state: 1,432
Northeast: 633
Midwest: 226
South: 884
West: 42
57% of the 22625 zip code residents lived in the same house 5 years ago. Out of people who lived in different houses, 38% lived in this county. Out of people who lived in different counties, 50% lived in Virginia.
90% of the 22625 zip code residents lived in the same house 1 year ago. Out of people who lived in different houses, 39% moved from this county. Out of people who lived in different houses, 29% moved from different county within same state. Out of people who lived in different houses, 23% moved from different state. Out of people who lived in different houses, 10% moved from abroad.
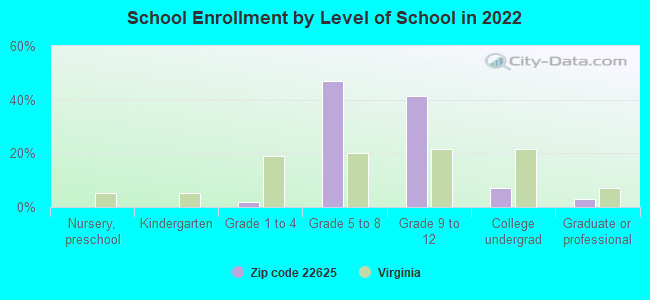
Private vs. public school enrollment:
Students in private schools in grades 1 to 8 (elementary and middle school): 95
Here:
32.3%
Virginia:
13.2%
Students in private schools in grades 9 to 12 (high school): 114
Here:
47.5%
Virginia:
10.2%
Students in private undergraduate colleges: 19
Here:
46.9%
Virginia:
18.7%
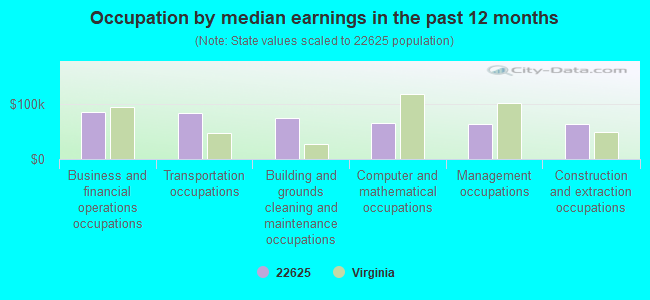
Occupation by median earnings in the past 12 months ($)
84,968Business and financial operations occupations
84,001Transportation occupations
74,850Building and grounds cleaning and maintenance occupations
65,293Computer and mathematical occupations
64,243Management occupations
63,195Construction and extraction occupations
Top industries in this zip code by the number of employees in 2005:
Health Care and Social Assistance: Residential Mental Health and Substance Abuse Facilities (100-249 employees: 1 establishment)
Construction: New Single-Family Housing Construction (except Operative Builders) (20-49: 1, 1-4: 4)
Health Care and Social Assistance: Child Day Care Services (20-49: 1)
Administrative and Support and Waste Management and Remediation Services: Temporary Help Services (10-19: 1)
Construction: Commercial and Institutional Building Construction (10-19: 1)
Construction: Poured Concrete Foundation and Structure Contractors (10-19: 1)
Other Services (except Public Administration): Civic and Social Organizations (10-19: 1)
Other Services (except Public Administration): General Automotive Repair (5-9: 2)
People in group quarters in 2010:
66 people in residential treatment centers for juveniles (non-correctional)
People in group quarters in 2000:
80 people in homes for abused, dependent, and neglected children
70 people in nursing homes
Fatal accident statistics in 2014:
Fatal accident count: 2
Vehicles involved in fatal accidents: 4
Fatal accidents caused by drunken drivers: 1
Fatalities: 2
Persons involved in fatal accidents: 4
Pedestrians involved in fatal accidents: 0
Home Mortgage Disclosure Act Aggregated Statistics For Year 2009 (Based on 2 partial tracts)
A) FHA, FSA/RHS & VA Home Purchase Loans
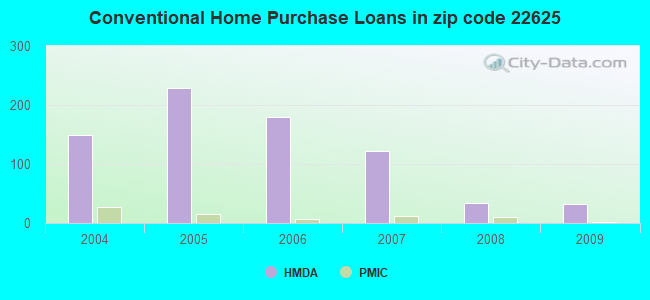
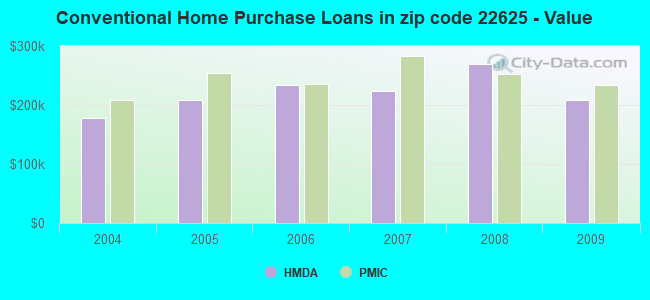
B) Conventional Home Purchase Loans
C) Refinancings
D) Home Improvement Loans
F) Non-occupant Loans on < 5 Family Dwellings (A B C & D)
G) Loans On Manufactured Home Dwelling (A B C & D)
Number
Average Value
Number
Average Value
Number
Average Value
Number
Average Value
Number
Average Value
Number
Average Value
LOANS ORIGINATED
29
$197,130
33
$209,211
171
$201,772
12
$80,444
20
$198,078
4
$127,162
APPLICATIONS APPROVED, NOT ACCEPTED
2
$103,030
3
$76,730
15
$208,288
1
$46,410
1
$45,480
1
$146,660
APPLICATIONS DENIED
4
$204,205
8
$170,441
74
$228,287
5
$89,850
7
$254,061
3
$91,273
APPLICATIONS WITHDRAWN
9
$217,508
5
$239,104
37
$212,683
2
$41,770
2
$279,390
2
$85,860
FILES CLOSED FOR INCOMPLETENESS
1
$112,310
2
$260,360
8
$259,316
1
$9,280
0
$0
0
$0
Aggregated Statistics For Year 2008 (Based on 2 partial tracts)
A) FHA, FSA/RHS & VA Home Purchase Loans
B) Conventional Home Purchase Loans
C) Refinancings
D) Home Improvement Loans
F) Non-occupant Loans on < 5 Family Dwellings (A B C & D)
G) Loans On Manufactured Home Dwelling (A B C & D)
Number
Average Value
Number
Average Value
Number
Average Value
Number
Average Value
Number
Average Value
Number
Average Value
LOANS ORIGINATED
23
$239,839
34
$269,478
110
$207,697
13
$90,535
19
$280,023
6
$150,213
APPLICATIONS APPROVED, NOT ACCEPTED
2
$203,740
7
$285,753
26
$229,051
3
$86,940
1
$246,900
1
$196,780
APPLICATIONS DENIED
6
$180,070
6
$250,460
83
$236,344
8
$199,099
3
$162,127
4
$82,378
APPLICATIONS WITHDRAWN
4
$209,772
4
$410,960
44
$268,798
3
$174,193
1
$28,770
2
$186,570
FILES CLOSED FOR INCOMPLETENESS
0
$0
0
$0
9
$243,498
1
$139,230
0
$0
0
$0
Aggregated Statistics For Year 2007 (Based on 2 partial tracts)
A) FHA, FSA/RHS & VA Home Purchase Loans
B) Conventional Home Purchase Loans
C) Refinancings
D) Home Improvement Loans
F) Non-occupant Loans on < 5 Family Dwellings (A B C & D)
G) Loans On Manufactured Home Dwelling (A B C & D)
Number
Average Value
Number
Average Value
Number
Average Value
Number
Average Value
Number
Average Value
Number
Average Value
LOANS ORIGINATED
7
$227,276
122
$224,122
206
$204,686
31
$57,339
24
$233,829
14
$148,379
APPLICATIONS APPROVED, NOT ACCEPTED
1
$226,480
12
$174,269
21
$230,017
1
$6,500
2
$105,350
1
$35,270
APPLICATIONS DENIED
1
$222,770
23
$264,174
137
$215,986
16
$117,301
5
$371,836
10
$141,086
APPLICATIONS WITHDRAWN
0
$0
16
$187,438
63
$199,858
4
$153,850
5
$219,798
3
$112,313
FILES CLOSED FOR INCOMPLETENESS
0
$0
4
$227,410
18
$270,983
0
$0
0
$0
0
$0
Aggregated Statistics For Year 2006 (Based on 2 partial tracts)
A) FHA, FSA/RHS & VA Home Purchase Loans
B) Conventional Home Purchase Loans
C) Refinancings
D) Home Improvement Loans
F) Non-occupant Loans on < 5 Family Dwellings (A B C & D)
G) Loans On Manufactured Home Dwelling (A B C & D)
Number
Average Value
Number
Average Value
Number
Average Value
Number
Average Value
Number
Average Value
Number
Average Value
LOANS ORIGINATED
4
$261,055
179
$234,031
229
$203,568
32
$87,106
33
$307,600
11
$132,311
APPLICATIONS APPROVED, NOT ACCEPTED
2
$212,095
17
$213,978
37
$197,732
3
$149,130
2
$324,405
6
$146,347
APPLICATIONS DENIED
1
$246,900
31
$181,089
119
$204,649
18
$105,866
10
$231,493
7
$169,993
APPLICATIONS WITHDRAWN
1
$317,440
20
$192,184
50
$184,675
5
$49,194
4
$109,528
2
$154,080
FILES CLOSED FOR INCOMPLETENESS
0
$0
5
$240,218
17
$250,341
1
$64,970
0
$0
0
$0
Aggregated Statistics For Year 2005 (Based on 2 partial tracts)
A) FHA, FSA/RHS & VA Home Purchase Loans
B) Conventional Home Purchase Loans
C) Refinancings
D) Home Improvement Loans
F) Non-occupant Loans on < 5 Family Dwellings (A B C & D)
G) Loans On Manufactured Home Dwelling (A B C & D)
Number
Average Value
Number
Average Value
Number
Average Value
Number
Average Value
Number
Average Value
Number
Average Value
LOANS ORIGINATED
6
$217,663
229
$209,190
245
$182,711
27
$90,207
43
$256,788
15
$150,801
APPLICATIONS APPROVED, NOT ACCEPTED
1
$151,300
22
$185,598
41
$143,011
5
$115,840
4
$145,728
6
$74,410
APPLICATIONS DENIED
2
$213,485
43
$171,220
101
$180,824
19
$78,995
7
$149,573
14
$67,957
APPLICATIONS WITHDRAWN
0
$0
20
$183,552
93
$176,258
17
$119,246
8
$138,882
4
$122,522
FILES CLOSED FOR INCOMPLETENESS
0
$0
6
$266,548
8
$264,538
3
$63,737
0
$0
0
$0
Aggregated Statistics For Year 2004 (Based on 2 partial tracts)
A) FHA, FSA/RHS & VA Home Purchase Loans
B) Conventional Home Purchase Loans
C) Refinancings
D) Home Improvement Loans
E) Loans on Dwellings For 5+ Families
F) Non-occupant Loans on < 5 Family Dwellings (A B C & D)
G) Loans On Manufactured Home Dwelling (A B C & D)
Detailed PMIC statistics for the following Tracts:0503.00
2002 - 2018 National Fire Incident Reporting System (NFIRS) incidents
Based on the data from the years 2002 - 2018 the average number of fire incidents per year is 14. The highest number of reported fire incidents - 30 took place in 2013, and the least - 2 in 2002. The data has an increasing trend.
When looking into fire subcategories, the most reports belonged to: Outside Fires (39.5%), and Structure Fires (36.9%).
Fire incident types reported to NFIRS in Zip Code 22625


 Nearest zip codes: 26817, 22637, 22603, 25434, 25422, 26711.


 (Students: 66, Location: 1463 NEW HOPE RD, Grades: UG-12, Boys only)

 Based on the data from the years 2002 - 2018 the average number of fire incidents per year is 14. The highest number of reported fire incidents - 30 took place in 2013, and the least - 2 in 2002. The data has an increasing trend.
 When looking into fire subcategories, the most reports belonged to: Outside Fires (39.5%), and Structure Fires (36.9%).