Estimated zip code population in 2022: 3,329 Zip code population in 2010: 2,936 Zip code population in 2000: 2,458
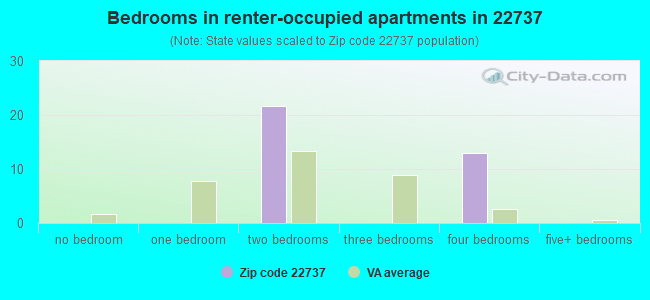
Houses and condos: 1,165 Renter-occupied apartments: 35
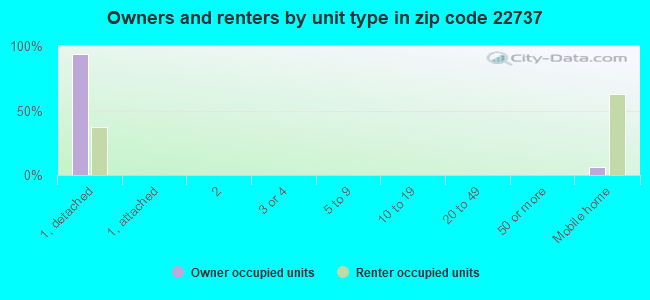
% of renters here:
3%
State:
33%
March 2022 cost of living index in zip code 22737: 124.6 (high, U.S. average is 100)
Land area: 40.3 sq. mi. Water area: 0.4 sq. mi.
Population density: 83 people per square mile
(very low).
OSM Map
General Map
Google Map
MSN Map
OSM Map
General Map
Google Map
MSN Map
OSM Map
General Map
Google Map
MSN Map
OSM Map
General Map
Google Map
MSN Map
Please wait while loading the map...
Real estate property taxes paid for housing units in 2022:
This zip code:
0.6% ($2,103)
Virginia:
0.7% ($2,617)
Median real estate property taxes paid for housing units with mortgages in 2022: $2,141 (0.6%) Median real estate property taxes paid for housing units with no mortgage in 2022: $2,021 (0.5%)
Business Search- 14 Million verified businesses
Males: 1,896
(57.0%)
Females: 1,433
(43.0%)
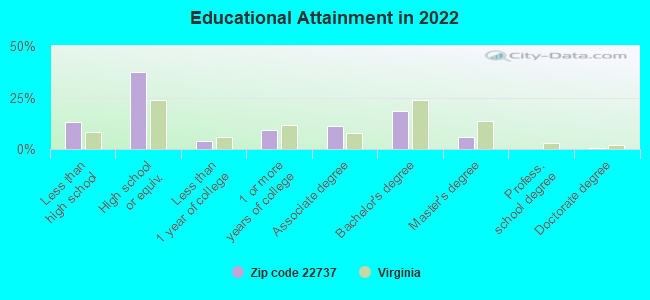
For population 25 years and over in 22737:
High school or higher: 86.3%
Bachelor's degree or higher: 24.9%
Graduate or professional degree: 6.5%
Unemployed: 1.7%
Mean travel time to work (commute): 41.1 minutes
For population 15 years and over in 22737:
Never married: 21.7%
Now married: 58.1%
Separated: 1.2%
Widowed: 9.5%
Divorced: 9.5%
Zip code 22737 compared to state average:
Unemployed percentage below state average.
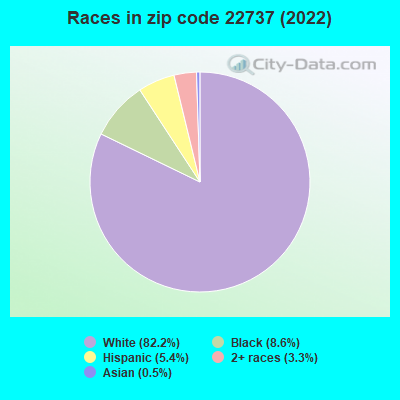
Black race population percentage below state average.
Hispanic race population percentage below state average.
Median age significantly above state average.
Foreign-born population percentage significantly below state average.
Renting percentage significantly below state average.
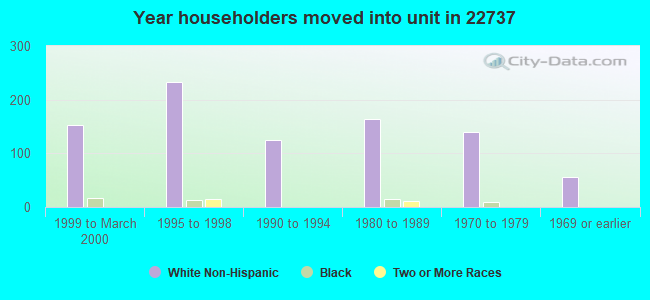
Length of stay since moving in significantly above state average.
House age below state average.
Number of college students below state average.
Percentage of population with a bachelor's degree or higher below state average.
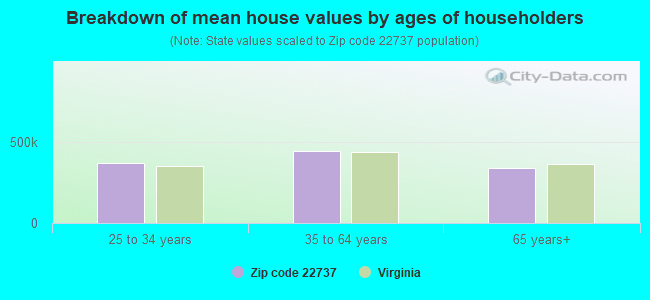
Estimated median house/condo value in 2022: $381,090
22737:
$381,090
Virginia:
$365,700
According to our research of Virginia and other state lists, there were 6 registered sex offenders living in 22737 zip code as of April 25, 2024. The ratio of all residents to sex offenders in zip code 22737 is 490 to 1. The ratio of registered sex offenders to all residents in this zip code is lower than the state average.
Median resident age:
This zip code:
47.1 years
Virginia median age:
39.0 years
Average household size:
This zip code:
2.8 people
Virginia:
2.5 people
Averages for the 2020 tax year for zip code 22737, filed in 2021:
Average Adjusted Gross Income (AGI) in 2020: $74,135 (Individual Income Tax Returns)
Here:
$74,135
State:
$86,446
Salary/wage: $66,058 (reported on 81.2% of returns)
Here:
$66,058
State:
$71,185
(% of AGI for various income ranges: 1218.0% for AGIs below $25k, 3431.0% for AGIs $25k-50k, 7292.9% for AGIs $50k-75k, 9430.0% for AGIs $75k-100k, 19571.1% for AGIs $100k-200k, 44542.5% for AGIs over 200k)
Taxable interest for individuals: $1,152 (reported on 27.9% of returns)
This zip code:
$1,152
Virginia:
$1,805
(% of AGI for various income ranges: 25.3% for AGIs below $25k, 15.0% for AGIs $25k-50k, 42.9% for AGIs $50k-75k, 108.3% for AGIs $75k-100k, 73.3% for AGIs $100k-200k, 217.5% for AGIs over 200k)
Ordinary dividends: $3,686 (reported on 17.6% of returns)
Here:
$3,686
State:
$8,327
(% of AGI for various income ranges: 22.0% for AGIs below $25k, 49.3% for AGIs $25k-50k, 30.0% for AGIs $50k-75k, 71.7% for AGIs $75k-100k, 213.9% for AGIs $100k-200k, 855.0% for AGIs over 200k)
Net capital gain/loss in AGI: +$9,943 (reported on 17.0% of returns)
Here:
+$9,943
State:
+$24,644
(% of AGI for various income ranges: 17.0% for AGIs below $25k, 37.0% for AGIs $25k-50k, 47.9% for AGIs $50k-75k, 110.8% for AGIs $75k-100k, 229.4% for AGIs $100k-200k, 5022.5% for AGIs over 200k)
Profit/loss from business: +$16,440 (reported on 18.2% of returns)
Here:
+$16,440
State:
+$12,836
(% of AGI for various income ranges: 232.3% for AGIs below $25k, 443.7% for AGIs $25k-50k, 361.4% for AGIs $50k-75k, 421.7% for AGIs $75k-100k, 1051.1% for AGIs $100k-200k)
Taxable individual retirement arrangement distribution: $21,773 (reported on 6.7% of returns)
22737:
$21,773
Virginia:
$21,535
(% of AGI for various income ranges: 57.0% for AGIs below $25k, 65.7% for AGIs $25k-50k, 400.8% for AGIs $75k-100k, 858.9% for AGIs $100k-200k)
Total itemized deductions: $28,717 (reported on 13.9% of returns)
Here:
$28,717
State:
$33,287
(% of AGI for various income ranges: 195.3% for AGIs below $25k, 406.4% for AGIs $50k-75k, 733.3% for AGIs $75k-100k, 1451.7% for AGIs $100k-200k, 4892.5% for AGIs over 200k)
Charity contributions: $10,027 (reported on 9.1% of returns)
Here:
$10,027
State:
$10,381
(% of AGI for various income ranges: 47.3% for AGIs $25k-50k, 126.7% for AGIs $75k-100k, 360.6% for AGIs $100k-200k, 1402.5% for AGIs over 200k)
Taxes paid: $7,761 (reported on 13.9% of returns)
22737:
$7,761
State:
$8,284
(% of AGI for various income ranges: 30.7% for AGIs below $25k, 107.9% for AGIs $50k-75k, 210.0% for AGIs $75k-100k, 421.1% for AGIs $100k-200k, 1330.0% for AGIs over 200k)
Earned income credit: $2,186 (reported on 12.7% of returns)
Here:
$2,186
State:
$2,214
(% of AGI for various income ranges: 82.0% for AGIs below $25k, 71.0% for AGIs $25k-50k)
Percentage of individuals using paid preparers for their 2020 taxes: 89.7%
Here:
90%
State:
92%
(% for various income ranges: 88.6% for AGIs below $25k, 87.2% for AGIs $25k-50k, 95.2% for AGIs $50k-75k, 88.9% for AGIs $75k-100k, 90.9% for AGIs $100k-200k, 90.0% for AGIs over 200k)
Averages for the 2012 tax year for zip code 22737, filed in 2013:
Average Adjusted Gross Income (AGI) in 2012: $59,027 (Individual Income Tax Returns)
Here:
$59,027
State:
$71,192
Salary/wage: $52,477 (reported on 85.7% of returns)
Here:
$52,477
State:
$59,229
(% of AGI for various income ranges: 74.7% for AGIs below $25k, 77.4% for AGIs $25k-50k, 81.4% for AGIs $50k-75k, 80.8% for AGIs $75k-100k, 77.4% for AGIs $100k-200k, 60.6% for AGIs over 200k)
Taxable interest for individuals: $572 (reported on 32.9% of returns)
This zip code:
$572
Virginia:
$1,600
(% of AGI for various income ranges: 0.9% for AGIs below $25k, 0.4% for AGIs $25k-50k, 0.3% for AGIs $50k-75k, 0.2% for AGIs $75k-100k, 0.3% for AGIs $100k-200k, 0.1% for AGIs over 200k)
Ordinary dividends: $2,300 (reported on 17.9% of returns)
Here:
$2,300
State:
$6,959
(% of AGI for various income ranges: 1.1% for AGIs below $25k, 1.1% for AGIs $25k-50k, 0.7% for AGIs $50k-75k, 0.2% for AGIs $75k-100k, 1.0% for AGIs $100k-200k)
Net capital gain/loss in AGI: +$3,538 (reported on 11.4% of returns)
Here:
+$3,538
State:
+$16,672
(% of AGI for various income ranges: 0.3% for AGIs $50k-75k, 2.0% for AGIs $100k-200k)
Profit/loss from business: +$17,083 (reported on 20.7% of returns)
Here:
+$17,083
State:
+$14,116
(% of AGI for various income ranges: 14.7% for AGIs below $25k, 6.0% for AGIs $25k-50k, 6.5% for AGIs $50k-75k, 4.0% for AGIs $75k-100k, 7.2% for AGIs $100k-200k)
Taxable individual retirement arrangement distribution: $14,164 (reported on 7.9% of returns)
22737:
$14,164
Virginia:
$16,667
(% of AGI for various income ranges: 2.2% for AGIs below $25k, 2.3% for AGIs $25k-50k, 2.5% for AGIs $50k-75k, 3.1% for AGIs $100k-200k)
Total itemized deductions: $22,797 (24% of AGI, reported on 42.9% of returns)
Here:
$22,797
State:
$26,596
Here:
23.6% of AGI
State:
20.1% of AGI
(% of AGI for various income ranges: 10.6% for AGIs below $25k, 16.4% for AGIs $25k-50k, 15.4% for AGIs $50k-75k, 19.3% for AGIs $75k-100k, 18.5% for AGIs $100k-200k, 13.0% for AGIs over 200k)
Charity contributions: $3,204 (reported on 32.9% of returns)
Here:
$3,204
State:
$4,443
(% of AGI for various income ranges: 0.9% for AGIs below $25k, 1.3% for AGIs $25k-50k, 1.4% for AGIs $50k-75k, 2.1% for AGIs $75k-100k, 2.1% for AGIs $100k-200k, 2.0% for AGIs over 200k)
Taxes paid: $7,057 (reported on 42.9% of returns)
22737:
$7,057
State:
$9,951
(% of AGI for various income ranges: 2.0% for AGIs below $25k, 3.1% for AGIs $25k-50k, 4.4% for AGIs $50k-75k, 5.6% for AGIs $75k-100k, 6.4% for AGIs $100k-200k, 6.1% for AGIs over 200k)
Earned income credit: $2,154 (reported on 17.1% of returns)
Here:
$2,154
State:
$2,211
(% of AGI for various income ranges: 6.6% for AGIs below $25k, 1.1% for AGIs $25k-50k)
Percentage of individuals using paid preparers for their 2012 taxes: 51.4%
Here:
51%
State:
46%
(% for various income ranges: 50.0% for AGIs below $25k, 51.6% for AGIs $25k-50k, 54.5% for AGIs $50k-75k, 50.0% for AGIs $75k-100k, 50.0% for AGIs $100k-200k, 66.7% for AGIs over 200k)
Averages for the 2004 tax year for zip code 22737, filed in 2005:
Average Adjusted Gross Income (AGI) in 2004: $52,243 (Individual Income Tax Returns)
Here:
$52,243
State:
$56,704
Salary/wage: $46,406 (reported on 84.8% of returns)
Here:
$46,406
State:
$48,441
(% of AGI for various income ranges: 97.6% for AGIs below $10k, 79.8% for AGIs $10k-25k, 78.9% for AGIs $25k-50k, 82.4% for AGIs $50k-75k, 83.4% for AGIs $75k-100k, 64.7% for AGIs over 100k)
Taxable interest for individuals: $1,247 (reported on 40.7% of returns)
This zip code:
$1,247
Virginia:
$1,688
(% of AGI for various income ranges: 3.4% for AGIs below $10k, 1.0% for AGIs $10k-25k, 1.2% for AGIs $25k-50k, 1.1% for AGIs $50k-75k, 0.6% for AGIs $75k-100k, 0.9% for AGIs over 100k)
Taxable dividends: $1,648 (reported on 19.2% of returns)
Here:
$1,648
State:
$4,028
(% of AGI for various income ranges: 0.8% for AGIs below $10k, 0.4% for AGIs $10k-25k, 0.8% for AGIs $25k-50k, 0.5% for AGIs $50k-75k, 0.4% for AGIs $75k-100k, 0.7% for AGIs over 100k)
Net capital gain/loss: +$11,788 (reported on 15.0% of returns)
Here:
+$11,788
State:
+$14,375
(% of AGI for various income ranges: -2.0% for AGIs below $10k, 0.5% for AGIs $10k-25k, 0.3% for AGIs $25k-50k, 0.7% for AGIs $50k-75k, 0.2% for AGIs $75k-100k, 8.3% for AGIs over 100k)
Profit/loss from business: +$17,022 (reported on 21.3% of returns)
Here:
+$17,022
State:
+$13,342
(% of AGI for various income ranges: 26.7% for AGIs below $10k, 9.1% for AGIs $10k-25k, 6.6% for AGIs $25k-50k, 3.8% for AGIs $50k-75k, 4.9% for AGIs $75k-100k, 8.8% for AGIs over 100k)
IRA payment deduction: $2,462 (reported on 2.0% of returns)
22737:
$2,462
Virginia:
$2,943
Total itemized deductions: $19,454 (23% of AGI, reported on 45.3% of returns)
Here:
$19,454
State:
$21,492
Here:
23.0% of AGI
State:
21.0% of AGI
(% of AGI for various income ranges: 16.3% for AGIs $10k-25k, 15.5% for AGIs $25k-50k, 20.5% for AGIs $50k-75k, 19.8% for AGIs $75k-100k, 14.7% for AGIs over 100k)
Charity contributions deductions: $2,688 (3% of AGI, reported on 36.0% of returns)
Here:
$2,688
State:
$3,794
Here:
3.0% of AGI
State:
3.5% of AGI
(% of AGI for various income ranges: 0.7% for AGIs $10k-25k, 1.3% for AGIs $25k-50k, 2.0% for AGIs $50k-75k, 2.4% for AGIs $75k-100k, 2.0% for AGIs over 100k)
Total tax: $7,544 (reported on 80.1% of returns)
22737:
$7,544
State:
$9,537
(% of AGI for various income ranges: 5.7% for AGIs below $10k, 4.9% for AGIs $10k-25k, 7.2% for AGIs $25k-50k, 8.1% for AGIs $50k-75k, 9.8% for AGIs $75k-100k, 17.5% for AGIs over 100k)
Earned income credit: $1,521 (reported on 15.1% of returns)
Here:
$1,521
State:
$1,734
Percentage of individuals using paid preparers for their 2004 taxes: 59.3%
Here:
59%
State:
52%
(% for various income ranges: 51.8% for AGIs below $10k, 65.6% for AGIs $10k-25k, 59.8% for AGIs $25k-50k, 62.6% for AGIs $50k-75k, 54.9% for AGIs $75k-100k, 57.9% for AGIs over 100k)
Household received Food Stamps/SNAP in the past 12 months: 60 Household did not receive Food Stamps/SNAP in the past 12 months: 1,101
Women who had a birth in the past 12 months: 24 (24 now married, 0 unmarried) Women who did not have a birth in the past 12 months: 445 (276 now married, 166 unmarried)
Housing units in zip code 22737 with a mortgage: 847 (88 second mortgage, 75 both second mortgage and home equity loan) Houses without a mortgage: 52
Median monthly owner costs for units with a mortgage: $1,505 Median monthly owner costs for units without a mortgage: $710
Residents with income below the poverty level in 2022:
This zip code:
0.4%
Whole state:
10.6%
Residents with income below 50% of the poverty level in 2022:
This zip code:
0.4%
Whole state:
5.2%
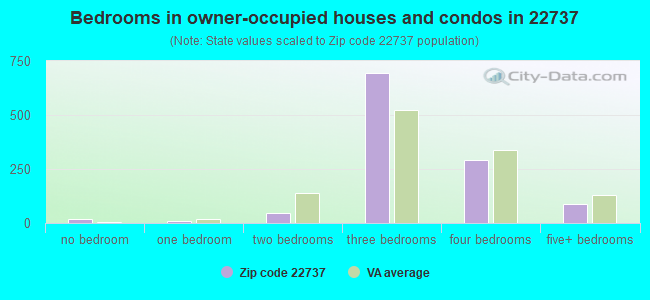
Median number of rooms in houses and condos:
Here:
6.2
State:
7.0
Median number of rooms in apartments:
Here:
5.0
State:
4.3
Notable locations in this zip code not listed on our city pages
Churches in zip code 22737 include: Beulah Church (A), Black Oak Church (B), Shiloh Church (C), Clarksburg Church (D), Gourdvine Church (E), Hazel River Assembly Church (F), Oak Shade Church (G). Display/hide their locations on the map
Streams, rivers, and creeks: Waterford Run (A), Thornton River (B), Muddy Run (C), Hoppers Branch (D), Duncan Run (E), Indian Run (F), Apperson Creek (G). Display/hide their locations on the map
Size of family households: 471 2-persons, 244 3-persons, 109 4-persons, 63 5-persons, 93 6-persons, 22 7-or-more-persons
Size of nonfamily households: 169 1-person
668 married couples with children.
81 single-parent households (34 men, 47 women).
94.5% of residents of 22737 zip code speak English at home.
5.1% of residents speak Spanish at home (56% very well, 16% well, 28% not well).
0.3% of residents speak other Indo-European language at home (100% very well).
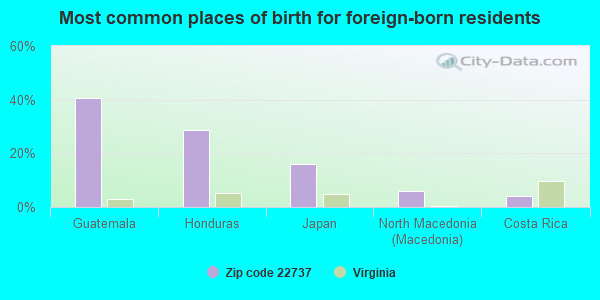
Foreign born population: 98 (3.0%) (34.4% of them are naturalized citizens)
This zip code:
3.0%
Whole state:
12.7%
41%Guatemala
29%Honduras
16%Japan
6%North Macedonia (Macedonia)
4%Costa Rica
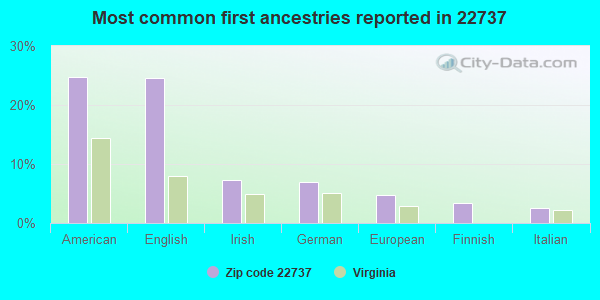
25%American
25%English
7%Irish
7%German
5%European
3%Finnish
3%Italian
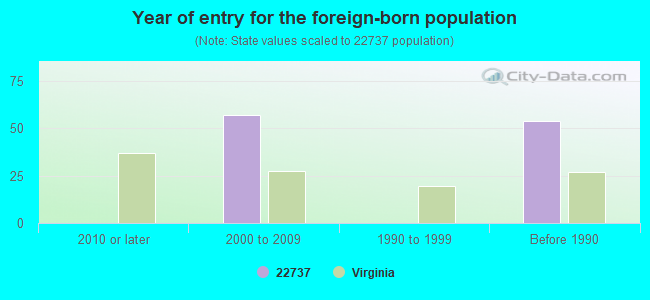
Year of entry for the foreign-born population
02010 or later
572000 to 2009
01990 to 1999
54Before 1990
Housing units lacking complete plumbing facilities: 0.6% Housing units lacking complete kitchen facilities: 0.6%
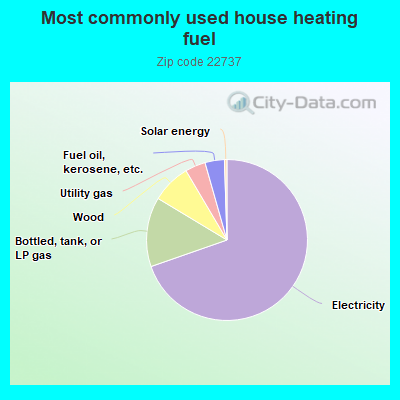
69.8%Electricity
14.0%Bottled, tank, or LP gas
7.9%Wood
4.1%Utility gas
3.9%Fuel oil, kerosene, etc.
0.5%Solar energy
Population in 1990: 2,540.
Place of birth for U.S.-born residents:
This state: 1,980
Northeast: 312
Midwest: 220
South: 603
West: 82
62% of the 22737 zip code residents lived in the same house 5 years ago. Out of people who lived in different houses, 29% lived in this county. Out of people who lived in different counties, 50% lived in Virginia.
91% of the 22737 zip code residents lived in the same house 1 year ago. Out of people who lived in different houses, 34% moved from this county. Out of people who lived in different houses, 46% moved from different county within same state. Out of people who lived in different houses, 21% moved from different state.
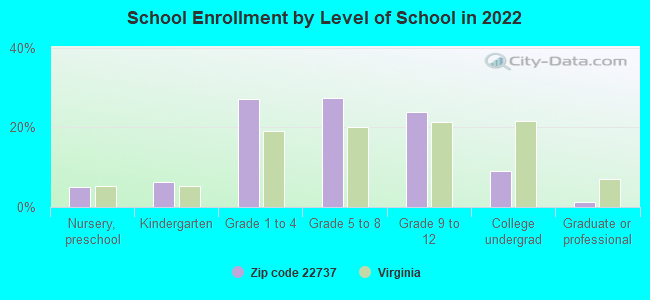
Private vs. public school enrollment:
Students in private schools in grades 1 to 8 (elementary and middle school): 82
Here:
21.2%
Virginia:
13.2%
Students in private schools in grades 9 to 12 (high school):
Here:
0.0%
Virginia:
10.2%
Students in private undergraduate colleges: 8
Here:
13.0%
Virginia:
18.7%
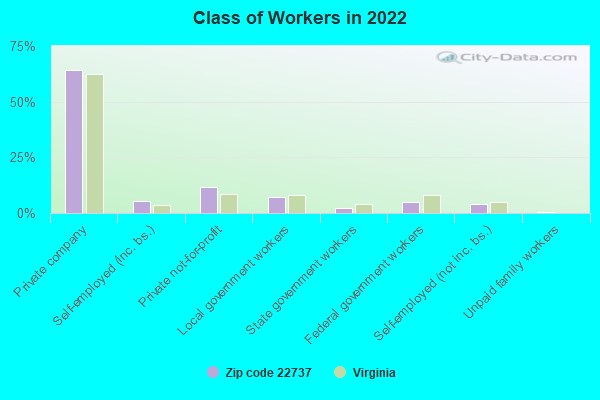
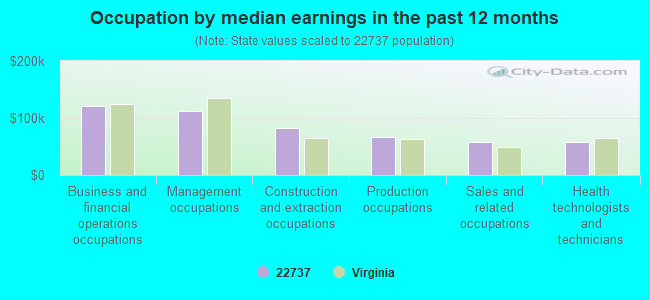
Occupation by median earnings in the past 12 months ($)
121,414Business and financial operations occupations
111,491Management occupations
82,266Construction and extraction occupations
67,326Production occupations
58,742Sales and related occupations
57,139Health technologists and technicians
Top industries in this zip code by the number of employees in 2005:
Administrative and Support and Waste Management and Remediation Services: Landscaping Services (5-9: 1, 1-4: 4)
Finance and Insurance: Claims Adjusting (10-19: 1)
Construction: Drywall and Insulation Contractors (10-19: 1)
Construction: Plumbing, Heating, and Air-Conditioning Contractors (5-9: 1, 1-4: 3)
Other Services (except Public Administration): Religious Organizations (5-9: 1, 1-4: 1)
Construction: New Single-Family Housing Construction (except Operative Builders) (1-4: 4)
Construction: Site Preparation Contractors (1-4: 4)
Health Care and Social Assistance: Home Health Care Services (5-9: 1)
Fatal accident statistics in 2013:
Fatal accident count: 1
Vehicles involved in fatal accidents: 1
Fatal accidents caused by drunken drivers: 0
Fatalities: 1
Persons involved in fatal accidents: 1
Pedestrians involved in fatal accidents: 0
Fatal accident statistics in 2012:
Fatal accident count: 2
Vehicles involved in fatal accidents: 4
Fatal accidents caused by drunken drivers: 0
Fatalities: 2
Persons involved in fatal accidents: 6
Pedestrians involved in fatal accidents: 0
Home Mortgage Disclosure Act Aggregated Statistics For Year 2003 (Based on 2 partial tracts)
A) FHA, FSA/RHS & VA Home Purchase Loans
B) Conventional Home Purchase Loans
C) Refinancings
D) Home Improvement Loans
F) Non-occupant Loans on < 5 Family Dwellings (A B C & D)
Number
Average Value
Number
Average Value
Number
Average Value
Number
Average Value
Number
Average Value
LOANS ORIGINATED
22
$185,597
170
$201,457
791
$173,184
32
$60,949
22
$156,367
APPLICATIONS APPROVED, NOT ACCEPTED
0
$0
18
$154,211
103
$149,993
12
$34,850
1
$73,240
APPLICATIONS DENIED
1
$220,450
21
$155,897
156
$149,175
28
$32,409
2
$68,845
APPLICATIONS WITHDRAWN
2
$206,170
14
$233,949
107
$166,173
7
$37,143
4
$267,325
FILES CLOSED FOR INCOMPLETENESS
1
$174,310
2
$301,015
24
$186,365
1
$58,590
1
$81,300
Detailed HMDA statistics for the following Tracts:9901.00
Private Mortgage Insurance Companies Aggregated Statistics For Year 2003 (Based on 2 partial tracts)
A) Conventional Home Purchase Loans
B) Refinancings
C) Non-occupant Loans on < 5 Family Dwellings (A & B)
Number
Average Value
Number
Average Value
Number
Average Value
LOANS ORIGINATED
20
$227,080
33
$209,999
1
$71,780
APPLICATIONS APPROVED, NOT ACCEPTED
4
$253,410
12
$187,922
0
$0
APPLICATIONS DENIED
0
$0
1
$153,070
0
$0
APPLICATIONS WITHDRAWN
1
$145,750
3
$206,050
0
$0
FILES CLOSED FOR INCOMPLETENESS
0
$0
0
$0
0
$0
Detailed PMIC statistics for the following Tracts:9901.00
2002 - 2018 National Fire Incident Reporting System (NFIRS) incidents
According to the data from the years 2002 - 2018 the average number of fires per year is 14. The highest number of reported fire incidents - 28 took place in 2006, and the least - 4 in 2002. The data has a growing trend.
When looking into fire subcategories, the most incidents belonged to: Structure Fires (46.8%), and Outside Fires (37.8%).
Fire incident types reported to NFIRS in Zip Code 22737

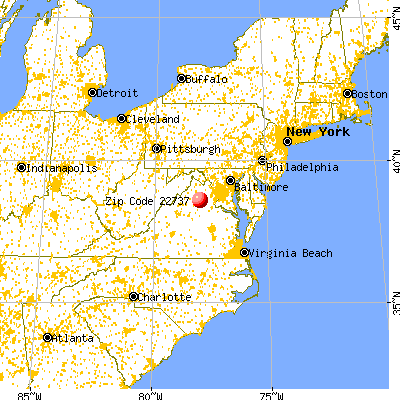


 Nearest zip codes: 22716, 22713, 20106, 22724, 22714, 22701.
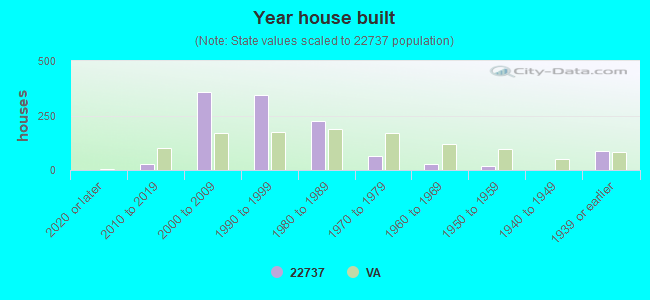


 According to the data from the years 2002 - 2018 the average number of fires per year is 14. The highest number of reported fire incidents - 28 took place in 2006, and the least - 4 in 2002. The data has a growing trend.
 When looking into fire subcategories, the most incidents belonged to: Structure Fires (46.8%), and Outside Fires (37.8%).