Estimated zip code population in 2022: 6,320 Zip code population in 2010: 4,853 Zip code population in 2000: 4,389
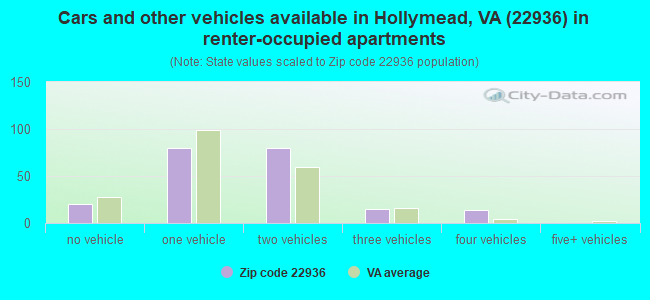
Houses and condos: 2,265 Renter-occupied apartments: 210
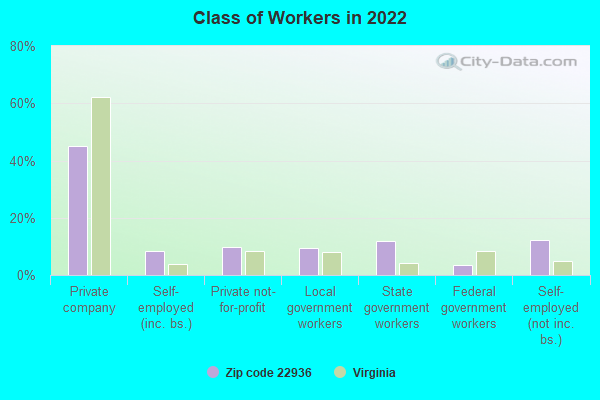
% of renters here:
9%
State:
33%
March 2022 cost of living index in zip code 22936: 86.9 (less than average, U.S. average is 100)
Land area: 36.4 sq. mi. Water area: 0.7 sq. mi.
Population density: 173 people per square mile
(very low).
OSM Map
General Map
Google Map
MSN Map
OSM Map
General Map
Google Map
MSN Map
OSM Map
General Map
Google Map
MSN Map
OSM Map
General Map
Google Map
MSN Map
Please wait while loading the map...
Real estate property taxes paid for housing units in 2022:
This zip code:
0.7% ($3,592)
Virginia:
0.7% ($2,617)
Median real estate property taxes paid for housing units with mortgages in 2022: $3,854 (0.7%) Median real estate property taxes paid for housing units with no mortgage in 2022: $3,364 (0.7%)
Business Search- 14 Million verified businesses
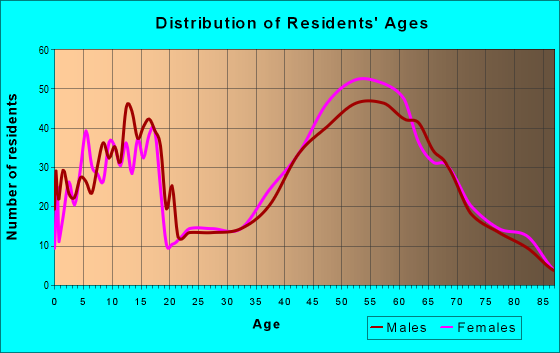
Males: 3,020
(47.8%)
Females: 3,299
(52.2%)
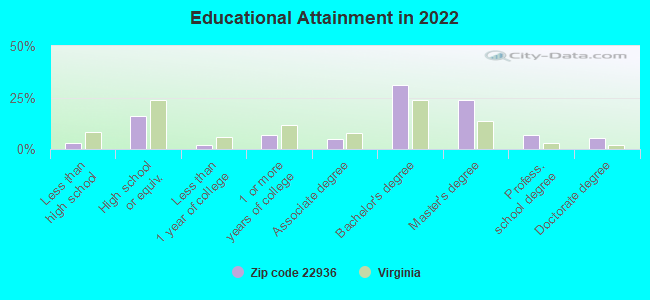
For population 25 years and over in 22936:
High school or higher: 98.5%
Bachelor's degree or higher: 68.3%
Graduate or professional degree: 36.6%
Unemployed: 2.9%
Mean travel time to work (commute): 23.8 minutes
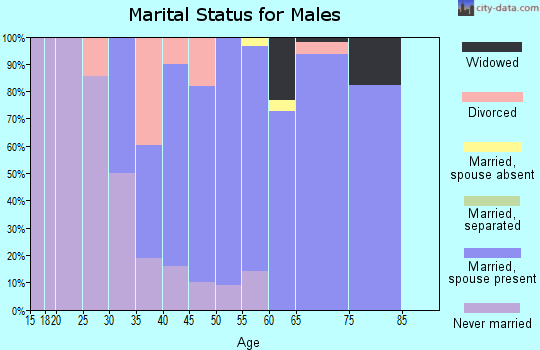
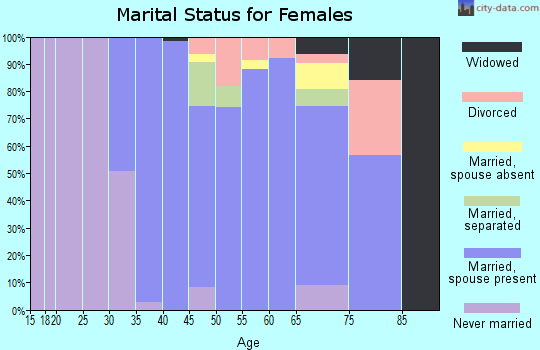
For population 15 years and over in 22936:
Never married: 26.7%
Now married: 64.2%
Separated: 1.4%
Widowed: 3.6%
Divorced: 4.0%
Zip code 22936 compared to state average:
Median household income above state average.
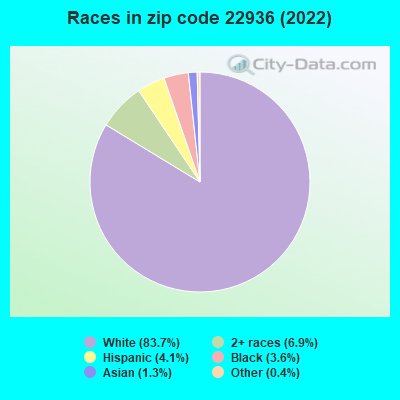
Black race population percentage significantly below state average.
Hispanic race population percentage below state average.
Median age above state average.
Foreign-born population percentage significantly below state average.
Renting percentage significantly below state average.
Length of stay since moving in significantly above state average.
Number of rooms per house above state average.
Percentage of population with a bachelor's degree or higher above state average.
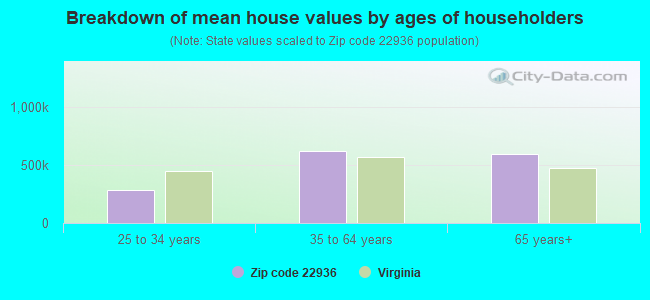
Estimated median house/condo value in 2022: $513,250
22936:
$513,250
Virginia:
$365,700
According to our research of Virginia and other state lists, there were 7 registered sex offenders living in 22936 zip code as of April 27, 2024. The ratio of all residents to sex offenders in zip code 22936 is 715 to 1. The ratio of registered sex offenders to all residents in this zip code is lower than the state average.
Median resident age:
This zip code:
44.9 years
Virginia median age:
39.0 years
Average household size:
This zip code:
2.8 people
Virginia:
2.5 people
Averages for the 2020 tax year for zip code 22936, filed in 2021:
Average Adjusted Gross Income (AGI) in 2020: $126,723 (Individual Income Tax Returns)
Here:
$126,723
State:
$86,446
Salary/wage: $99,450 (reported on 76.7% of returns)
Here:
$99,450
State:
$71,185
(% of AGI for various income ranges: 1206.8% for AGIs below $25k, 3640.0% for AGIs $25k-50k, 5614.0% for AGIs $50k-75k, 8749.4% for AGIs $75k-100k, 17504.3% for AGIs $100k-200k, 89060.0% for AGIs over 200k)
Taxable interest for individuals: $2,175 (reported on 49.1% of returns)
This zip code:
$2,175
Virginia:
$1,805
(% of AGI for various income ranges: 25.5% for AGIs below $25k, 55.6% for AGIs $25k-50k, 111.5% for AGIs $50k-75k, 180.6% for AGIs $75k-100k, 262.6% for AGIs $100k-200k, 1020.8% for AGIs over 200k)
Ordinary dividends: $12,675 (reported on 41.5% of returns)
Here:
$12,675
State:
$8,327
(% of AGI for various income ranges: 107.5% for AGIs below $25k, 172.2% for AGIs $25k-50k, 339.0% for AGIs $50k-75k, 382.5% for AGIs $75k-100k, 909.4% for AGIs $100k-200k, 7496.7% for AGIs over 200k)
Net capital gain/loss in AGI: +$23,761 (reported on 38.2% of returns)
Here:
+$23,761
State:
+$24,644
(% of AGI for various income ranges: 48.2% for AGIs below $25k, 92.5% for AGIs $25k-50k, 362.0% for AGIs $50k-75k, 394.4% for AGIs $75k-100k, 1041.4% for AGIs $100k-200k, 16216.7% for AGIs over 200k)
Profit/loss from business: +$21,348 (reported on 21.1% of returns)
Here:
+$21,348
State:
+$12,836
(% of AGI for various income ranges: 121.2% for AGIs below $25k, 325.0% for AGIs $25k-50k, 422.0% for AGIs $50k-75k, 405.0% for AGIs $75k-100k, 994.9% for AGIs $100k-200k, 4902.5% for AGIs over 200k)
Taxable individual retirement arrangement distribution: $31,012 (reported on 14.5% of returns)
22936:
$31,012
Virginia:
$21,535
(% of AGI for various income ranges: 56.5% for AGIs below $25k, 86.6% for AGIs $25k-50k, 390.5% for AGIs $50k-75k, 790.0% for AGIs $75k-100k, 1158.0% for AGIs $100k-200k, 4836.7% for AGIs over 200k)
Self-employed (Keogh) retirement plans: $27,080 (reported on 1.8% of returns)
22936:
$27,080
Virginia:
$31,172
(% of AGI for various income ranges: 1128.3% for AGIs over 200k)
Total itemized deductions: $38,212 (reported on 18.9% of returns)
Here:
$38,212
State:
$33,287
(% of AGI for various income ranges: 363.1% for AGIs $25k-50k, 387.5% for AGIs $50k-75k, 649.4% for AGIs $75k-100k, 1932.9% for AGIs $100k-200k, 8440.8% for AGIs over 200k)
Charity contributions: $13,176 (reported on 16.4% of returns)
Here:
$13,176
State:
$10,381
(% of AGI for various income ranges: 30.8% for AGIs below $25k, 56.0% for AGIs $50k-75k, 93.8% for AGIs $75k-100k, 454.6% for AGIs $100k-200k, 3294.2% for AGIs over 200k)
Taxes paid: $9,092 (reported on 18.9% of returns)
22936:
$9,092
State:
$8,284
(% of AGI for various income ranges: 64.1% for AGIs $25k-50k, 107.5% for AGIs $50k-75k, 196.2% for AGIs $75k-100k, 535.7% for AGIs $100k-200k, 1765.8% for AGIs over 200k)
Earned income credit: $1,844 (reported on 6.5% of returns)
Here:
$1,844
State:
$2,214
(% of AGI for various income ranges: 47.8% for AGIs below $25k, 44.1% for AGIs $25k-50k)
Percentage of individuals using paid preparers for their 2020 taxes: 89.5%
Here:
89%
State:
92%
(% for various income ranges: 89.1% for AGIs below $25k, 89.1% for AGIs $25k-50k, 87.5% for AGIs $50k-75k, 88.0% for AGIs $75k-100k, 89.6% for AGIs $100k-200k, 92.7% for AGIs over 200k)
Averages for the 2012 tax year for zip code 22936, filed in 2013:
Average Adjusted Gross Income (AGI) in 2012: $101,147 (Individual Income Tax Returns)
Here:
$101,147
State:
$71,192
Salary/wage: $74,507 (reported on 80.2% of returns)
Here:
$74,507
State:
$59,229
(% of AGI for various income ranges: 70.2% for AGIs below $25k, 70.0% for AGIs $25k-50k, 66.7% for AGIs $50k-75k, 65.1% for AGIs $75k-100k, 67.7% for AGIs $100k-200k, 49.1% for AGIs over 200k)
Taxable interest for individuals: $2,177 (reported on 54.3% of returns)
This zip code:
$2,177
Virginia:
$1,600
(% of AGI for various income ranges: 2.7% for AGIs below $25k, 1.3% for AGIs $25k-50k, 1.5% for AGIs $50k-75k, 1.3% for AGIs $75k-100k, 0.8% for AGIs $100k-200k, 1.2% for AGIs over 200k)
Ordinary dividends: $10,041 (reported on 43.0% of returns)
Here:
$10,041
State:
$6,959
(% of AGI for various income ranges: 5.0% for AGIs below $25k, 3.5% for AGIs $25k-50k, 2.4% for AGIs $50k-75k, 3.3% for AGIs $75k-100k, 3.7% for AGIs $100k-200k, 5.2% for AGIs over 200k)
Net capital gain/loss in AGI: +$31,272 (reported on 34.9% of returns)
Here:
+$31,272
State:
+$16,672
(% of AGI for various income ranges: 0.1% for AGIs below $25k, 1.6% for AGIs $25k-50k, 0.7% for AGIs $50k-75k, 1.9% for AGIs $75k-100k, 2.7% for AGIs $100k-200k, 21.2% for AGIs over 200k)
Profit/loss from business: +$29,411 (reported on 20.9% of returns)
Here:
+$29,411
State:
+$14,116
(% of AGI for various income ranges: 10.0% for AGIs below $25k, 5.4% for AGIs $25k-50k, 5.4% for AGIs $50k-75k, 3.4% for AGIs $75k-100k, 4.0% for AGIs $100k-200k, 7.9% for AGIs over 200k)
Taxable individual retirement arrangement distribution: $21,292 (reported on 14.3% of returns)
22936:
$21,292
Virginia:
$16,667
(% of AGI for various income ranges: 2.8% for AGIs below $25k, 2.9% for AGIs $25k-50k, 3.1% for AGIs $50k-75k, 4.1% for AGIs $75k-100k, 4.4% for AGIs $100k-200k, 2.0% for AGIs over 200k)
Self-employment retirement plans: $20,100 (reported on 2.7% of returns)
22936:
$20,100
Virginia:
$25,373
(% of AGI for various income ranges: 0.5% for AGIs $100k-200k, 0.9% for AGIs over 200k)
Total itemized deductions: $30,742 (19% of AGI, reported on 51.2% of returns)
Here:
$30,742
State:
$26,596
Here:
18.6% of AGI
State:
20.1% of AGI
(% of AGI for various income ranges: 16.1% for AGIs below $25k, 14.2% for AGIs $25k-50k, 16.1% for AGIs $50k-75k, 17.3% for AGIs $75k-100k, 16.5% for AGIs $100k-200k, 14.7% for AGIs over 200k)
Charity contributions: $6,769 (reported on 43.4% of returns)
Here:
$6,769
State:
$4,443
(% of AGI for various income ranges: 1.3% for AGIs below $25k, 1.4% for AGIs $25k-50k, 1.9% for AGIs $50k-75k, 2.2% for AGIs $75k-100k, 2.4% for AGIs $100k-200k, 3.8% for AGIs over 200k)
Taxes paid: $11,893 (reported on 51.2% of returns)
22936:
$11,893
State:
$9,951
(% of AGI for various income ranges: 3.1% for AGIs below $25k, 3.4% for AGIs $25k-50k, 5.0% for AGIs $50k-75k, 5.9% for AGIs $75k-100k, 6.5% for AGIs $100k-200k, 6.4% for AGIs over 200k)
Earned income credit: $2,056 (reported on 6.2% of returns)
Here:
$2,056
State:
$2,211
(% of AGI for various income ranges: 3.2% for AGIs below $25k, 0.4% for AGIs $25k-50k)
Percentage of individuals using paid preparers for their 2012 taxes: 45.0%
Here:
45%
State:
46%
(% for various income ranges: 35.1% for AGIs below $25k, 42.2% for AGIs $25k-50k, 48.4% for AGIs $50k-75k, 44.4% for AGIs $75k-100k, 48.1% for AGIs $100k-200k, 66.7% for AGIs over 200k)
Averages for the 2004 tax year for zip code 22936, filed in 2005:
Average Adjusted Gross Income (AGI) in 2004: $75,898 (Individual Income Tax Returns)
Here:
$75,898
State:
$56,704
Salary/wage: $58,990 (reported on 81.8% of returns)
Here:
$58,990
State:
$48,441
(% of AGI for various income ranges: 85.6% for AGIs below $10k, 71.9% for AGIs $10k-25k, 74.7% for AGIs $25k-50k, 71.6% for AGIs $50k-75k, 75.0% for AGIs $75k-100k, 57.2% for AGIs over 100k)
Taxable interest for individuals: $1,903 (reported on 61.3% of returns)
This zip code:
$1,903
Virginia:
$1,688
(% of AGI for various income ranges: 5.1% for AGIs below $10k, 3.0% for AGIs $10k-25k, 2.9% for AGIs $25k-50k, 2.0% for AGIs $50k-75k, 1.5% for AGIs $75k-100k, 1.2% for AGIs over 100k)
Taxable dividends: $6,376 (reported on 45.2% of returns)
Here:
$6,376
State:
$4,028
(% of AGI for various income ranges: 9.5% for AGIs below $10k, 2.3% for AGIs $10k-25k, 2.3% for AGIs $25k-50k, 2.6% for AGIs $50k-75k, 2.7% for AGIs $75k-100k, 4.5% for AGIs over 100k)
Net capital gain/loss: +$18,774 (reported on 37.2% of returns)
Here:
+$18,774
State:
+$14,375
(% of AGI for various income ranges: -3.6% for AGIs below $10k, 0.5% for AGIs $10k-25k, -0.2% for AGIs $25k-50k, 1.5% for AGIs $50k-75k, 3.3% for AGIs $75k-100k, 13.9% for AGIs over 100k)
Profit/loss from business: +$22,223 (reported on 20.7% of returns)
Here:
+$22,223
State:
+$13,342
(% of AGI for various income ranges: 3.5% for AGIs below $10k, 8.1% for AGIs $10k-25k, 6.4% for AGIs $25k-50k, 5.6% for AGIs $50k-75k, 3.4% for AGIs $75k-100k, 6.6% for AGIs over 100k)
IRA payment deduction: $3,682 (reported on 3.6% of returns)
22936:
$3,682
Virginia:
$2,943
(% of AGI for various income ranges: 0.4% for AGIs $25k-50k, 0.4% for AGIs $50k-75k, 0.3% for AGIs $75k-100k, 0.1% for AGIs over 100k)
Self-employed pension: $15,246 (reported on 2.7% of returns)
Here:
$15,246
Virginia:
$17,430
Total itemized deductions: $23,505 (19% of AGI, reported on 51.0% of returns)
Here:
$23,505
State:
$21,492
Here:
19.1% of AGI
State:
21.0% of AGI
(% of AGI for various income ranges: 19.3% for AGIs below $10k, 14.1% for AGIs $10k-25k, 16.3% for AGIs $25k-50k, 16.5% for AGIs $50k-75k, 19.2% for AGIs $75k-100k, 14.9% for AGIs over 100k)
Charity contributions deductions: $4,765 (4% of AGI, reported on 45.1% of returns)
Here:
$4,765
State:
$3,794
Here:
3.7% of AGI
State:
3.5% of AGI
(% of AGI for various income ranges: 0.5% for AGIs below $10k, 1.1% for AGIs $10k-25k, 1.6% for AGIs $25k-50k, 2.1% for AGIs $50k-75k, 2.3% for AGIs $75k-100k, 3.4% for AGIs over 100k)
Total tax: $13,070 (reported on 83.1% of returns)
22936:
$13,070
State:
$9,537
(% of AGI for various income ranges: 3.0% for AGIs below $10k, 5.1% for AGIs $10k-25k, 7.5% for AGIs $25k-50k, 8.9% for AGIs $50k-75k, 9.8% for AGIs $75k-100k, 18.0% for AGIs over 100k)
Earned income credit: $1,390 (reported on 5.8% of returns)
Here:
$1,390
State:
$1,734
Percentage of individuals using paid preparers for their 2004 taxes: 45.5%
Here:
45%
State:
52%
(% for various income ranges: 38.9% for AGIs below $10k, 40.7% for AGIs $10k-25k, 43.7% for AGIs $25k-50k, 43.4% for AGIs $50k-75k, 43.9% for AGIs $75k-100k, 57.5% for AGIs over 100k)
Likely homosexual households (counted as self-reported same-sex unmarried-partner households)
Lesbian couples: 0.0% of all households
Gay men: 0.4% of all households
Household received Food Stamps/SNAP in the past 12 months: 94 Household did not receive Food Stamps/SNAP in the past 12 months: 2,124
Women who had a birth in the past 12 months: 70 (39 now married, 29 unmarried) Women who did not have a birth in the past 12 months: 1,233 (521 now married, 712 unmarried)
Housing units in zip code 22936 with a mortgage: 1,108 (233 second mortgage, 6 home equity loan, 187 both second mortgage and home equity loan) Houses without a mortgage: 57
Median monthly owner costs for units with a mortgage: $2,447 Median monthly owner costs for units without a mortgage: $621
Residents with income below the poverty level in 2022:
This zip code:
3.6%
Whole state:
10.6%
Residents with income below 50% of the poverty level in 2022:
This zip code:
1.2%
Whole state:
5.2%
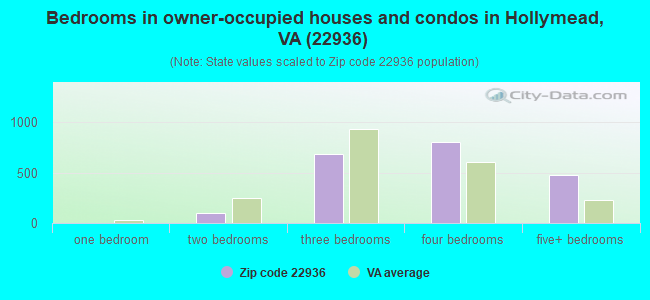
Median number of rooms in houses and condos:
Here:
10.0
State:
7.0
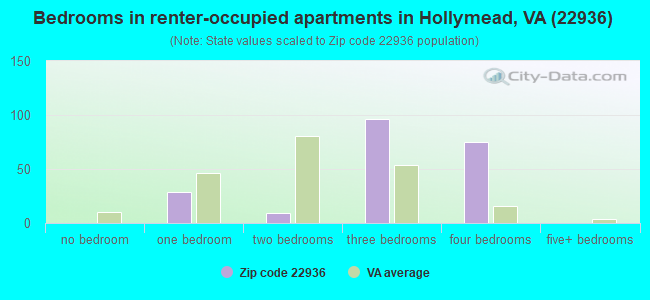
Median number of rooms in apartments:
Here:
5.8
State:
4.3
Notable locations in this zip code not listed on our city pages
Notable locations in zip code 22936: Oaklawn (A), Longwood (B), Goochland County Fire and Rescue Goochland Company Number 5 (C), Earlysville Company 4 Fire Station (D). Display/hide their locations on the map
Reservoirs: Camp Faith Lake (A), Youel Lake (B), Allens Pond (C), Craig Pond (D), Murrays Pond (E), Morris Pond (F), Huckles Pond (G), Chris Greene Lake (H). Display/hide their locations on the map
Streams, rivers, and creeks: Schroeder Branch (A), Piney Creek (B), Naked Creek (C), Fishing Creek (D), Elk Run (E), Beaverdam Creek (F). Display/hide their locations on the map
In group quarters: 1 (-1 institutionalized population)
Size of family households: 857 2-persons, 331 3-persons, 298 4-persons, 214 5-persons, 81 6-persons, 19 7-or-more-persons
Size of nonfamily households: 370 1-person, 58 2-persons
977 married couples with children.
552 single-parent households (168 men, 384 women).
95.8% of residents of 22936 zip code speak English at home.
1.1% of residents speak Spanish at home (82% very well, 18% not at all).
0.9% of residents speak other Indo-European language at home (100% very well).
1.7% of residents speak Asian or Pacific Island language at home (67% very well, 25% well, 8% not well).
0.4% of residents speak other language at home (100% very well).
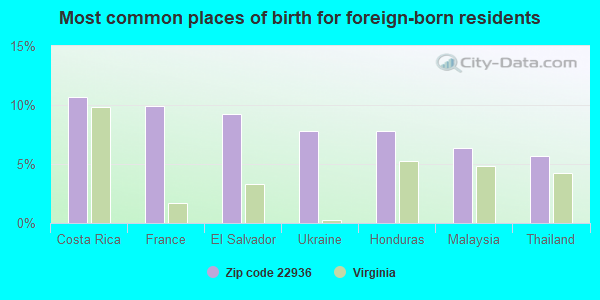
Foreign born population: 141 (2.2%) (58.4% of them are naturalized citizens)
This zip code:
2.2%
Whole state:
12.7%
11%Costa Rica
10%France
9%El Salvador
8%Ukraine
8%Honduras
6%Malaysia
6%Thailand
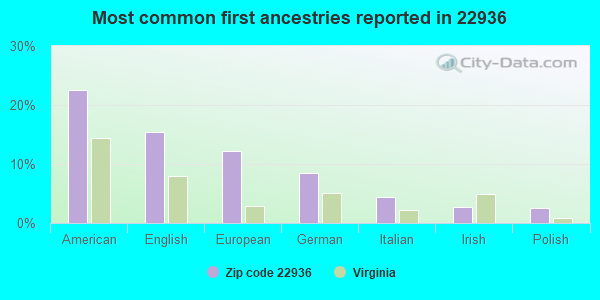
22%American
15%English
12%European
8%German
4%Italian
3%Irish
3%Polish
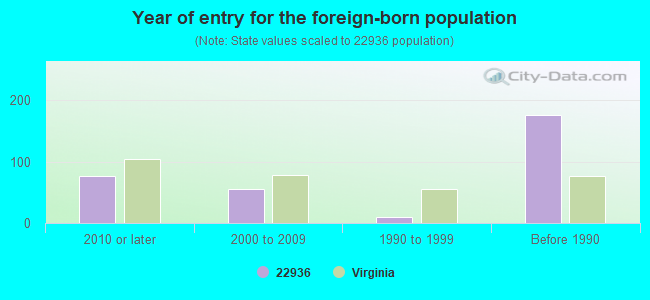
Year of entry for the foreign-born population
762010 or later
552000 to 2009
91990 to 1999
176Before 1990
Facilities with environmental interests located in this zip code:
BROADUS WOOD ELEMENTARY SCHOOL (185 BUCK MT RD in EARLYSVILLE, VA)
AIR MINOR (AIRS/AFS) STATE MASTER (Virginia pollutants databases) - CEDS-40178, AIR PROGRAM Business SIC and NAICS classification: ELEMENTARY AND SECONDARY SCHOOLS Alternative names: BROADUS WOOD ELEM.
AAA APLIANCE (HC01 BOX 67 in EARLYSVILLE, VA)
AIR MINOR (AIRS/AFS) Business SIC classification: REFRIGERATION AND AIR-CONDITIONING SERVICE AND REPAIR SHOPS
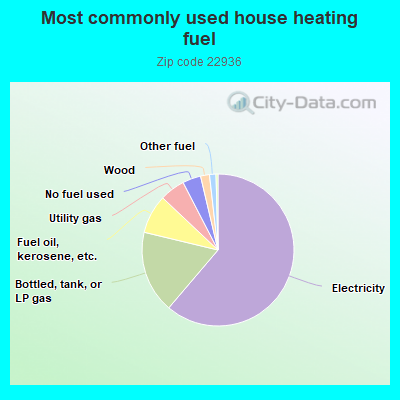
61.4%Electricity
17.6%Bottled, tank, or LP gas
8.3%Fuel oil, kerosene, etc.
5.4%Utility gas
3.9%No fuel used
1.9%Wood
1.4%Other fuel
Population in 1990: 4,294. Population change in the 1990s: +95 (+2.2%).
Place of birth for U.S.-born residents:
This state: 2,893
Northeast: 1,100
Midwest: 352
South: 950
West: 723
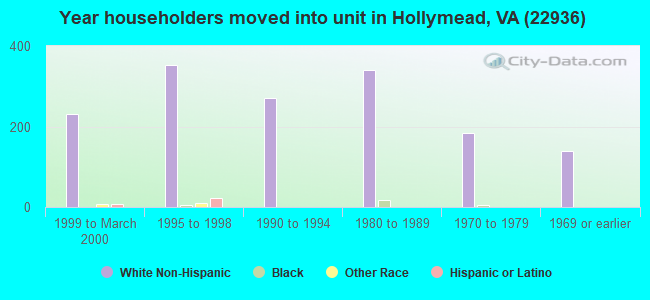
62% of the 22936 zip code residents lived in the same house 5 years ago. Out of people who lived in different houses, 38% lived in this county. Out of people who lived in different counties, 50% lived in Virginia.
94% of the 22936 zip code residents lived in the same house 1 year ago. Out of people who lived in different houses, 50% moved from this county. Out of people who lived in different houses, 28% moved from different county within same state. Out of people who lived in different houses, 17% moved from different state. Out of people who lived in different houses, 8% moved from abroad.
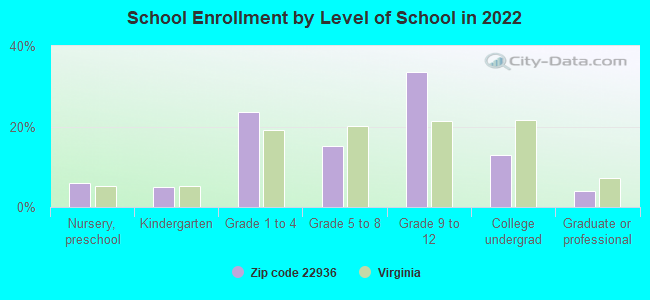
Private vs. public school enrollment:
Students in private schools in grades 1 to 8 (elementary and middle school): 129
Here:
20.9%
Virginia:
13.2%
Students in private schools in grades 9 to 12 (high school): 42
Here:
8.0%
Virginia:
10.2%
Students in private undergraduate colleges: 8
Here:
4.1%
Virginia:
18.7%
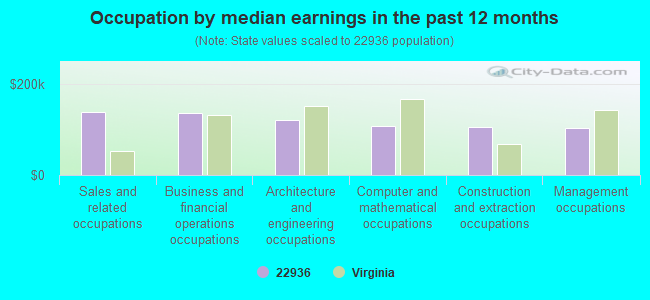
Occupation by median earnings in the past 12 months ($)
138,132Sales and related occupations
138,011Business and financial operations occupations
122,186Architecture and engineering occupations
109,141Computer and mathematical occupations
106,430Construction and extraction occupations
103,547Management occupations
Companies with federal contracts located in this zip code:
NAEVA GEOPHYSICS INC (3343 MINERAL DRIVE in EARLYSVILLE, VA; small business) : $1,265,814 in 13 contractsfrom 2000 to 2006
Contracts for Other Environmental Protection -- Basic Research (R&D), Other Special Studies and Analyses, Engineering and Technical Services, Hazardous Substance Removal, Cleanup, and Disposal Services and Operational Support, and moreby Army, U.S. Army Corps of Engineers - civil program financing only, Navy Signed by year:2000: $285,546; 2001: $288,704; 2002: $0; 2003: $33,876; 2004: $125,508; 2005: $209,512; 2006: $322,668.
Biggest contracts:
$238,704 with Army for Other Environmental Protection -- Basic Research (R&D). Signed on 2001-08-14. Completion date: 2003-09-17.
$205,067 with Army for Other Special Studies and Analyses. Signed on 2006-02-14. Completion date: 2006-12-31.
$125,508 with Army for Engineering and Technical Services. Taking place in MD. Signed on 2004-04-22. Completion date: 2004-06-30.
$123,000 with U.S. Army Corps of Engineers - civil program financing only for Other Environmental Protection -- Basic Research (R&D). Signed on 2000-04-10. Completion date: 2002-04-09.
PHILLIPS, CLIFFORD D (4630 MOCKERNUT LN in EARLYSVILLE, VA; small business)
$3,986 with Army for Radiology Services. Taking place in HI. Signed on 2006-03-13. Completion date: 2006-03-10.
Top industries in this zip code by the number of employees in 2005:
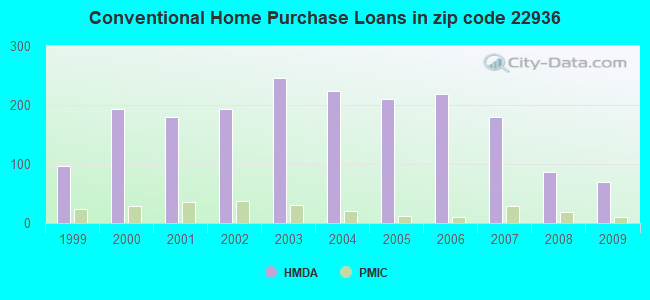
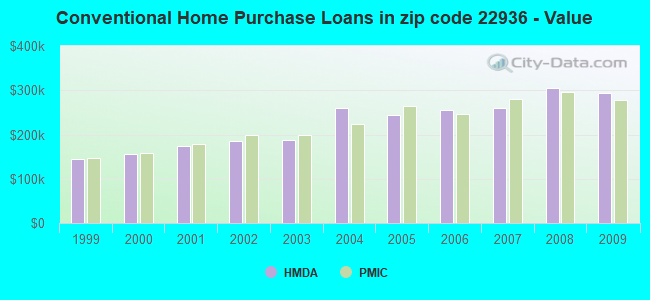
Detailed PMIC statistics for the following Tracts:0102.00
, 0103.00
2004 - 2018 National Fire Incident Reporting System (NFIRS) incidents
According to the data from the years 2004 - 2018 the average number of fire incidents per year is 17. The highest number of fire incidents - 29 took place in 2008, and the least - 5 in 2017. The data has a dropping trend.
When looking into fire subcategories, the most reports belonged to: Outside Fires (51.4%), and Structure Fires (34.6%).
Fire incident types reported to NFIRS in Zip Code 22936


 Nearest zip codes: 22940, 22901, 22911, 22935, 22968, 22904.
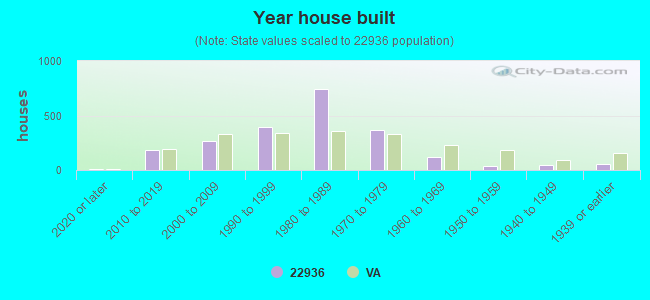


 According to the data from the years 2004 - 2018 the average number of fire incidents per year is 17. The highest number of fire incidents - 29 took place in 2008, and the least - 5 in 2017. The data has a dropping trend.
 When looking into fire subcategories, the most reports belonged to: Outside Fires (51.4%), and Structure Fires (34.6%).